The document provides an overview of the Structure software developed by Pritchard Lab at Stanford University for population structure analysis. It outlines the capabilities of the software, including model-based clustering, identification of genetic populations, and individual assignment, along with technical details regarding input data formats and analysis parameters. The importance of careful parameter configuration and interpretation for effective population structure inference is emphasized.


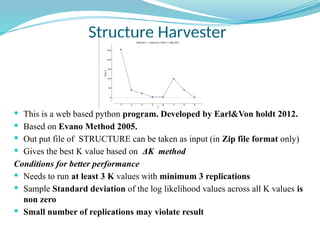
![Inference of true K
(K=number of populations)
The log likelihood for each K, Ln P(D) = L(K)
Two approaches to determine the best K
1. Use of L(K): When K is approaching a true value,
L(K) plateaus (or continues increasing slightly)
and has high variance between runs (Rosenberg et
al. 2001).
Nonparametric test (Wilcoxon test)
2. Use of an ad hoc quantity (ΔK): Calculated based
on the second order rate of change of the
likelihood (ΔK) (Evanno et al. 2005). The ΔK
shows a clear peak at the true value of K.
ΔK = m([L’’K])/s[L(K)]](https://image.slidesharecdn.com/structure-250131233258-1efd9814/85/population-structure-software-detailed-analysis-method-19-320.jpg)