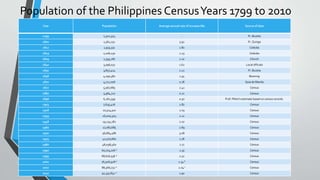
1. Population of the Philippines CensusYears 1799 to 2010
Year Population Average annual rate of increase (%) Source of data
1799 1,502,574 - Fr. Buzeta
1800 1,561,251 3.91 Fr. Zuniga
1812 1,933,331 1.80 Cedulas
1819 2,106,230 1.23 Cedulas
1829 2,593,287 2.10 Church
1840 3,096,031 1.62 Local officials
1850 3,857,424 2.22 Fr. Buzeta
1858 4,290,381 1.34 Bowring
1870 4,712,006 0.78 Guia de Manila
1877 5,567,685 2.41 Census
1887 5,984,727 0.72 Census
1896 6,261,339 0.50 Prof. Plehn's estimate based on census records.
1903 7,635,426 2.87 Census
1918 10,314,310 2.03 Census
1939 16,000,303 2.11 Census
1948 19,234,182 2.07 Census
1960 27,087,685 2.89 Census
1970 36,684,486 3.08 Census
1975 42,070,660 2.78 Census
1980 48,098,460 2.71 Census
1990 60,703,206 a 2.35 Census
1995 68,616,536 a 2.32 Census
2000 76,506,928 a 2.34 b Census
2007 88,566,732 a 2.04 c Census
2010 92,337,852 a 1.90 Census
2. Population: Average Annual Growth Rate (in Percent)
CensusYears 1990, 2000 and 2010
Area 1990-2000 2000-2010 1990-2010
Philippines 2.34 1.90 2.12
National Capital Region 2.25 1.78 2.02
Cordillera Administrative Region 1.76 1.70 1.73
Ilocos Region 1.69 1.23 1.46
CagayanValley 1.85 1.39 1.62
Central Luzon 2.61 2.14 2.37
IVA-Calabarzon 3.91 3.07 3.49
IVB- Mimaropa 2.62 1.79 2.20
Bicol Region 1.83 1.46 1.65
WesternVisayas 1.42 1.35 1.68
CentralVisayas 2.19 1.77 1.98
EasternVisayas 1.68 1.28 1.48
Zamboanga Peninzula 2.18 1.87 2.03
Northern Mindanao 2.23 2.06 2.14
Davao Region 2.28 1.97 2.12
SOCCSKSARGEN 2.99 2.46 2.72
Caraga 1.73 1.49 1.61
Autonomous Region in Muslim Mindanao 2.89 1.51 2.20
3. Population, by Region CensusYears 1980, 1990, 1995, 2000, 2007 and 2010
Area 2010 (Aug 1) 2007 (Aug 1) 2000 (May 1) 1995 (Sep 1) 1990 (May 1) 1980 (May 1)
Philippines 92,337,852 88,566,732 76,506,928a 68,616,536 60,703,206 48,098,460
National Capital Region 11,855,975 11,566,325 9,932,560 b 9,454,040 7,948,392 5,925,884
Cordillera Administrative
Region
1,616,867 1,520,847 1,365,220 1,254,838 1,146,191 914,432
Ilocos Region 4,748,372 4,546,789 4,200,478 3,803,890 3,550,642 2,922,892
Cagayan Valley 3,229,163 3,051,487 2,813,159 2,536,035 2,340,545 1,919,091
Central Luzon 10,137,737 9,709,177 8,204,742 7,092,191 6,338,590 4,909,938
IVA- Calabarzon 12,609,803 11,757,755 9,320,629 7,750,204 6,349,452 4,603,435
IVB- Mimaropa 2,744,671 2,559,791 2,299,229 2,033,271 1,774,074 1,408,040
Bicol Region 5,420,411 5,106,160 4,674,855 4,325,307 3,910,001 3,476,982
Western Visayas 7,102,438 6,843,643 6,211,038 5,776,938 5,393,333 4,525,615
Central Visayas 6,800,180 6,400,698 5,706,953 5,014,588 4,740,318 3,886,097
Eastern Visayas 4,101,322 3,915,140 3,610,355 3,366,917 3,054,490 2,799,534
Zamboanga Peninzula 3,407,353 3,230,094 2,831,412 2,567,651 2,221,382 1,771,860
Northern Mindanao 4,297,323 3,952,437 3,505,708 3,197,059 2,811,646 2,226,169
Davao Region 4,468,563 4,159,469 3,676,163 3,288,824 2,933,743 2,198,683
SOCCSKSARGEN 4,109,571 3,830,500 3,222,169 2,846,966 2,399,953 1,722,727
Caraga 2,429,224 2,293,346 2,095,367 1,942,687 1,764,297 1,371,512
Autonomous Region in Muslim
Mindanao
3,256,140 4,120,795 2,803,045 2,362,300 2,075,238 1,560,480
Filipinos in Philippine
Embassies/Consulates and
Missions Abroad
2,739 2,279 2,851 2,830 2,336 -
4. Population by Age Group, by Sex and by Region: 2010
Age Group Both Sexes Male Female
Philippines 92,097,978 46,459,318 45,638,660
Under 5 10,231,648 5,291,880 4,939,768
5-9 10,317,657 5,329,978 4,987,679
10-14 10,168,219 5,230,893 4,937,326
15-19 9,676,359 4,914,379 4,761,980
20-24 8,370,398 4,229,958 4,140,440
25-29 7,390,062 3,719,437 3,670,625
30-34 6,744,028 3,419,039 3,324,989
35-39 5,990,108 3,037,467 2,952,641
40-44 5,450,679 2,761,377 2,689,302
45-49 4,664,537 2,354,757 2,309,780
50-54 3,883,630 1,945,258 1,938,372
55-59 2,980,350 1,470,861 1,509,489
60-64 2,224,105 1,061,324 1,162,781
65-69 1,495,115 678,782 816,333
70-74 1,140,951 491,491 649,460
75-79 705,977 285,693 420,284
80-84 393,387 145,686 247,701
85 and over 270,768 91,058 179,710
5. Summary of Projected Population
by Sex, by Five-Year Interval: Philippines: 2000-2040
Year Both Sexes Male Female
2000 76,946,500 38,748,500 38,198,000
2005 85,261,000 42,887,300 42,373,700
2010 94,013,200 47,263,600 46,749,600
2015 102,965,300 51,733,400 51,231,900
2020 111,784,600 56,123,600 55,661,000
2025 120,224,500 60,311,700 59,912,800
2030 128,110,000 64,203,600 63,906,400
2035 135,301,100 67,741,300 67,559,800
2040 141,669,900 70,871,100 70,798,800