This document defines key concepts in demography and describes methods for studying population characteristics and changes over time. It discusses population estimation methods including census data collection and calculating intercensus population sizes. It also describes population pyramids and their characteristics for analyzing population composition. Finally, it defines different types of vital rates and health indicators used to describe and compare community health.
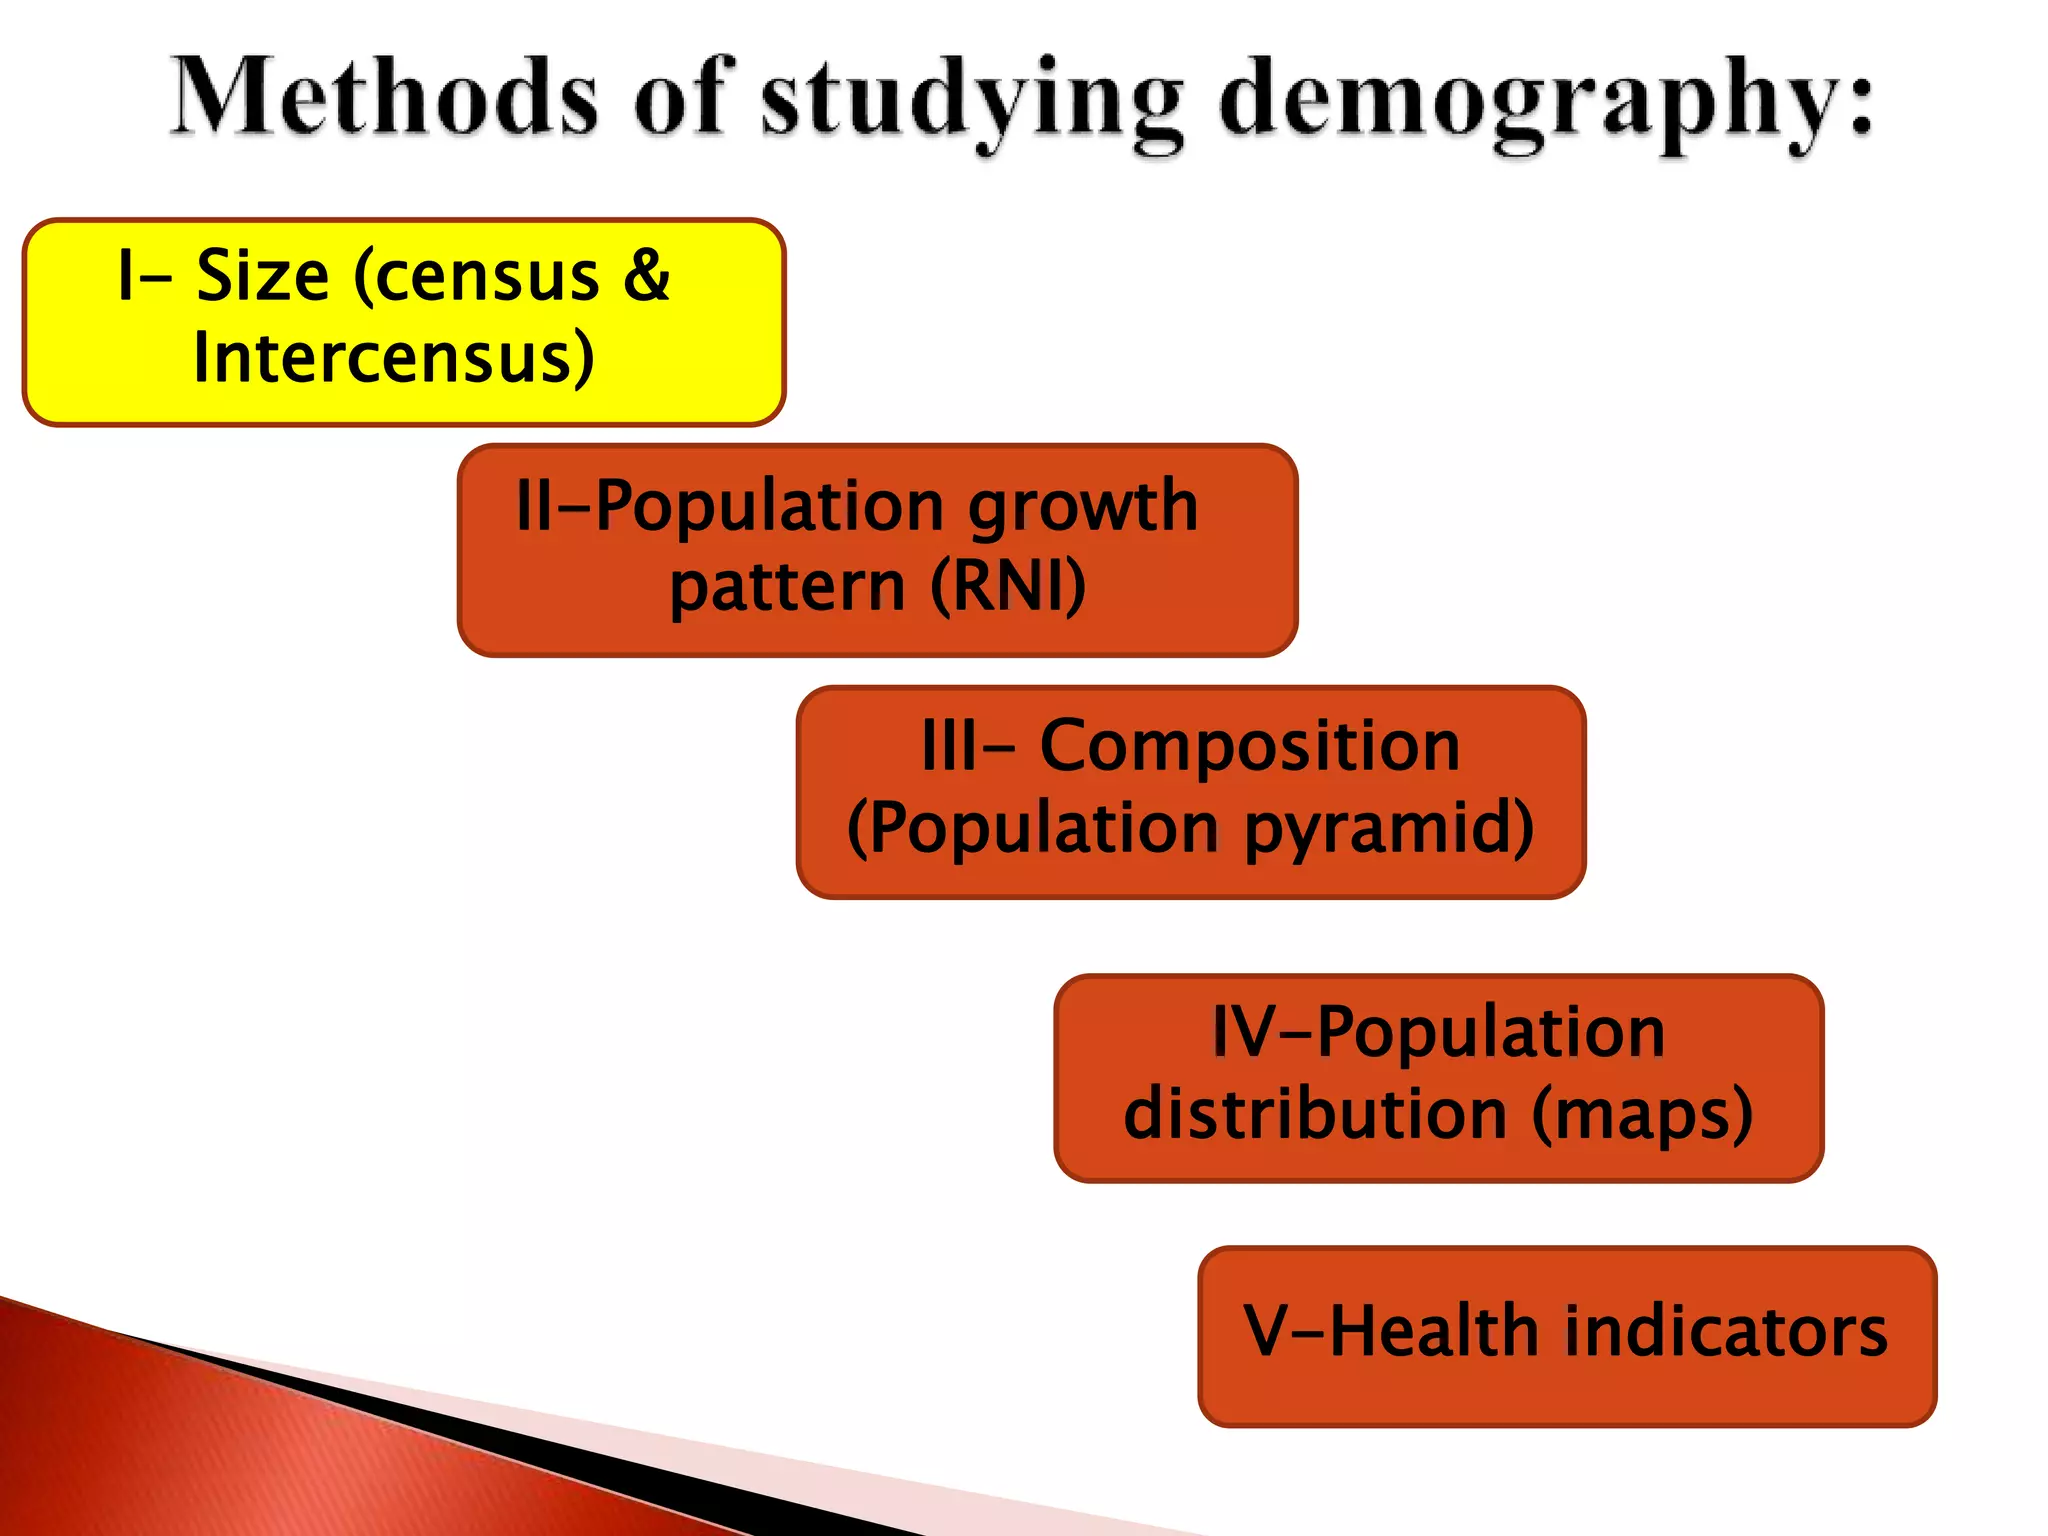
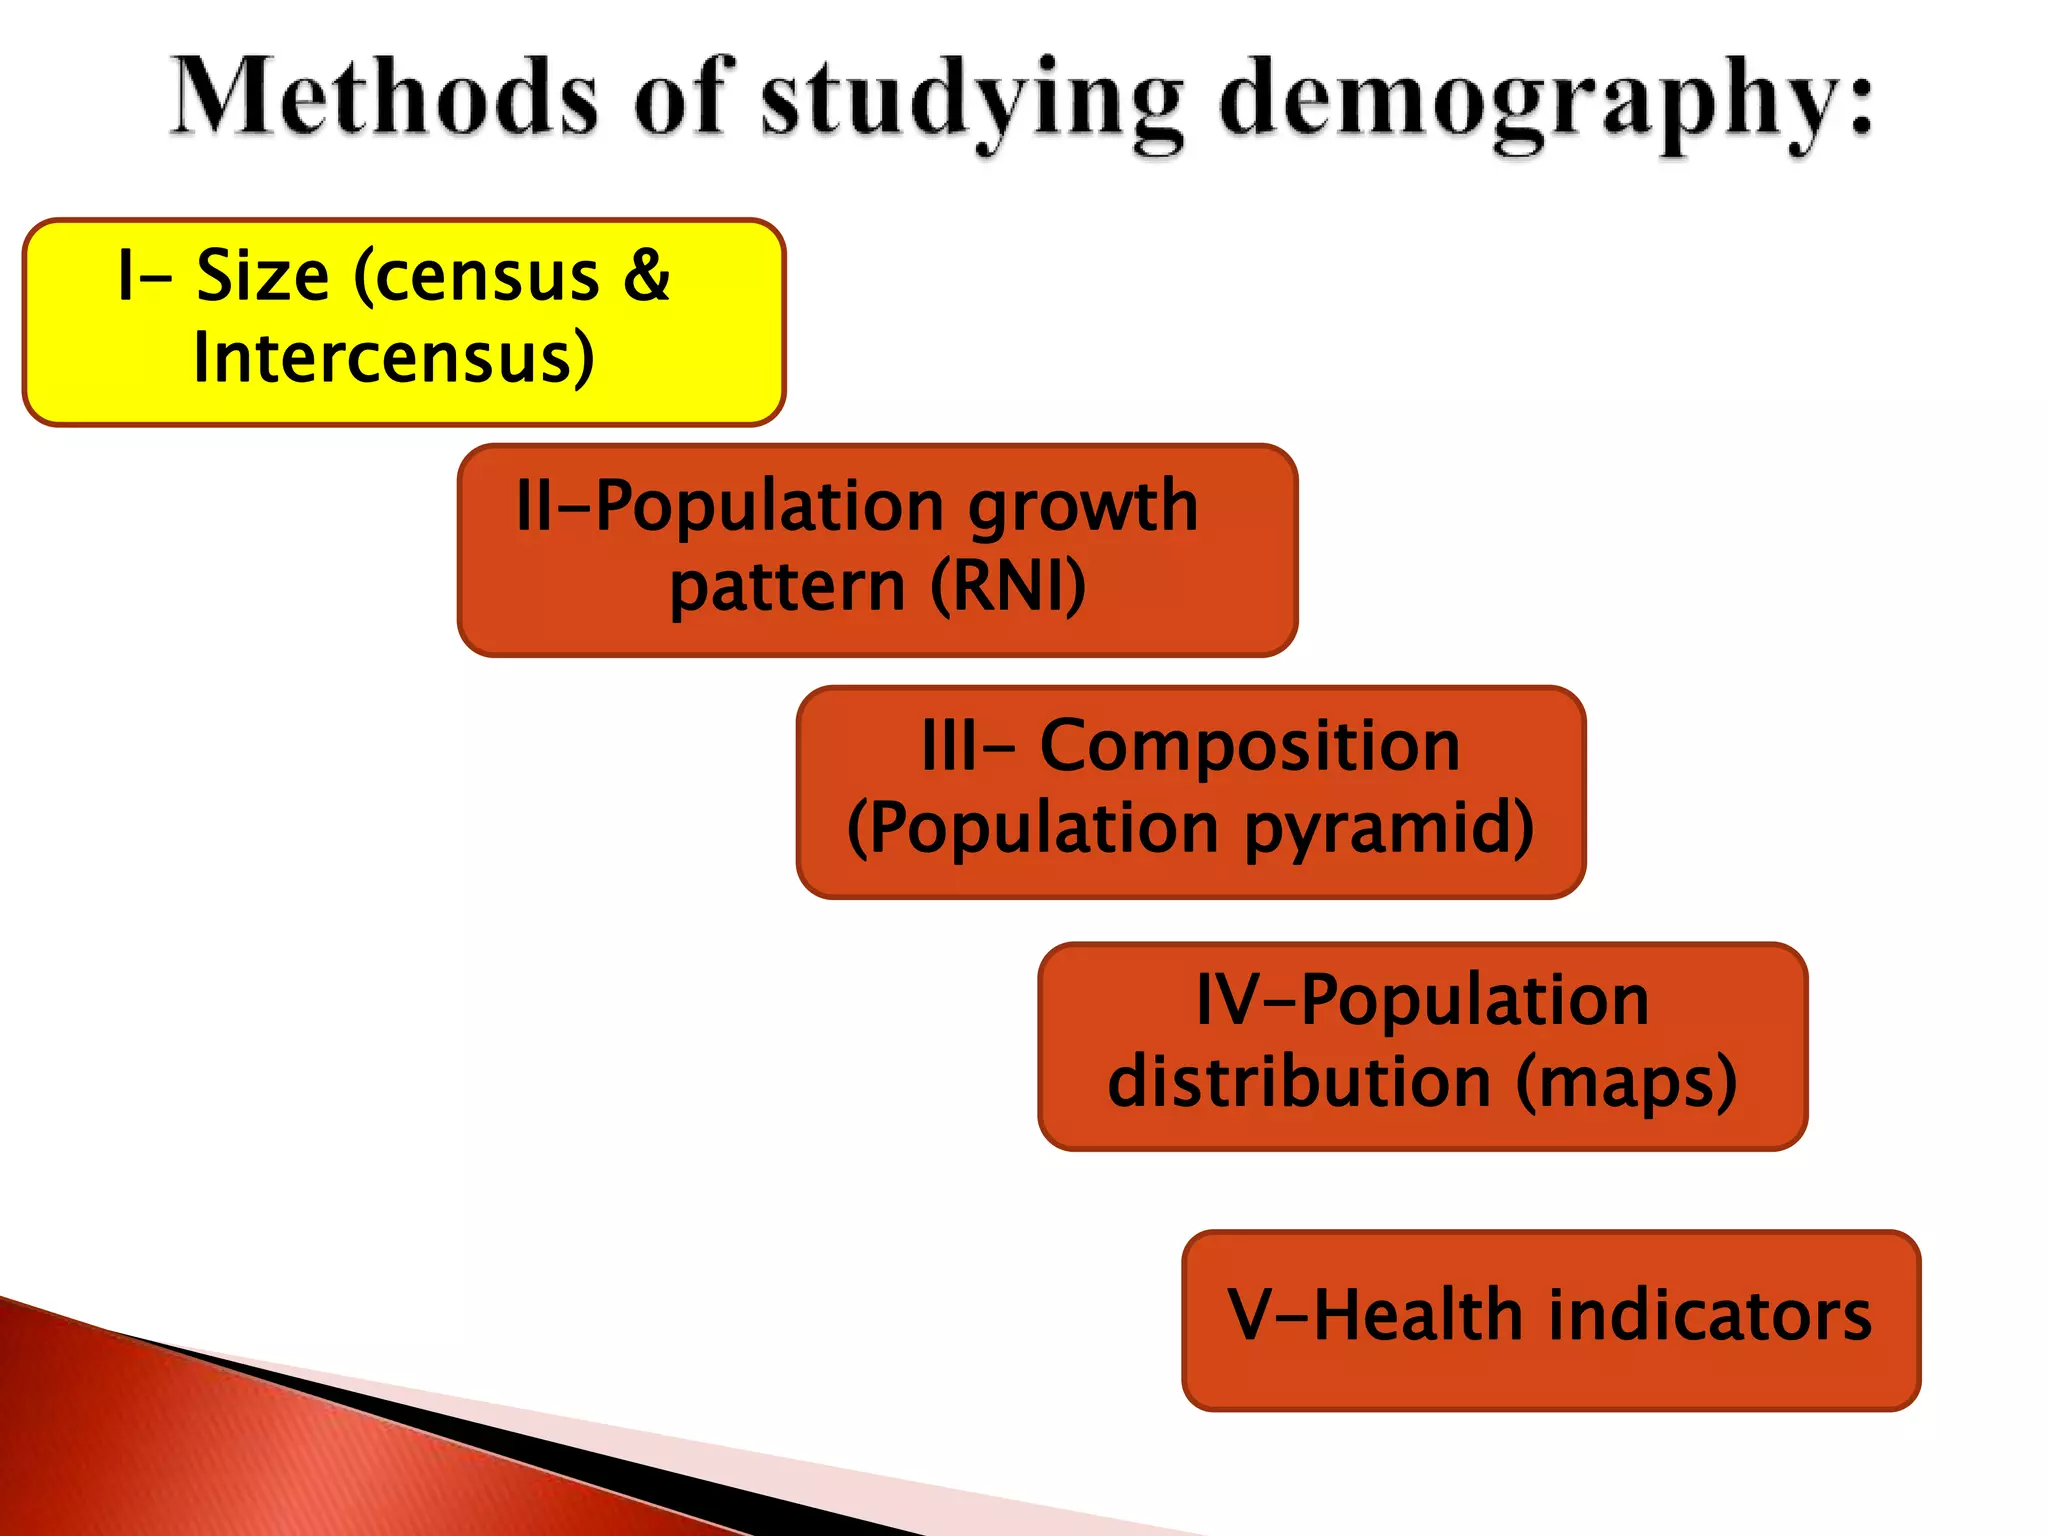
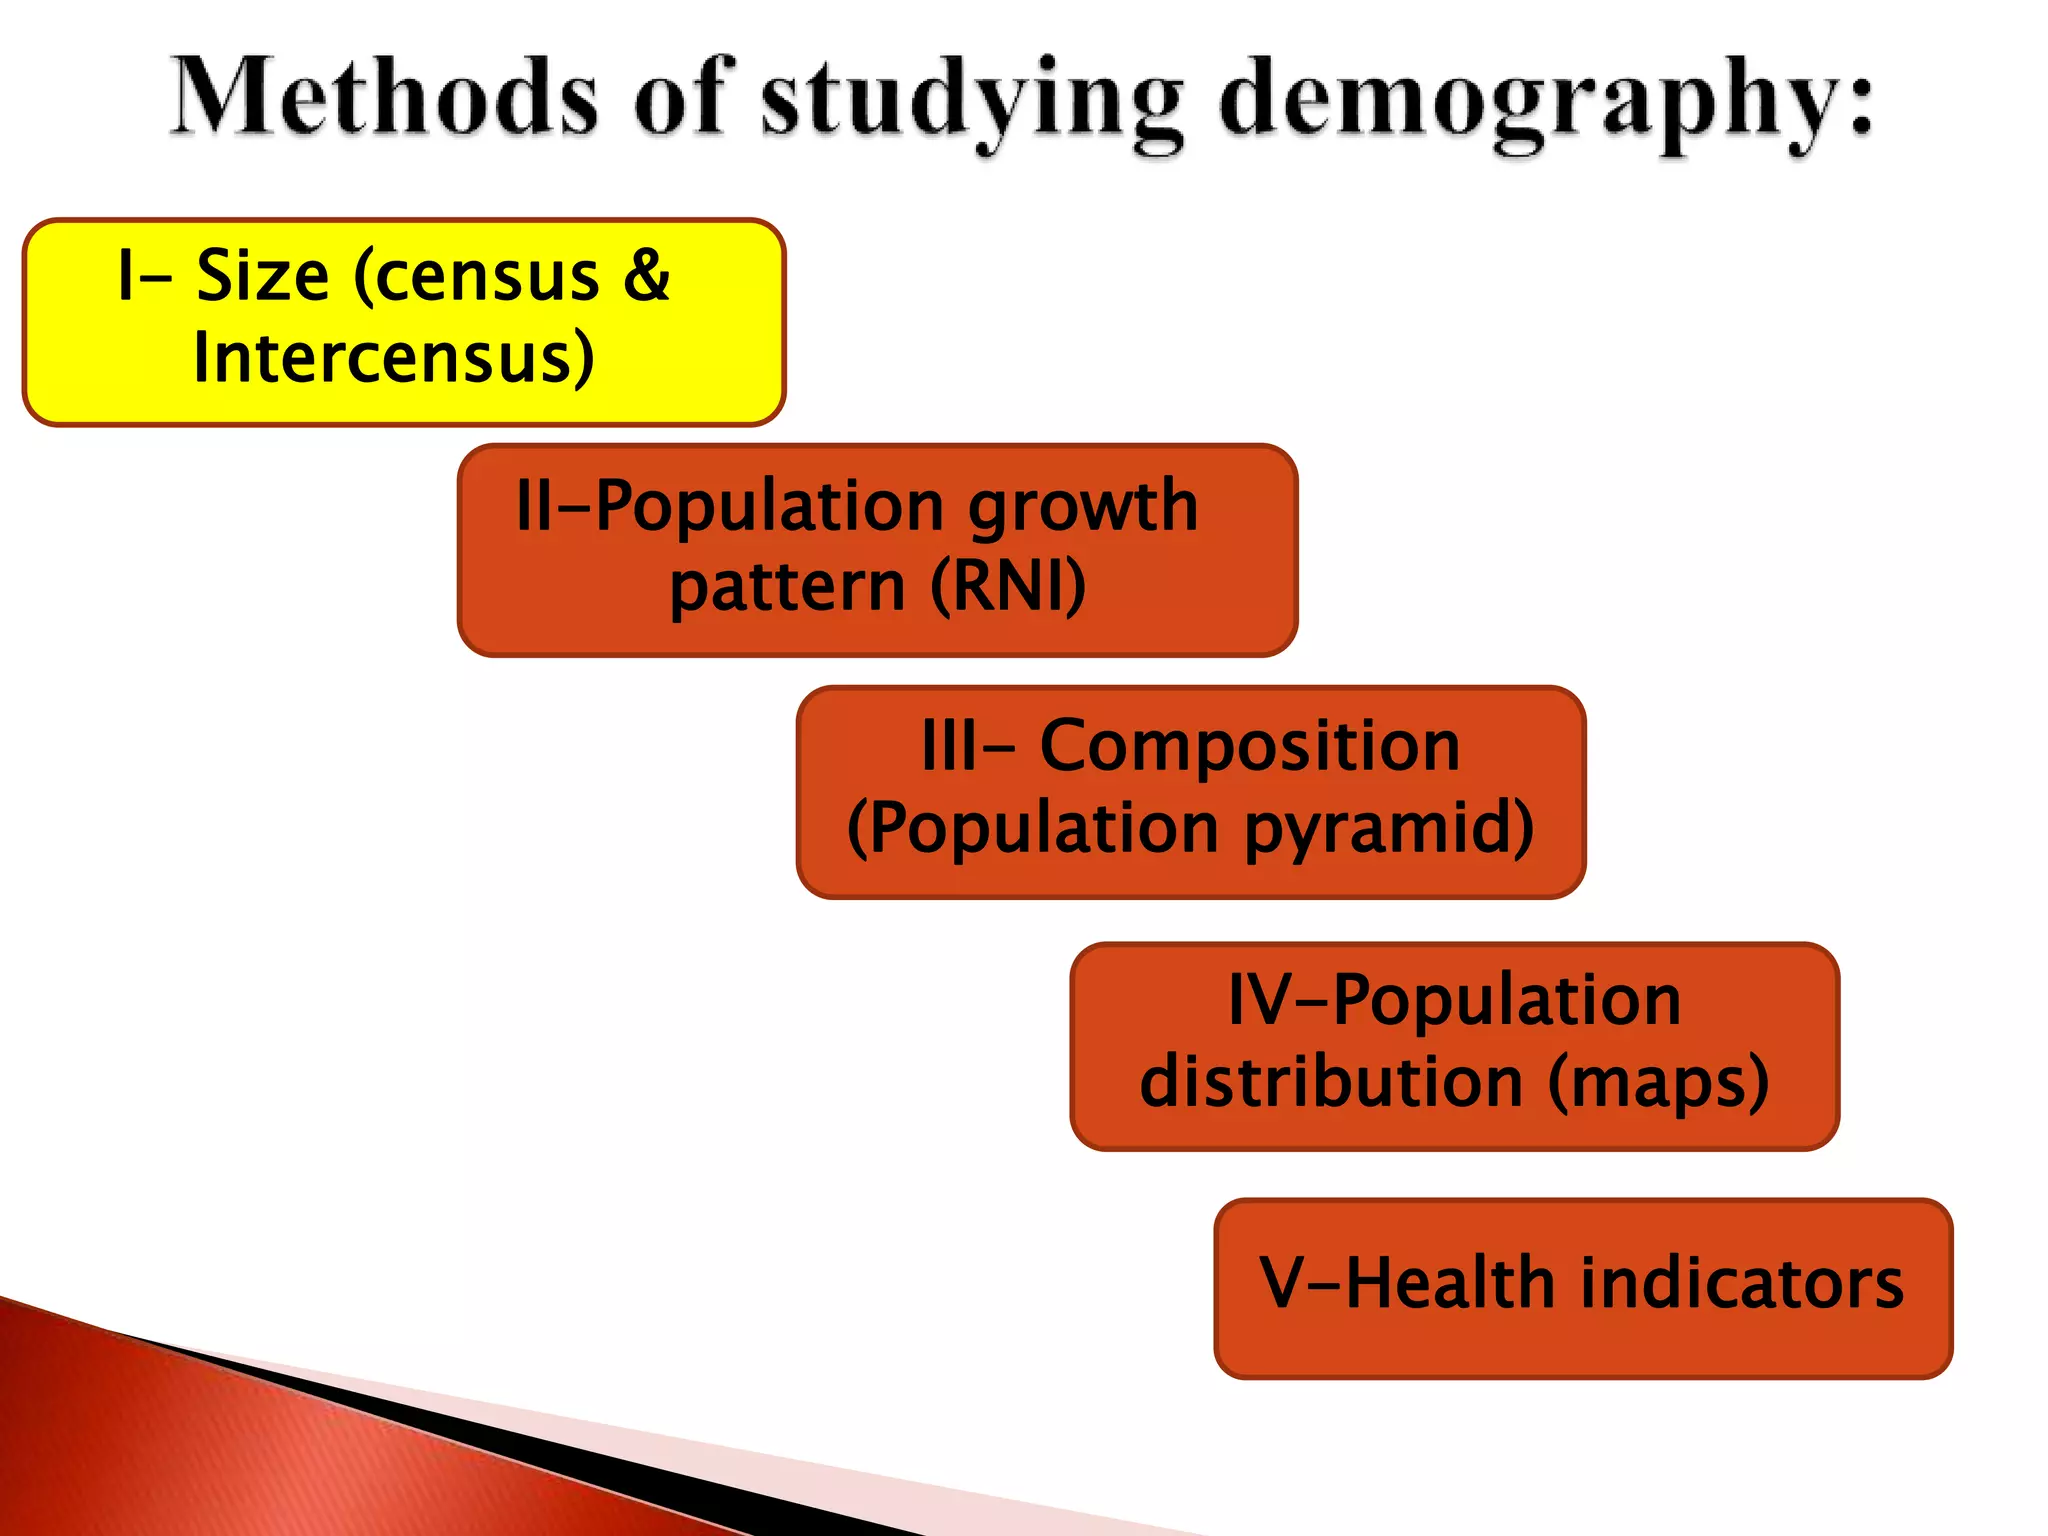
Data
Information
Intelligence
Health information system
Sources of data
Census
Registration of vital events
Sample registration system
Notification of diseases
Hospital records
Disease registers
Record linkage
Epidemiological surveillance
Other health service records
Environmental health data
Health manpower statistics
Population surveys
Other routine statics related to health
Non – quantifiable information
Health management information system
Central Bureau of health Ingelligence
National health profile
WHO Reports
Global Health Observatory
World bank
Health stats
Community medicine let's think beyond diseaseDr.Jatin Chhaya
Introduction - Community Medicine
Concept of Hygeine, Public health, Preventive & Social Medicine and Community diagnosis..
Difference between Clinician and Epidemiologist..
This document discusses primary health care, beginning with an introduction and overview of health care levels. It then covers the evolution of primary health care including the Alma-Ata Declaration, attributes, components, and principles of primary health care. The principles discussed in detail are equitable distribution, community participation, and intersectoral coordination. Examples from India are provided to illustrate community health workers and mechanisms for coordination between sectors. Challenges to intersectoral coordination are also outlined.
The document discusses several key concepts in demography and health, including:
1) It introduces population dynamics and the three factors that determine population change: births, deaths, and migration.
2) It discusses measures of fertility such as the crude birth rate, general fertility rate, and total fertility rate, and explains how to calculate these rates.
3) It introduces several measures of mortality like the crude death rate, infant mortality rate, and maternal mortality ratio, and provides examples of rates in different countries.
Standardization of rates by Dr. Basil TumainiBasil Tumaini
Standardization of rates by Dr. Basil Tumaini, presented during the residency at Muhimbili University of Health and Allied Sciences, Epidemiology class
Demography is the scientific study of human populations, including size, composition, distribution, and changes over time. Key aspects studied include fertility rates, mortality rates, migration patterns, population size and distribution, and how these influence and are influenced by socioeconomic factors. Population pyramids and dependency ratios are important demographic indicators used to analyze population age structures and support planning. Census data provides information on population numbers, characteristics, and trends over time that is vital for governments, businesses, and academics.
This document discusses definitions and concepts in epidemiology. It provides historical definitions of epidemiology from various scholars and outlines key aspects including disease frequency, distribution, and determinants. Descriptive epidemiology is introduced as the initial phase of epidemiological investigation that describes disease occurrence in terms of time, place, and person. Key measures like incidence, prevalence, rates, and ratios are also defined.
The document discusses the role of social and behavioral sciences in public health. It begins by defining key terms like psychology, sociology, anthropology, and explaining how they relate to public health. Next, it provides examples of how each discipline studies and addresses factors like social inequalities, environmental impacts, and health behaviors. It emphasizes that social and behavioral sciences help public health by identifying social determinants of health and designing interventions. Finally, the document lists some career paths where knowledge of these sciences can be applied, such as health education, counseling, and social work.
The Sample Registration System (SRS) was initiated in India in 1964-1965 to provide reliable demographic data for planning purposes, as birth and death registration was previously voluntary and incomplete. The SRS provides annual estimates of population composition, fertility, mortality, and medical attention at birth/death for India and major states. It covers about 8.1 million people based on a system of dual recording of births and deaths in representative sample units. Key estimates include population by age/sex, fertility rates, mortality rates, and maternal mortality. The SRS is implemented by the Office of the Registrar General and involves state census offices and part-time enumerators.
This document provides an overview of modern epidemiology. It defines epidemiology as the study of the occurrence and distribution of health-related diseases or events in populations, including their determinants and control. The purposes of epidemiology are described as investigating disease extent and priorities, studying disease progression, identifying causes and risks, recommending interventions, and informing public policy. John Snow is highlighted for his work tracing a cholera outbreak that improved public health systems.
The document outlines the Global Burden of Diseases, Injuries, and Risk Factors Study. It describes the study's goal of producing new estimates of disease burden. It details the organizational structure, including expert groups organized into clusters. Mortality is estimated through various data sources using Gaussian Process Regression to synthesize estimates. Causes of death are analyzed using over 5,000 country-years of data from various sources, which are cleaned and mapped to different classification lists.
The document discusses various indicators used to measure health status and the progress of health programs. It defines health indicators as variables that can directly measure the health of a community. It classifies indicators into categories like mortality, morbidity, disability rates, and nutritional status. Examples are provided like infant mortality rate, life expectancy, and anthropometric measurements in children. Characteristics of good indicators and methods to measure health policy outcomes, quality of life, and socioeconomic factors are also summarized.
This document provides an overview of epidemiology and public policy. It discusses how public policy provides the baseline structure for major sectors including health. Public policy directly influences the environment and living patterns. Epidemiological research influences public policy making but evidence is often incomplete. Health care planning involves setting objectives and choosing means to achieve them. The planning cycle assesses disease burden, identifies causes, measures intervention effectiveness and efficiency, implements interventions, and monitors programs. Some key Indian health policies and programs discussed include those targeting malaria, filariasis, leprosy, tuberculosis, blindness, and diarrheal diseases.
The World Health Organization STEPwise Approach to Noncommunicable Disease Ri...Sumaiya Akter Snigdha
The World Health Organization STEPwise Approach to Noncommunicable Disease Risk-Factor Surveillance provides a standardized method for collecting and analyzing risk factor surveillance data across countries. It uses repeated cross-sectional household surveys with standardized questions and protocols to monitor risk factors like blood pressure, blood glucose, and tobacco use. While it helps build capacity for risk factor surveillance, challenges include lack of priority and resources for ongoing surveillance in many countries.
This document provides an overview of epidemiology. It begins by defining epidemiology as the study of how diseases are distributed and spread in populations. It then discusses the history of epidemiology, highlighting figures like Hippocrates and John Snow. The document outlines the scope, aims, approaches and methods of epidemiology. It describes observational methods like descriptive studies and analytical studies including case-control and cohort designs. It also discusses experimental methods like randomized controlled trials. In summary, the document provides a high-level introduction to the key concepts, techniques and historical development of epidemiology as a scientific field of study.
Civil registration and vital statistics in indiaTR Dilip
Civil registration systems record vital events like births, deaths, marriages and divorces. They provide legal documents to establish identity and rights. India's system is governed by the Registration of Births and Deaths Act 1969. It aims to register all births and deaths but still faces challenges like late registration and underreporting. Data from the civil registration system is published annually and provides vital statistics on births, deaths and causes of death. However, some states still have incomplete registration. Global efforts aim to achieve universal birth registration by 2030 as part of the sustainable development goals.
National framework for malaria elimination in indiaAparna Chaudhary
outlines India’s strategy for elimination of the disease by 2030. The framework has been developed with a vision to eliminate malaria from the country and contribute to improved health and quality of life and alleviation of poverty.
Community diagnosis involves identifying and quantifying health problems in a community through data collection and analysis. It aims to understand factors influencing community health, highlight available resources, and identify local health priorities to improve health status. The process involves initiating a project, collecting both quantitative and qualitative data, diagnosing the community's health status and determinants, and disseminating findings to stakeholders and the public. Challenges can include communities prioritizing other issues over real health problems and rushing conclusions without proper understanding. Regular assessment allows health programs to continuously adapt to community needs.
1. The document discusses the origins and history of primary health care from pre-colonial times through the colonial period and post-independence era, culminating in the 1978 Declaration of Alma-Ata which established primary health care as a global strategy.
2. The Declaration defined primary health care as including health promotion, disease prevention, treatment of common illnesses, and community participation at an affordable cost.
3. While the goals of primary health care were not fully realized due to lack of resources and commitment, the principles of equity, prevention and universal access remain important, and revitalizing primary health care is seen as critical to achieving health-related sustainable development goals.
Although there is very less material in web ,I try to make the topic lucid . I also stuck in sampling part but i feel it helpful for readers .
Commends are welcome
Demography and family planning lecture of Commmunity Medicine and or Preventive Medicine lecture by Dr. Farhana Yasmin,MBBS;MPH;Phd Fellow of Rajshahi University .
Demography is the statistical study of human populations, including their size, structure, and changes. It analyzes populations through factors like births, deaths, and migration. Key demographic indicators measure mortality rates like crude death rate and infant mortality rate, as well as fertility rates like crude birth rate, total fertility rate, and reproductive rates. Demography also examines population size, distribution, structure, and changes over time.
Social medicine is the study of how social factors influence health and disease. It examines man as a social being within his total environment. Social medicine uses tools from both medicine and sociology, with the community serving as the laboratory. Some key aspects of social medicine include social anatomy, social physiology, social pathology, social pediatrics, and social therapy. Social therapy focuses on social and political actions to improve living conditions and promote health rather than solely using medical treatments.
This document discusses the triple burden of disease faced by many developing countries. It describes the triple burden as the coexistence of infectious diseases, undernutrition, and emerging non-communicable diseases. Many countries now struggle with this combination of communicable diseases, malnutrition, and non-communicable diseases like heart disease and diabetes. Addressing this triple burden presents challenges for healthcare systems in developing nations. Risk factors like poverty, malnutrition, urbanization and changing lifestyles have contributed to the rise of non-communicable diseases.
Epidemiology is the study of the distribution and determinants of health-related states or events in specified populations, and the application of this study to the control of health problems. There are several key methods used in epidemiology including observational studies like cross-sectional studies, case-control studies, and cohort studies which examine disease occurrence without intervention. Experimental studies like randomized controlled trials can also be used to study the effects of interventions on disease.
This document defines key demographic terms and describes methods for studying population characteristics. It discusses population estimation using census data and inter-census methods. Different population growth patterns are classified based on birth and death rates. The population pyramid is described as a way to visualize population by age and sex, and examples from Egypt in 1950, 2000, and a projection for 2050 are provided. Finally, common health indicators used for evaluation like birth rate are defined.
Demography and fertility related statistics 2AbhishekDas15
The document discusses various sources of demographic data and methods for population projection. It describes four main sources of demographic data: censuses, vital registration systems, surveys, and sample registration systems. It then outlines four common mathematical methods for population projection: arithmetic growth, geometric growth, exponential growth, and component projection.
Business Demography is a very important subject for business.pakap3769
This document provides an introduction to demography, including definitions, the nature and scope of demography, and sources of demographic study. Demography is defined as the scientific study of human populations, including their size, distribution, and composition. The nature of demography involves analyzing factors like population density, sex and age composition, and rural-urban distribution. Demographic data is important for political, administrative, social, economic and business purposes, such as planning health services, employment, housing and more. Sources of demographic study include population censuses, sample surveys, vital registration, and population registration.
Demography and family welfare, VI unit in community health nursingssuser82e099
Demography is the statistical study of human populations, specifically concerning size, structure, and distribution, as well as changes resulting from birth, death, migration, and aging. The key demographic processes that affect population change are fertility, mortality, marriage, migration, and social mobility. A population's size, composition, and distribution can be measured using tools like crude birth/death rates, life expectancy, sex ratio, and population density. Demographic changes over time occur in stages defined by the demographic transition theory.
Studying population is important for governments to understand demographic trends and plan for services. Population geography uses demography to analyze population characteristics like size, density, and growth. Demography provides key data through tools like censuses, civil registries, and municipal registers. A population's structure includes its biological makeup by age and sex, as well as its economic characteristics. Natural increases from births and deaths, as well as migratory flows, influence a population's total growth rate.
This document discusses population geography and demography. It begins by explaining that population geography studies the distribution and characteristics of human populations. It then discusses reasons for studying population, such as taxation and military recruitment. A key part of population geography is demography, which uses statistical analysis to study characteristics like age, sex, births and deaths. Developed countries often use censuses to collect demographic data, while less developed countries rely more on estimates. The document then examines population structure, analyzing factors like age structure via population pyramids. It also considers economic structure, dividing populations into categories like employed and unemployed. Finally, it analyzes population change through natural increases/decreases and migratory movements.
Demography is the statistical study of human populations. It covers the size, distribution, and vital statistics of populations over time. Demographers analyze factors that influence population change such as births, deaths, and migration. They focus on specific indicators like fertility rates, mortality rates, and migration trends. Demographic data comes from sources like censuses, vital registration systems, and sample surveys. Rates, ratios, proportions, and percentages are used to express demographic characteristics and compare subgroups to the total population.
This document discusses why population studies are important and provides details on key concepts in population geography and demography. It notes that ancient societies studied populations to determine taxes and recruit soldiers, while modern states do so for purposes like pensions and education planning. Population geography analyzes population evolution, composition and spatial distribution using demography, which statistically studies populations in terms of size, density, vital statistics and more. Developed countries use censuses while poorer estimates rely on government and UN estimates. Spain collects data through censuses, civil registries, and municipal registers. Population is studied statically by characteristics and dynamically by natural and migratory movements. Biological structure looks at age and sex distributions via population pyramids, while economic structure considers
The document discusses why studying population is important, including for tax collection, military recruitment, and government planning. It also examines population geography and demography, the tools used to study and analyze population characteristics like size, density, growth, and distribution. Demographic sources like censuses and civil registries provide data to determine population figures and characteristics in developed and developing nations.
This document discusses population geography and demography. It begins by explaining that population geography studies the distribution and characteristics of human populations. It then discusses reasons for studying population, such as taxation and military recruitment. A key part of population geography is demography, which uses statistical analysis to study characteristics like age, sex, births and deaths. Developed countries often use censuses to gather demographic data, while less developed countries rely more on estimates. The document then examines population structure, using concepts like biological structure (analyzed using population pyramids) and economic structure. It also discusses natural population changes like birth and death rates, as well as migratory movements and their impact on actual population change.
This document provides information about demography and population trends through history and around the world. It discusses world population growth over time, showing that it took longer to add each subsequent billion people. It also shows population growth patterns between more developed and less developed regions. Other topics summarized include the demographic transition model, which predicts changes in birth and death rates as countries develop, population pyramids and what they indicate about a population, and factors that influence population growth and distribution.
Population geography studies populations and demography, which statistically analyzes population characteristics. Governments monitor population sizes for tax and military recruitment purposes. Modern states also consider education and healthcare needs. Developed countries use censuses while poorer estimates rely on estimates. Spain's census, civil registry, and municipal registers provide demographic data. Population structure examines age, sex, and economic factors. Biological structure uses population pyramids to show age and sex distributions. Economic structure considers active, employed, unemployed and inactive groups. Natural changes comprise birth and death rates while migration involves immigration and emigration. Rates reveal population trends and projections.
This document provides an overview of population studies, including definitions of key demographic terms and theories of population. It outlines 14 key concepts in demography, such as crude birth rate, fertility, life expectancy, and net migration. The document also summarizes several major population theories, like Malthusian, Neo-Malthusian, and Demographic Transition theories. Finally, it lists research activities and recommended readings for further lessons.
This document provides an overview of demography and population studies. It defines demography as the statistical study of human populations, examining their size, structure and changes over time and space. Key points include:
- Demography analyzes population dynamics like birth, death, and migration and their influence on society. It uses data from government censuses and registrations.
- A nation typically progresses through five stages of a demographic cycle from high stationary population to declining population.
- India has over 1.3 billion residents and is projected to surpass China as the world's most populous country by 2027. The UN expects the global population to increase by 2 billion by 2050.
- Demography
The document discusses key concepts related to human population including population, demography, population growth, and population dynamics. It defines population as a group of the same species living in an area. Demography is defined as the study of human population dynamics, encompassing the size, structure and distribution of populations. The document outlines the demographic transition model showing how populations transition from high birth/death rates to low birth/death rates as countries develop. It also discusses population pyramids and how their shapes reflect different growth stages.
The document discusses key concepts related to human population including population, demography, population growth, and population dynamics. It defines population as a group of the same species living in an area. Demography is defined as the study of human population dynamics, encompassing the size, structure and distribution of populations. The document outlines the demographic transition model showing how populations transition from high birth/death rates to low birth/death rates as countries develop. It also discusses population pyramids and how their shapes reflect different stages of the demographic transition.
The document discusses population growth and structure. It begins by outlining factors that affect population distribution and density, such as physical, social, economic and political influences. It then describes population concepts like birth rate, death rate, natural increase/decrease, and density. Models of population change are presented, including the demographic transition model and population pyramids. Population pyramids illustrate age and sex structures and can indicate development levels. Overpopulation causes and problems are also summarized.
World population dynamics can be understood by examining population distribution and growth rates over time. Population distribution is influenced by environmental factors and level of development. Places with large populations usually have favorable environments and are more developed, while places with few people often have hostile environments. Population growth is the result of birth rates, death rates, and migration. In the last 200 years, global population has experienced an unprecedented expansion due to improvements in medicine, sanitation and technology that reduced death rates even as birth rates remained high.
This document discusses key concepts in demography and population statistics of Pakistan. It defines demography as the scientific study of human populations, focusing on birth rates, death rates, and migration. It then discusses Pakistan's current population size, growth rate, fertility rate, mortality rates, level of urbanization, and other population dynamics. The document also introduces concepts like population pyramids, the demographic transition, and the importance of social mobilization for addressing issues related to population growth.
1. Population aging is occurring globally as the number and proportion of older persons (aged 65 and over) increases worldwide. The number of older persons is projected to double between 2019 and 2050 to 1.5 billion, representing 16% of the global population.
2. Population aging has been most rapid in Eastern/Southeastern Asia and Latin America/Caribbean, where the percentage of the population aged 65+ almost doubled between 1990 and 2019. Between 2019-2050, the share of older persons is projected to at least double in four regions.
3. Life expectancy at age 65 is increasing nearly everywhere. Globally, a person aged 65 in 2015-2020 could expect to live an additional 17
TEST BANK For An Introduction to Brain and Behavior, 7th Edition by Bryan Kol...rightmanforbloodline
TEST BANK For An Introduction to Brain and Behavior, 7th Edition by Bryan Kolb, Ian Q. Whishaw, Verified Chapters 1 - 16, Complete Newest Versio
TEST BANK For An Introduction to Brain and Behavior, 7th Edition by Bryan Kolb, Ian Q. Whishaw, Verified Chapters 1 - 16, Complete Newest Version
8 Surprising Reasons To Meditate 40 Minutes A Day That Can Change Your Life.pptxHolistified Wellness
We’re talking about Vedic Meditation, a form of meditation that has been around for at least 5,000 years. Back then, the people who lived in the Indus Valley, now known as India and Pakistan, practised meditation as a fundamental part of daily life. This knowledge that has given us yoga and Ayurveda, was known as Veda, hence the name Vedic. And though there are some written records, the practice has been passed down verbally from generation to generation.
Rasamanikya is a excellent preparation in the field of Rasashastra, it is used in various Kushtha Roga, Shwasa, Vicharchika, Bhagandara, Vatarakta, and Phiranga Roga. In this article Preparation& Comparative analytical profile for both Formulationon i.e Rasamanikya prepared by Kushmanda swarasa & Churnodhaka Shodita Haratala. The study aims to provide insights into the comparative efficacy and analytical aspects of these formulations for enhanced therapeutic outcomes.
Local Advanced Lung Cancer: Artificial Intelligence, Synergetics, Complex Sys...Oleg Kshivets
Overall life span (LS) was 1671.7±1721.6 days and cumulative 5YS reached 62.4%, 10 years – 50.4%, 20 years – 44.6%. 94 LCP lived more than 5 years without cancer (LS=2958.6±1723.6 days), 22 – more than 10 years (LS=5571±1841.8 days). 67 LCP died because of LC (LS=471.9±344 days). AT significantly improved 5YS (68% vs. 53.7%) (P=0.028 by log-rank test). Cox modeling displayed that 5YS of LCP significantly depended on: N0-N12, T3-4, blood cell circuit, cell ratio factors (ratio between cancer cells-CC and blood cells subpopulations), LC cell dynamics, recalcification time, heparin tolerance, prothrombin index, protein, AT, procedure type (P=0.000-0.031). Neural networks, genetic algorithm selection and bootstrap simulation revealed relationships between 5YS and N0-12 (rank=1), thrombocytes/CC (rank=2), segmented neutrophils/CC (3), eosinophils/CC (4), erythrocytes/CC (5), healthy cells/CC (6), lymphocytes/CC (7), stick neutrophils/CC (8), leucocytes/CC (9), monocytes/CC (10). Correct prediction of 5YS was 100% by neural networks computing (error=0.000; area under ROC curve=1.0).
- Video recording of this lecture in English language: https://youtu.be/kqbnxVAZs-0
- Video recording of this lecture in Arabic language: https://youtu.be/SINlygW1Mpc
- Link to download the book free: https://nephrotube.blogspot.com/p/nephrotube-nephrology-books.html
- Link to NephroTube website: www.NephroTube.com
- Link to NephroTube social media accounts: https://nephrotube.blogspot.com/p/join-nephrotube-on-social-media.html
TEST BANK For Basic and Clinical Pharmacology, 14th Edition by Bertram G. Kat...rightmanforbloodline
TEST BANK For Basic and Clinical Pharmacology, 14th Edition by Bertram G. Katzung, Verified Chapters 1 - 66, Complete Newest Version.
TEST BANK For Community Health Nursing A Canadian Perspective, 5th Edition by...Donc Test
TEST BANK For Community Health Nursing A Canadian Perspective, 5th Edition by Stamler, Verified Chapters 1 - 33, Complete Newest Version Community Health Nursing A Canadian Perspective, 5th Edition by Stamler, Verified Chapters 1 - 33, Complete Newest Version Community Health Nursing A Canadian Perspective, 5th Edition by Stamler Community Health Nursing A Canadian Perspective, 5th Edition TEST BANK by Stamler Test Bank For Community Health Nursing A Canadian Perspective, 5th Edition Pdf Chapters Download Test Bank For Community Health Nursing A Canadian Perspective, 5th Edition Pdf Download Stuvia Test Bank For Community Health Nursing A Canadian Perspective, 5th Edition Study Guide Test Bank For Community Health Nursing A Canadian Perspective, 5th Edition Ebook Download Stuvia Test Bank For Community Health Nursing A Canadian Perspective, 5th Edition Questions and Answers Quizlet Test Bank For Community Health Nursing A Canadian Perspective, 5th Edition Studocu Test Bank For Community Health Nursing A Canadian Perspective, 5th Edition Quizlet Test Bank For Community Health Nursing A Canadian Perspective, 5th Edition Stuvia Community Health Nursing A Canadian Perspective, 5th Edition Pdf Chapters Download Community Health Nursing A Canadian Perspective, 5th Edition Pdf Download Course Hero Community Health Nursing A Canadian Perspective, 5th Edition Answers Quizlet Community Health Nursing A Canadian Perspective, 5th Edition Ebook Download Course hero Community Health Nursing A Canadian Perspective, 5th Edition Questions and Answers Community Health Nursing A Canadian Perspective, 5th Edition Studocu Community Health Nursing A Canadian Perspective, 5th Edition Quizlet Community Health Nursing A Canadian Perspective, 5th Edition Stuvia Community Health Nursing A Canadian Perspective, 5th Edition Test Bank Pdf Chapters Download Community Health Nursing A Canadian Perspective, 5th Edition Test Bank Pdf Download Stuvia Community Health Nursing A Canadian Perspective, 5th Edition Test Bank Study Guide Questions and Answers Community Health Nursing A Canadian Perspective, 5th Edition Test Bank Ebook Download Stuvia Community Health Nursing A Canadian Perspective, 5th Edition Test Bank Questions Quizlet Community Health Nursing A Canadian Perspective, 5th Edition Test Bank Studocu Community Health Nursing A Canadian Perspective, 5th Edition Test Bank Quizlet Community Health Nursing A Canadian Perspective, 5th Edition Test Bank Stuvia
Adhd Medication Shortage Uk - trinexpharmacy.comreignlana06
The UK is currently facing a Adhd Medication Shortage Uk, which has left many patients and their families grappling with uncertainty and frustration. ADHD, or Attention Deficit Hyperactivity Disorder, is a chronic condition that requires consistent medication to manage effectively. This shortage has highlighted the critical role these medications play in the daily lives of those affected by ADHD. Contact : +1 (747) 209 – 3649 E-mail : sales@trinexpharmacy.com
Clinic ^%[+27633867063*Abortion Pills For Sale In Tembisa Central19various
Clinic ^%[+27633867063*Abortion Pills For Sale In Tembisa Central Clinic ^%[+27633867063*Abortion Pills For Sale In Tembisa CentralClinic ^%[+27633867063*Abortion Pills For Sale In Tembisa CentralClinic ^%[+27633867063*Abortion Pills For Sale In Tembisa CentralClinic ^%[+27633867063*Abortion Pills For Sale In Tembisa Central
Top 10 Best Ayurvedic Kidney Stone Syrups in India
demography
1.
2. Define demography and recognize its importance
and methods of study.
Describe population estimations in the census and
inter-census years.
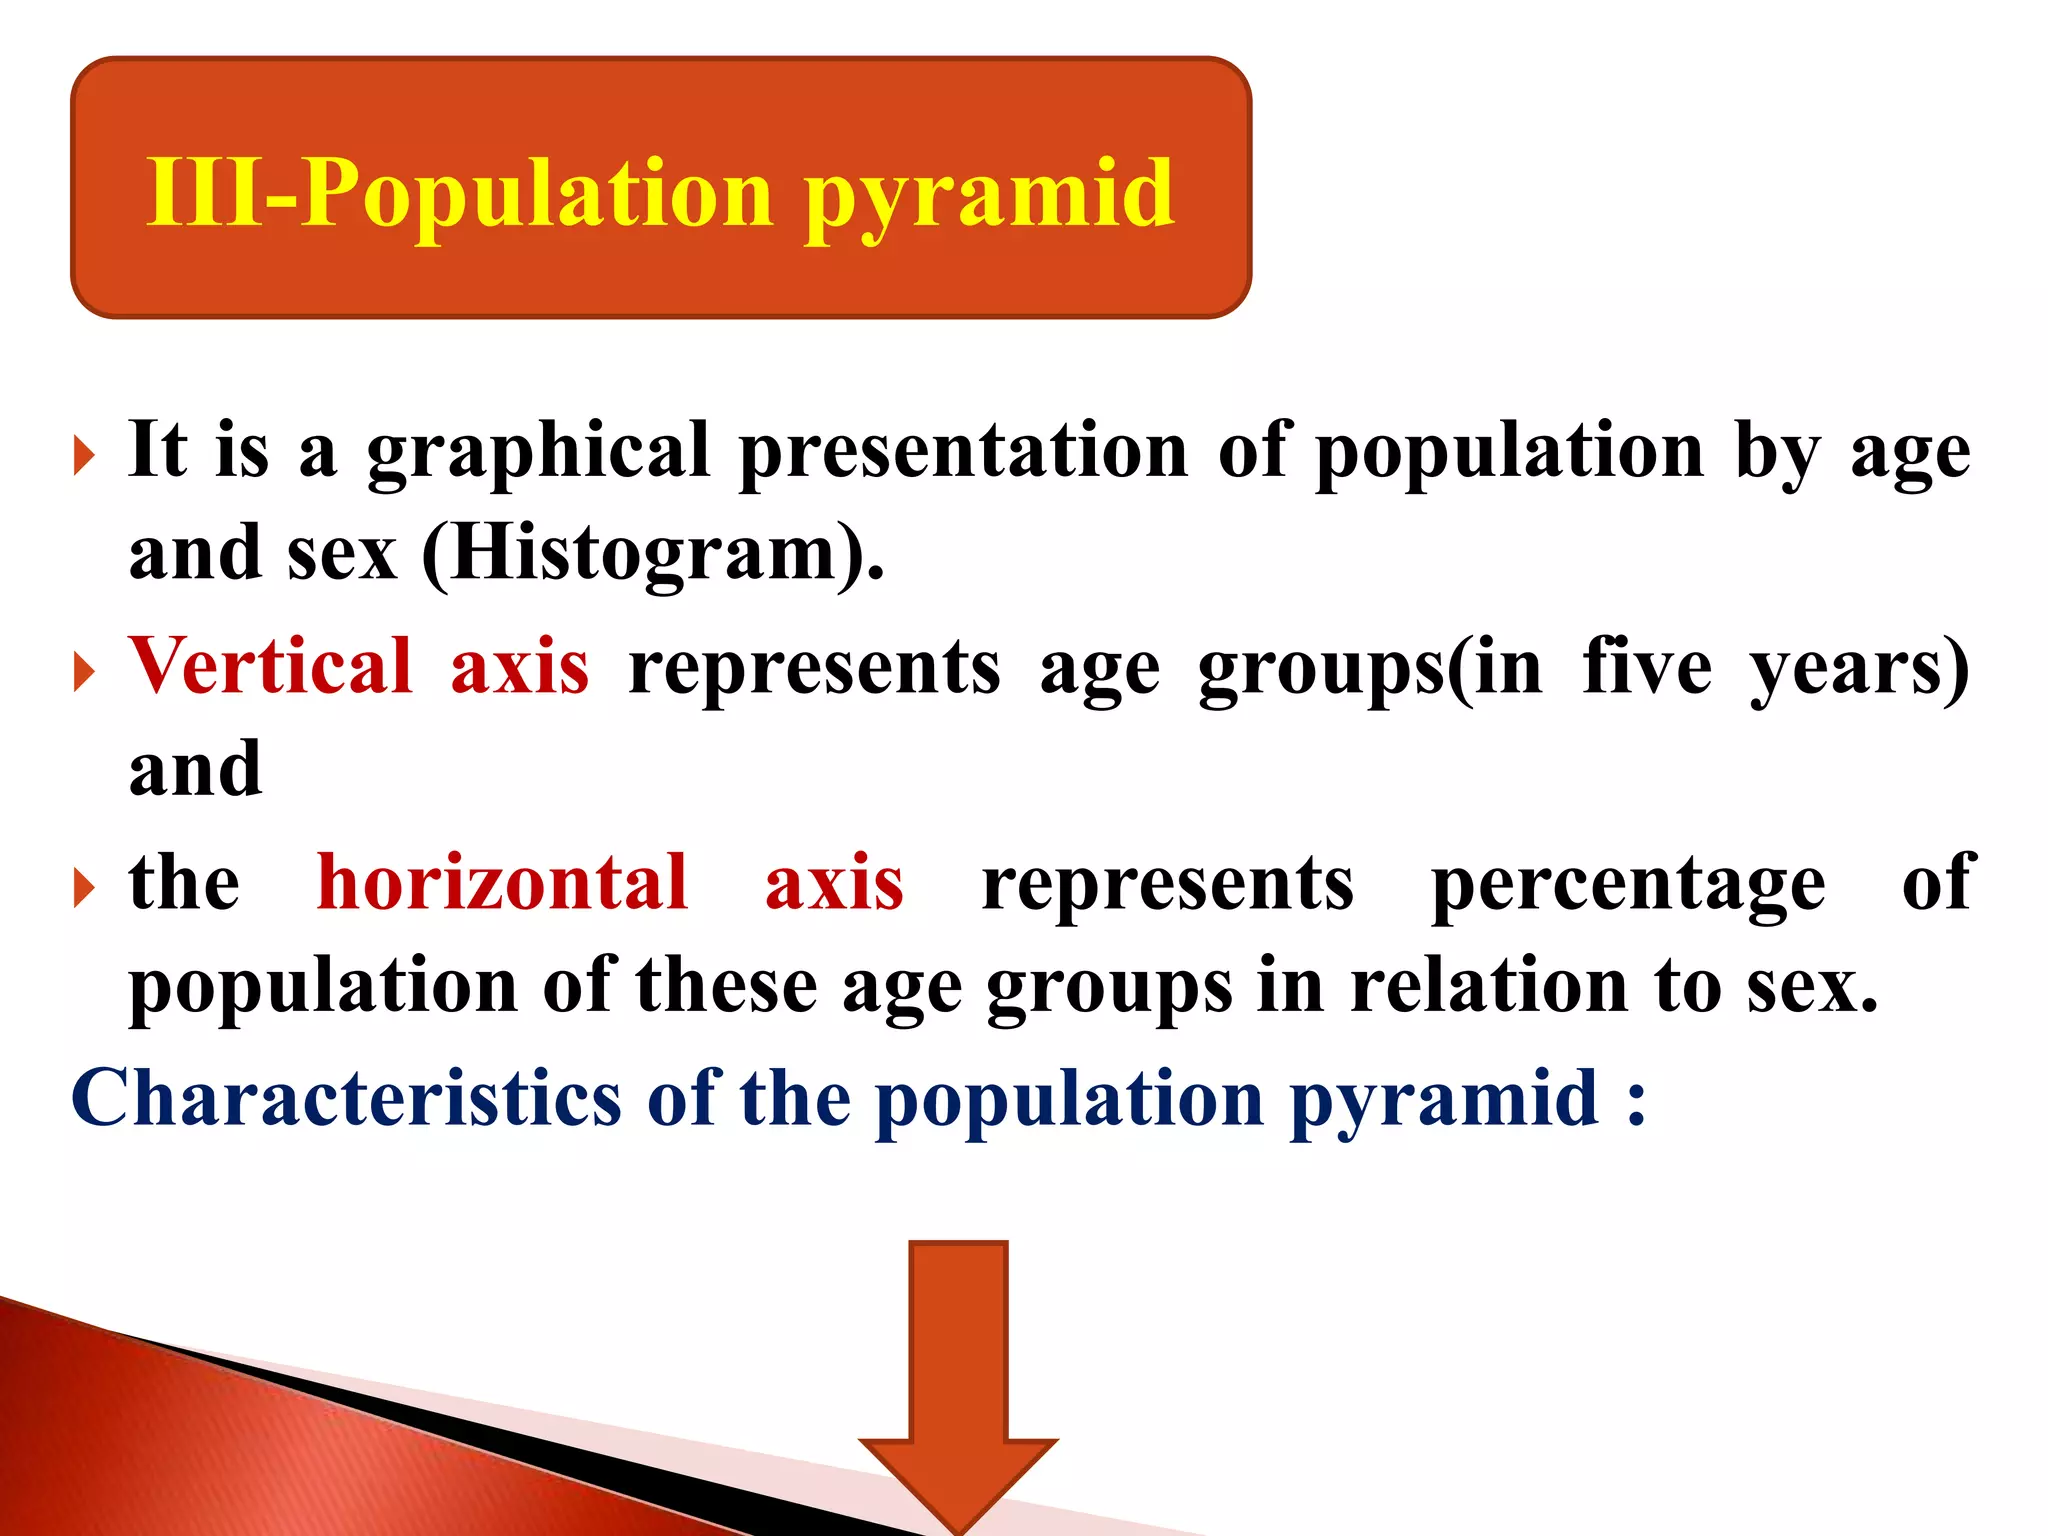
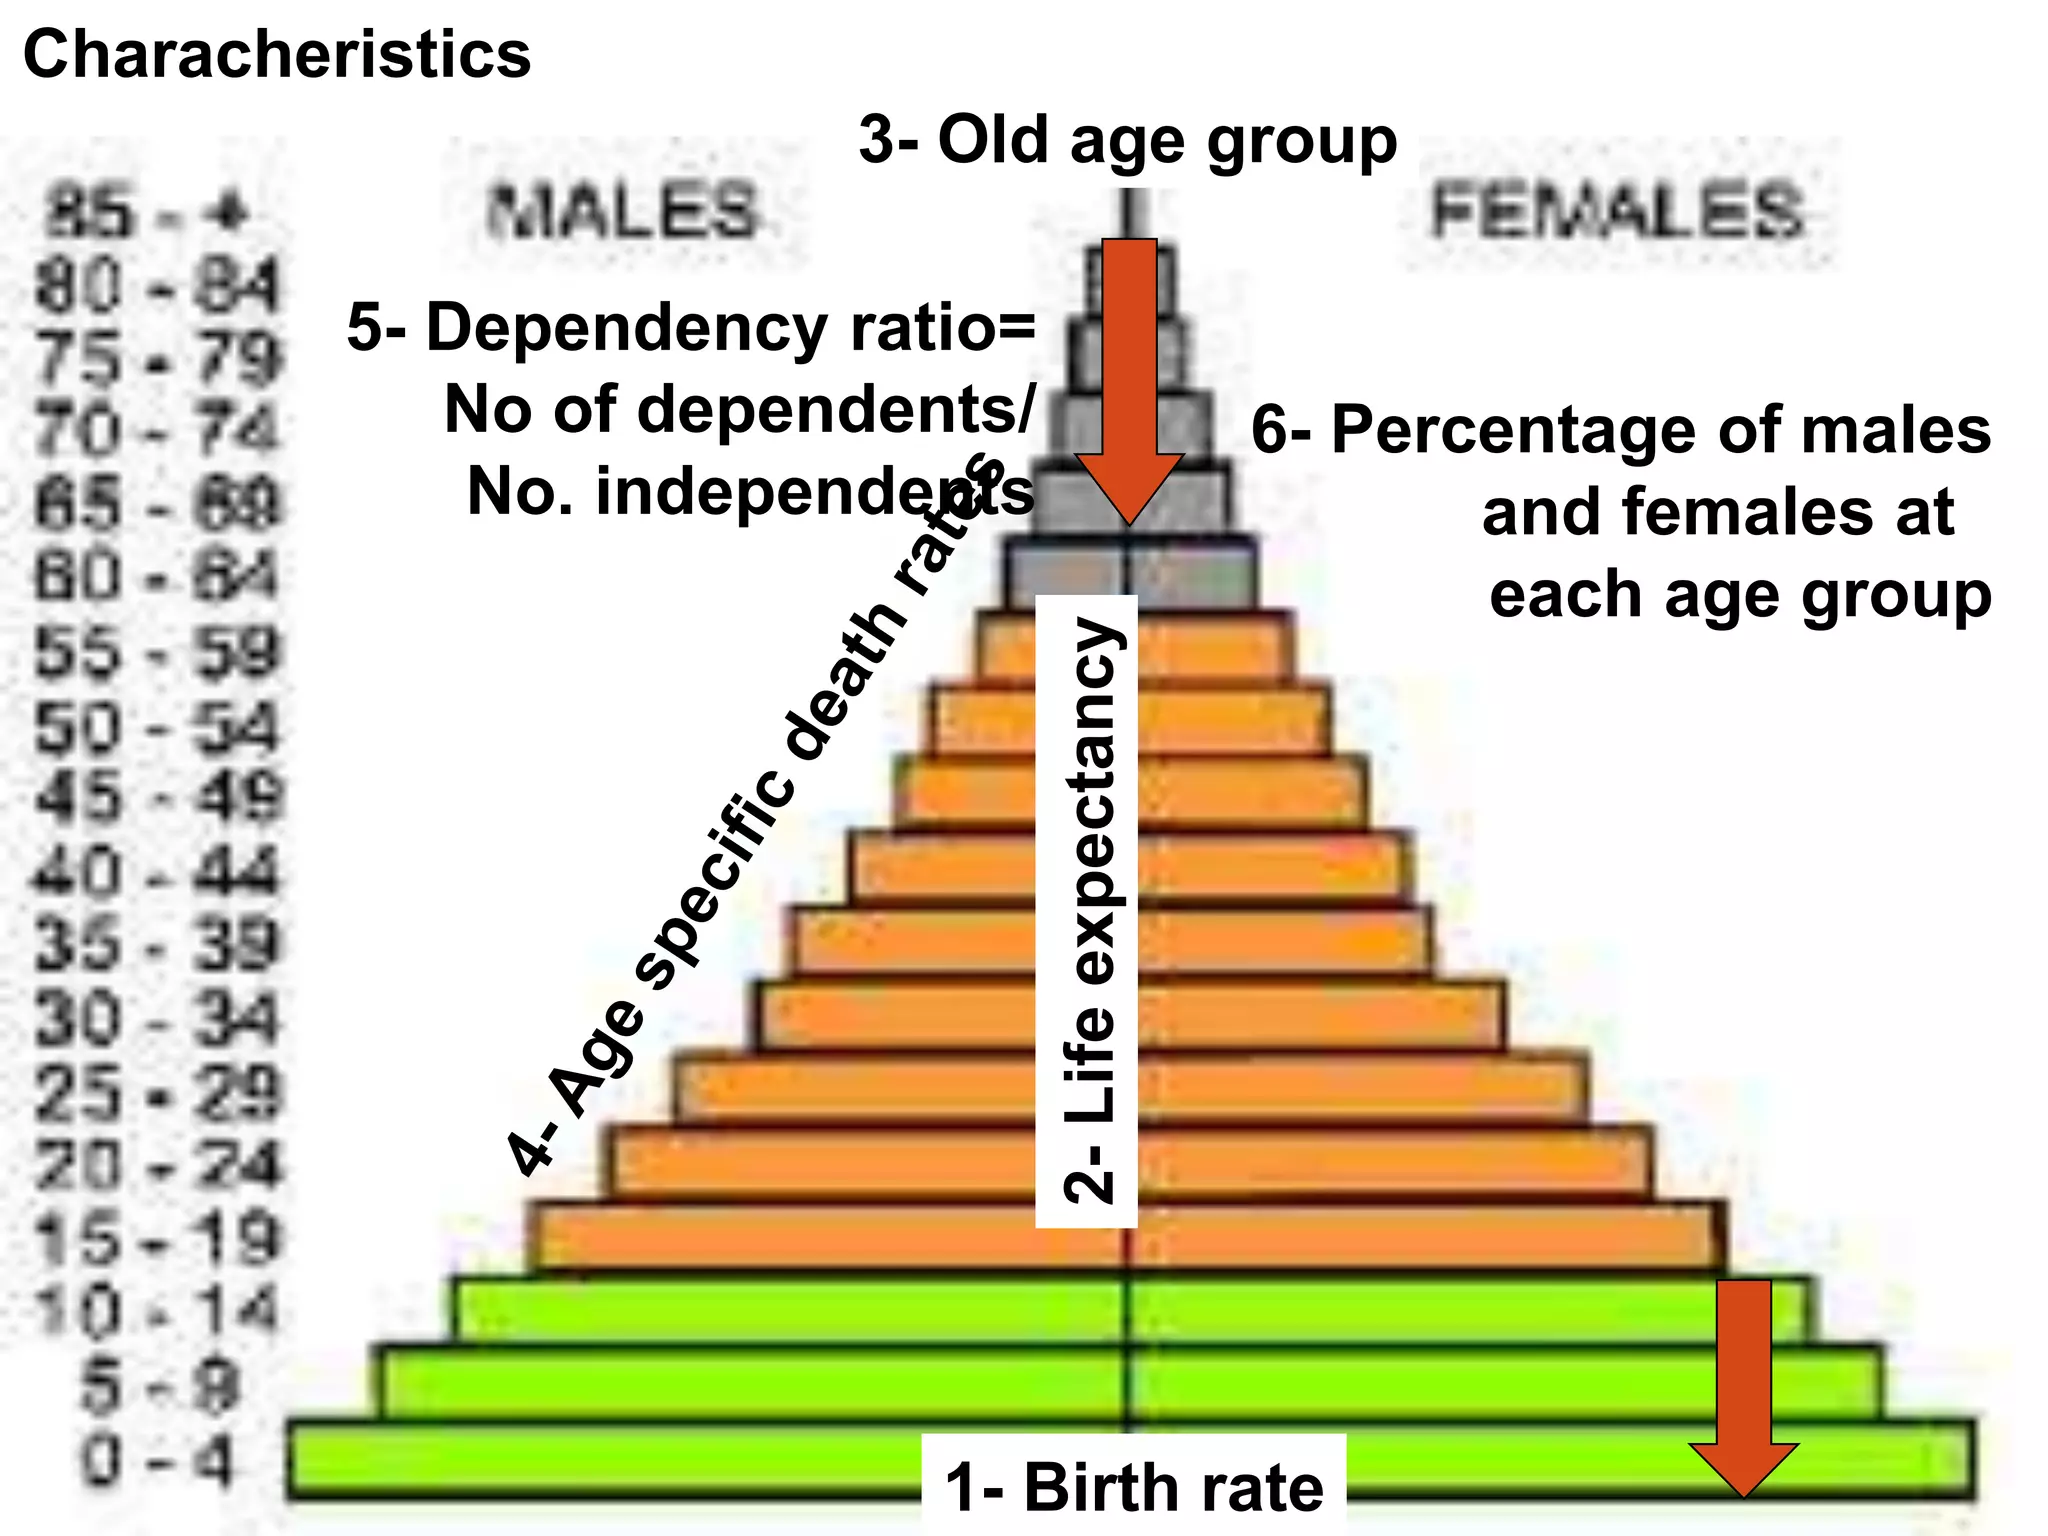
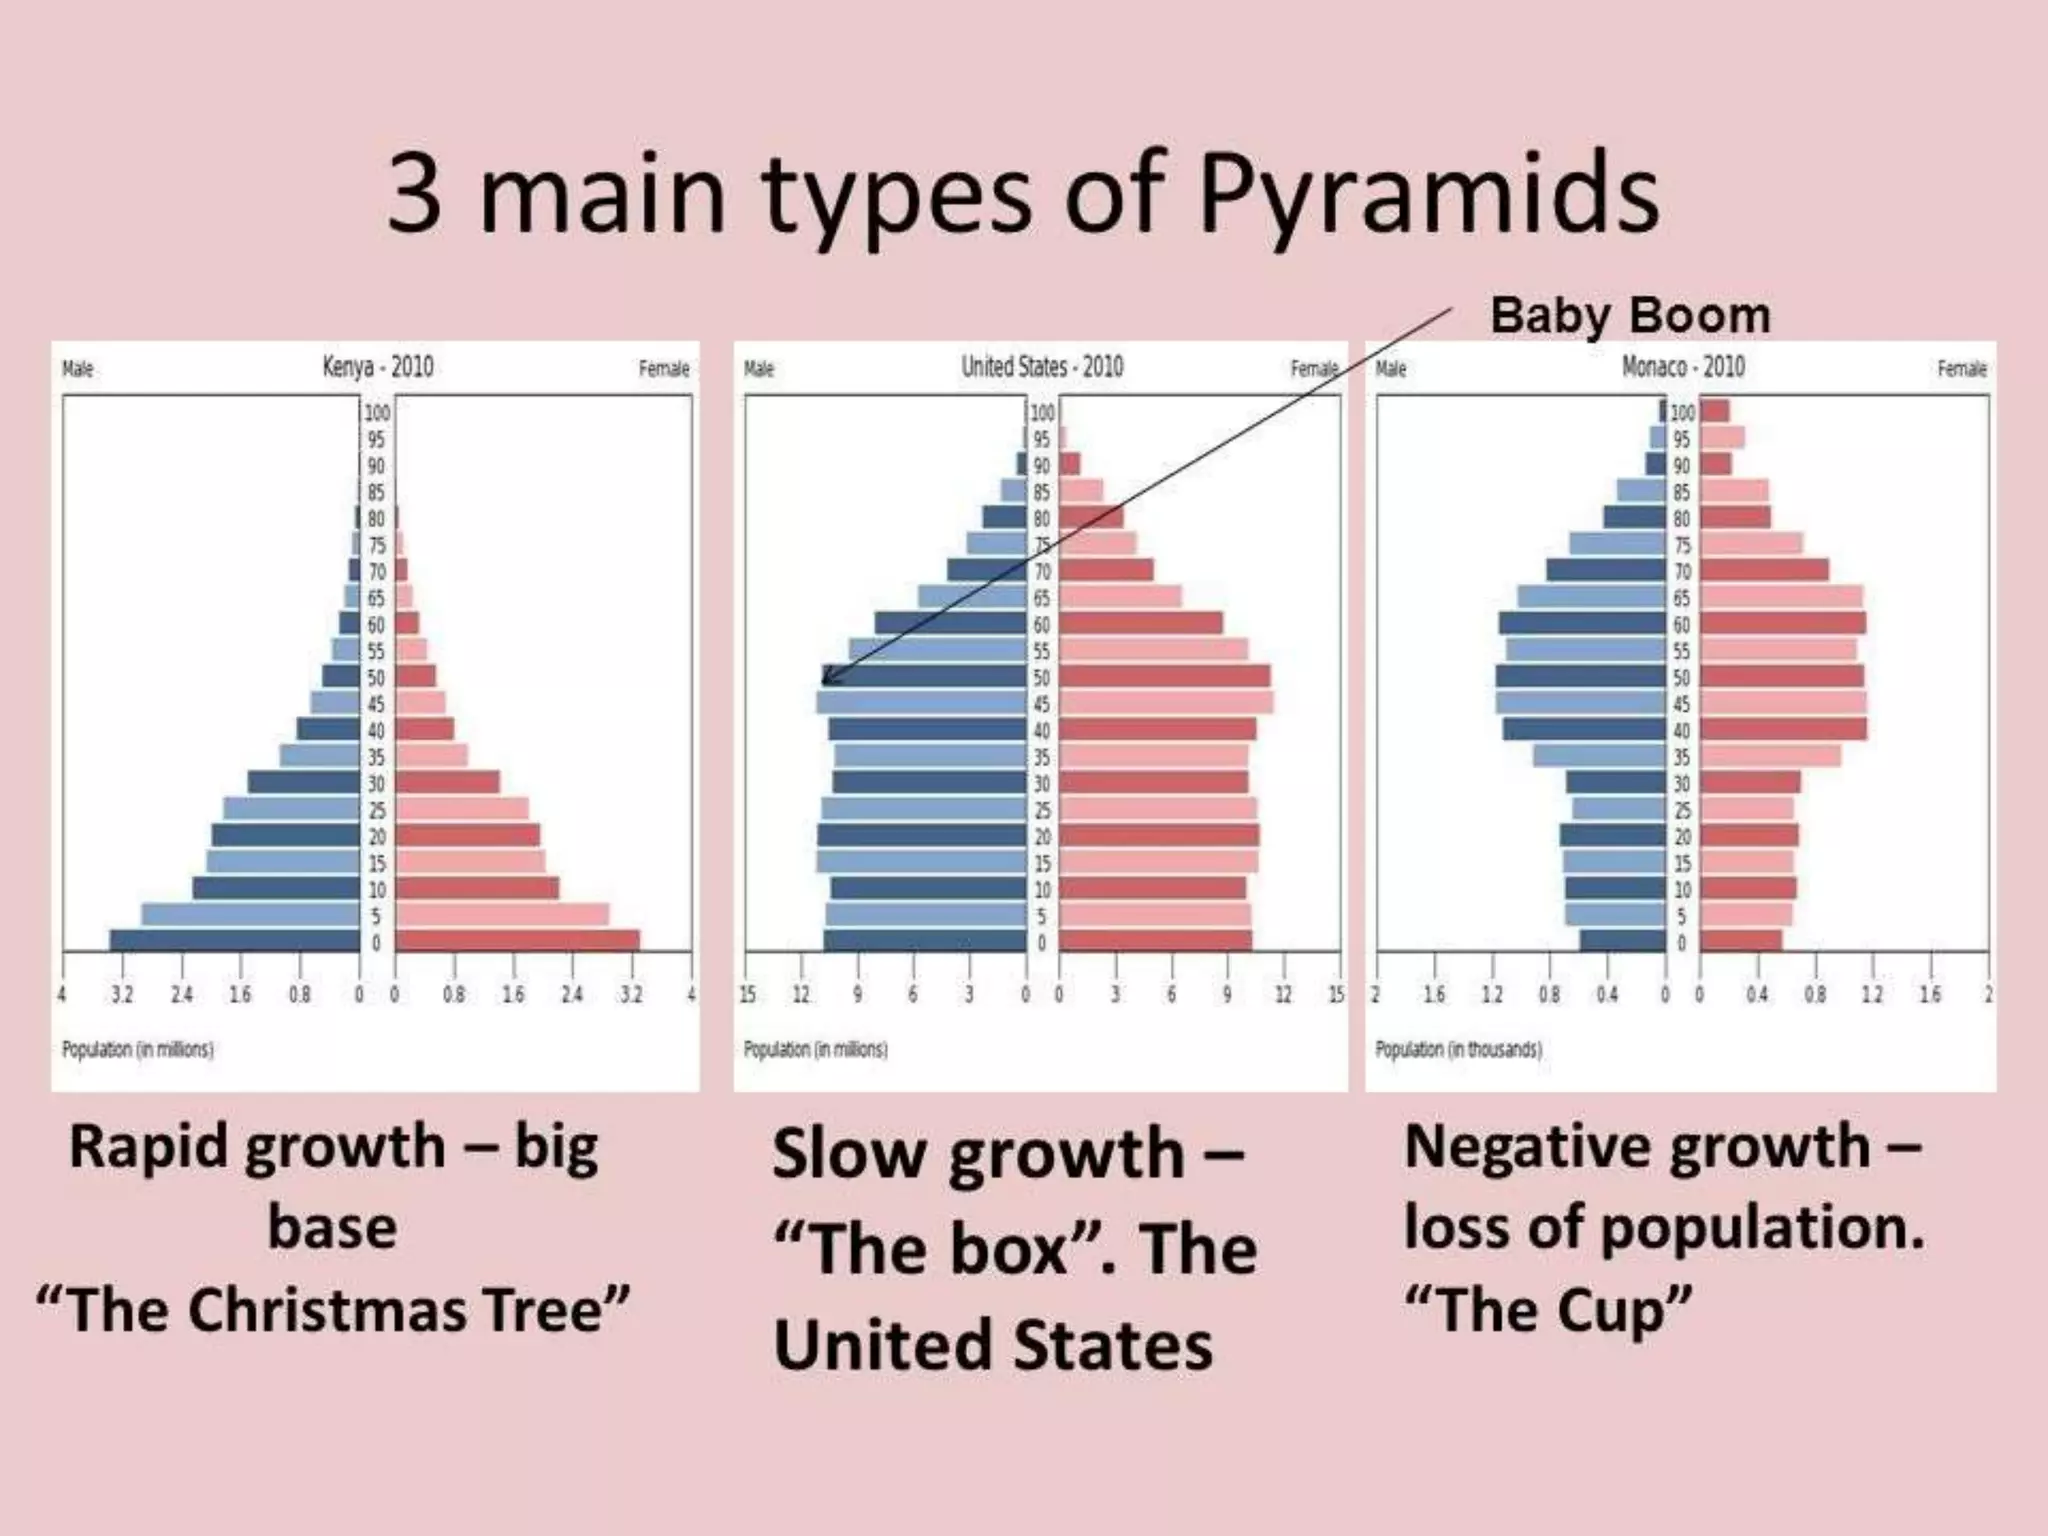
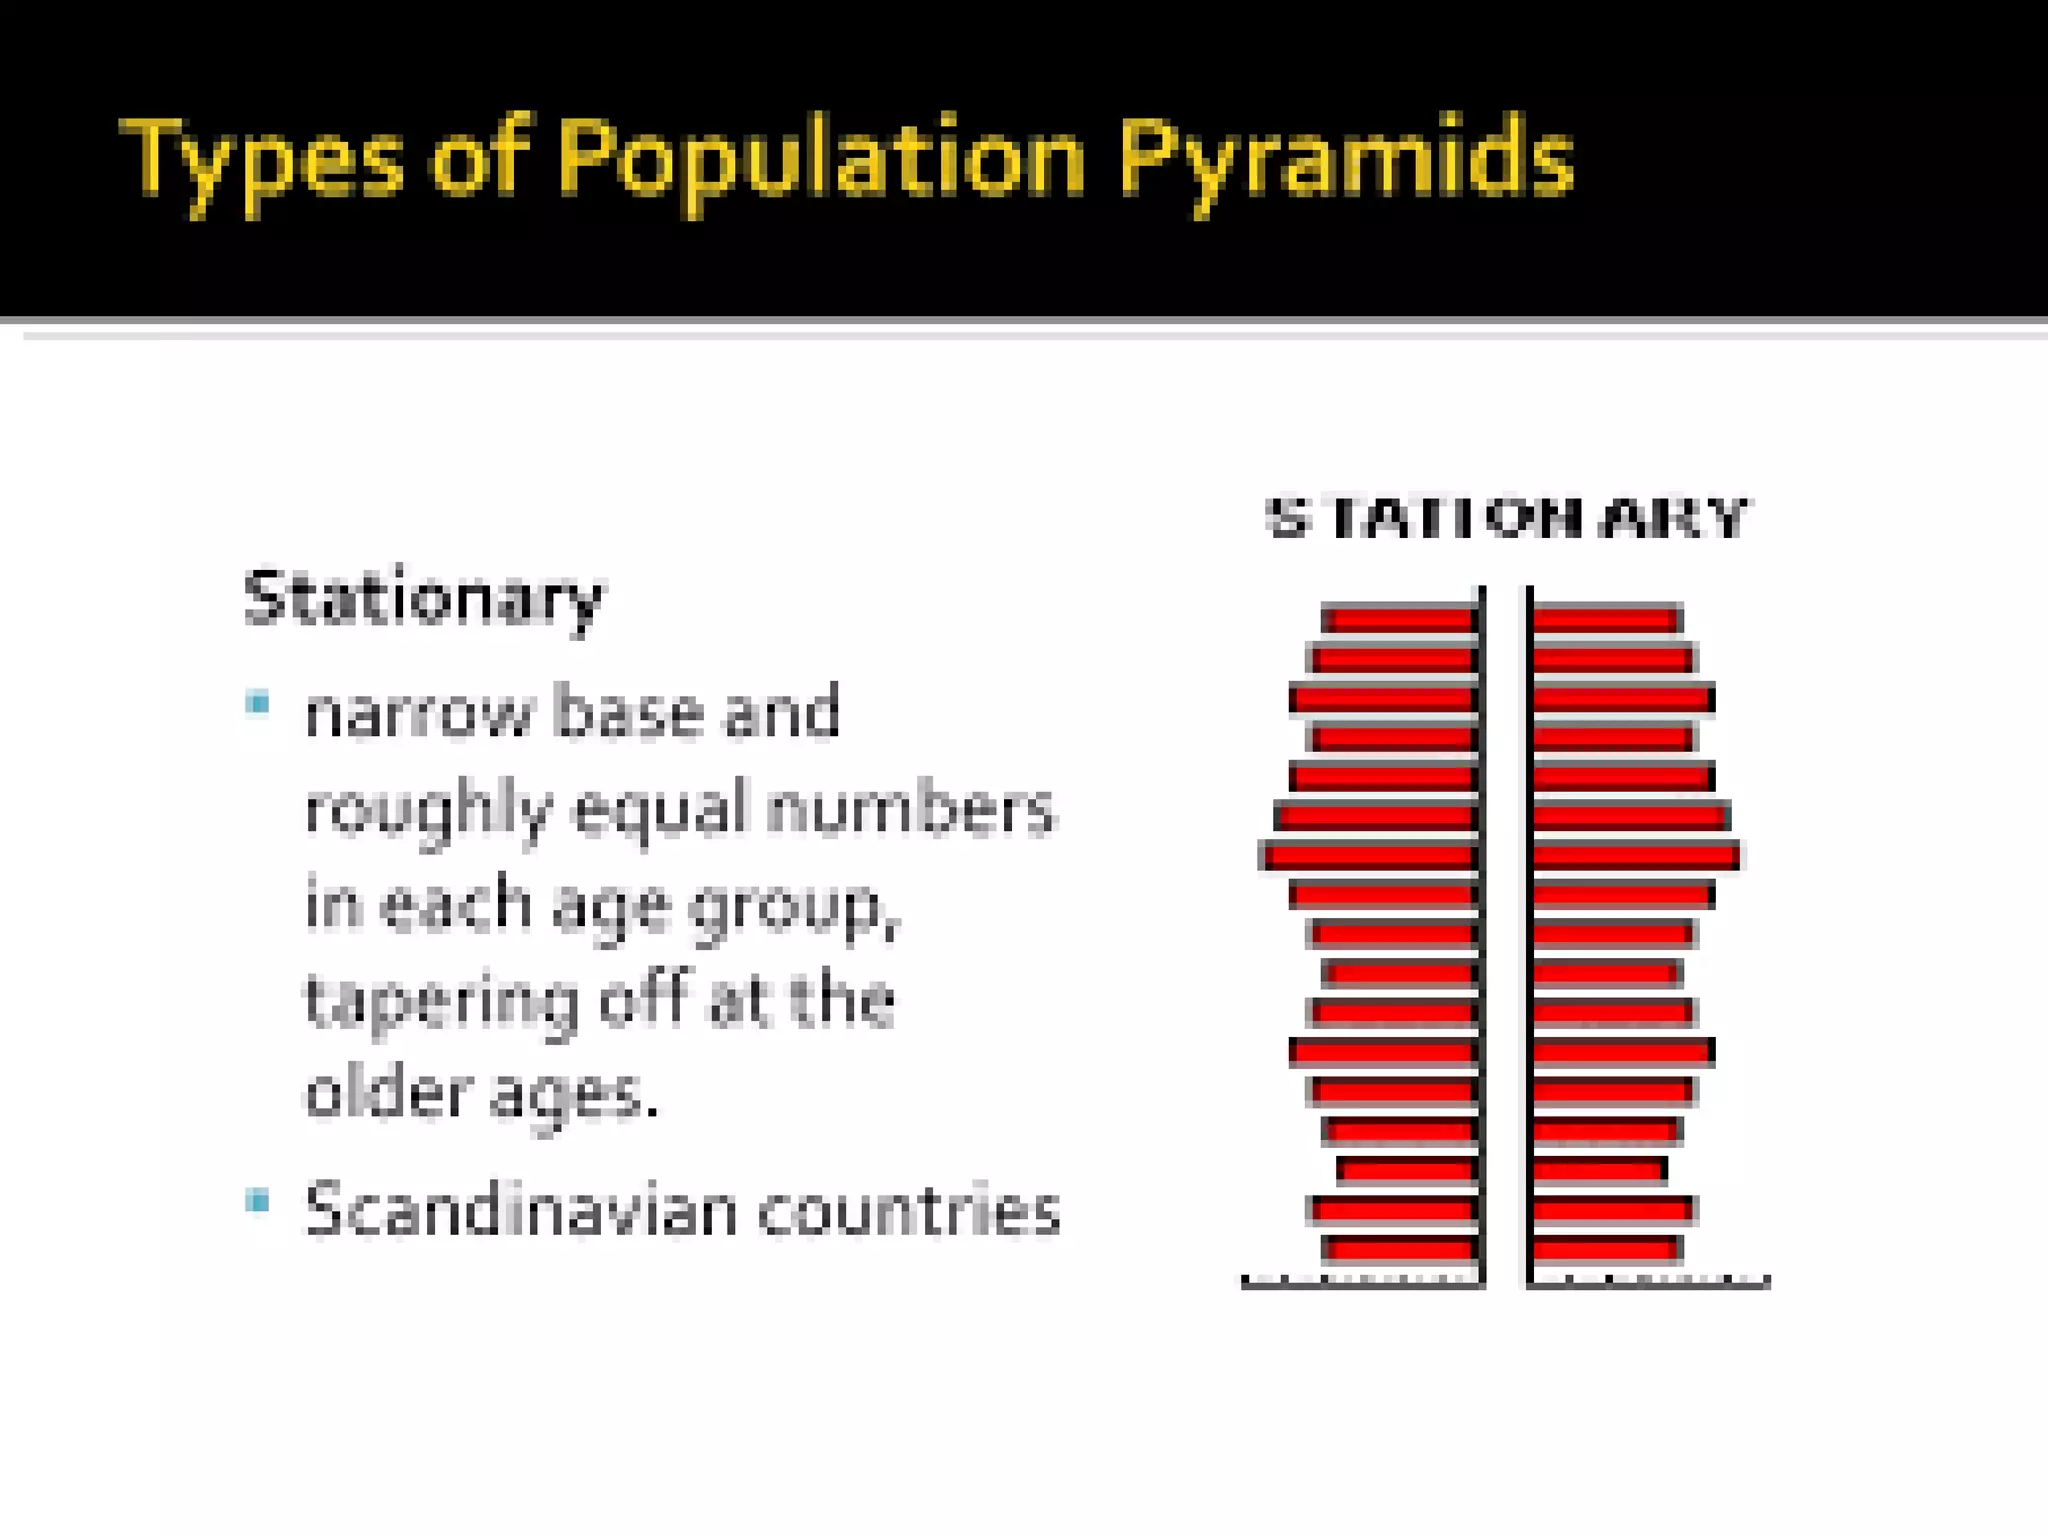
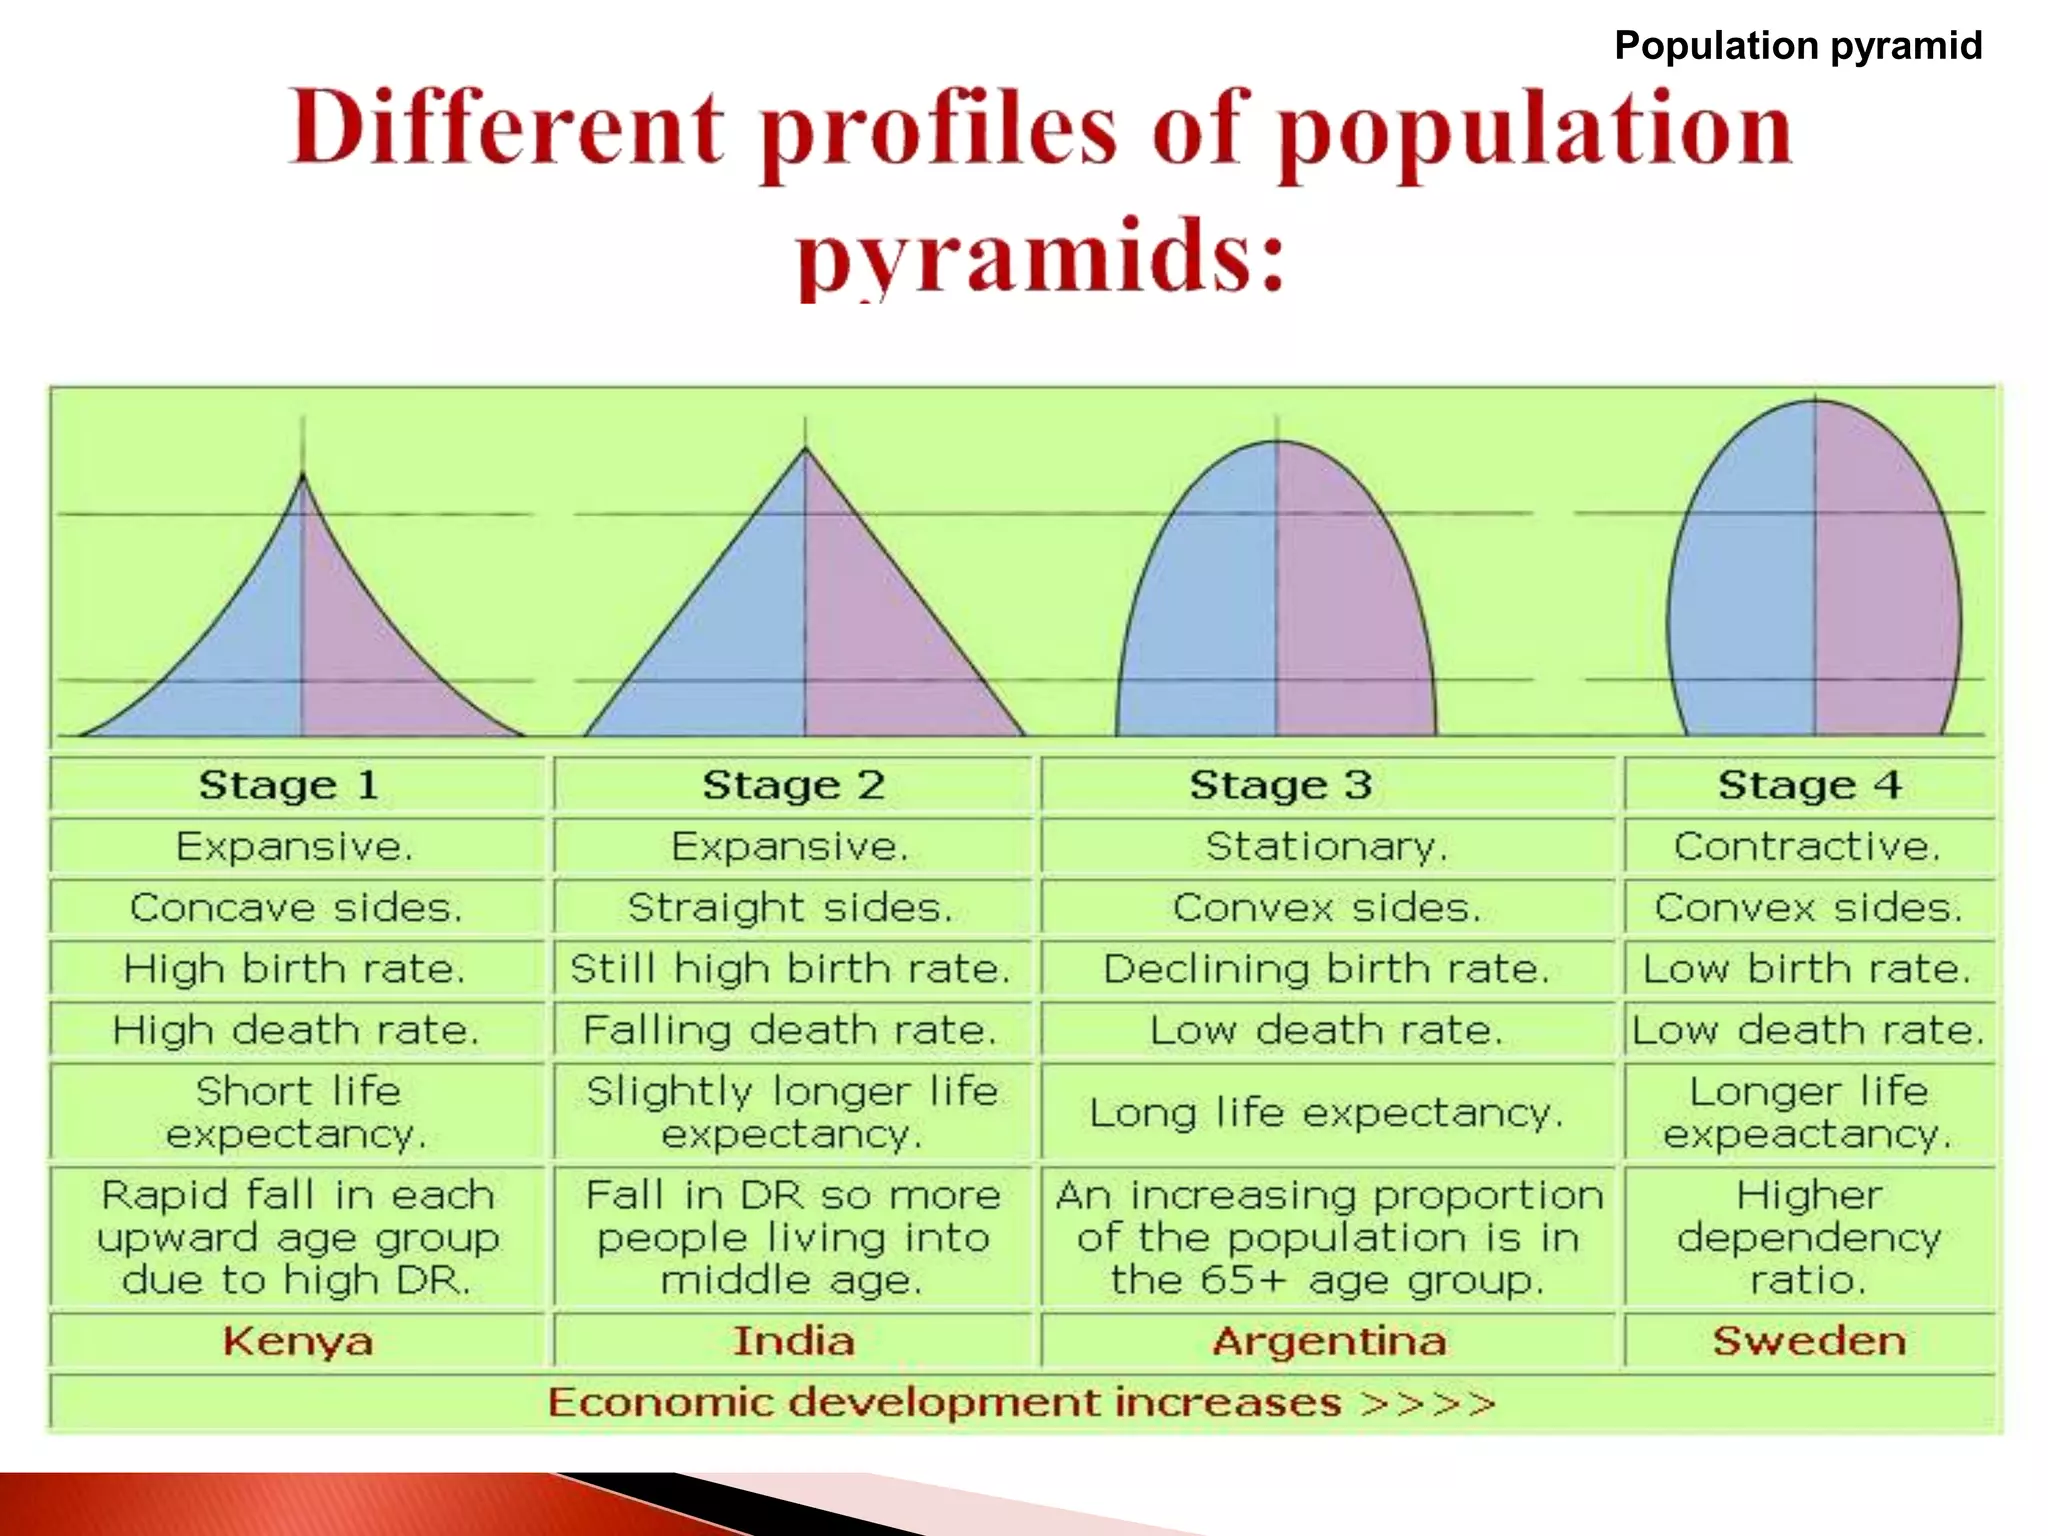
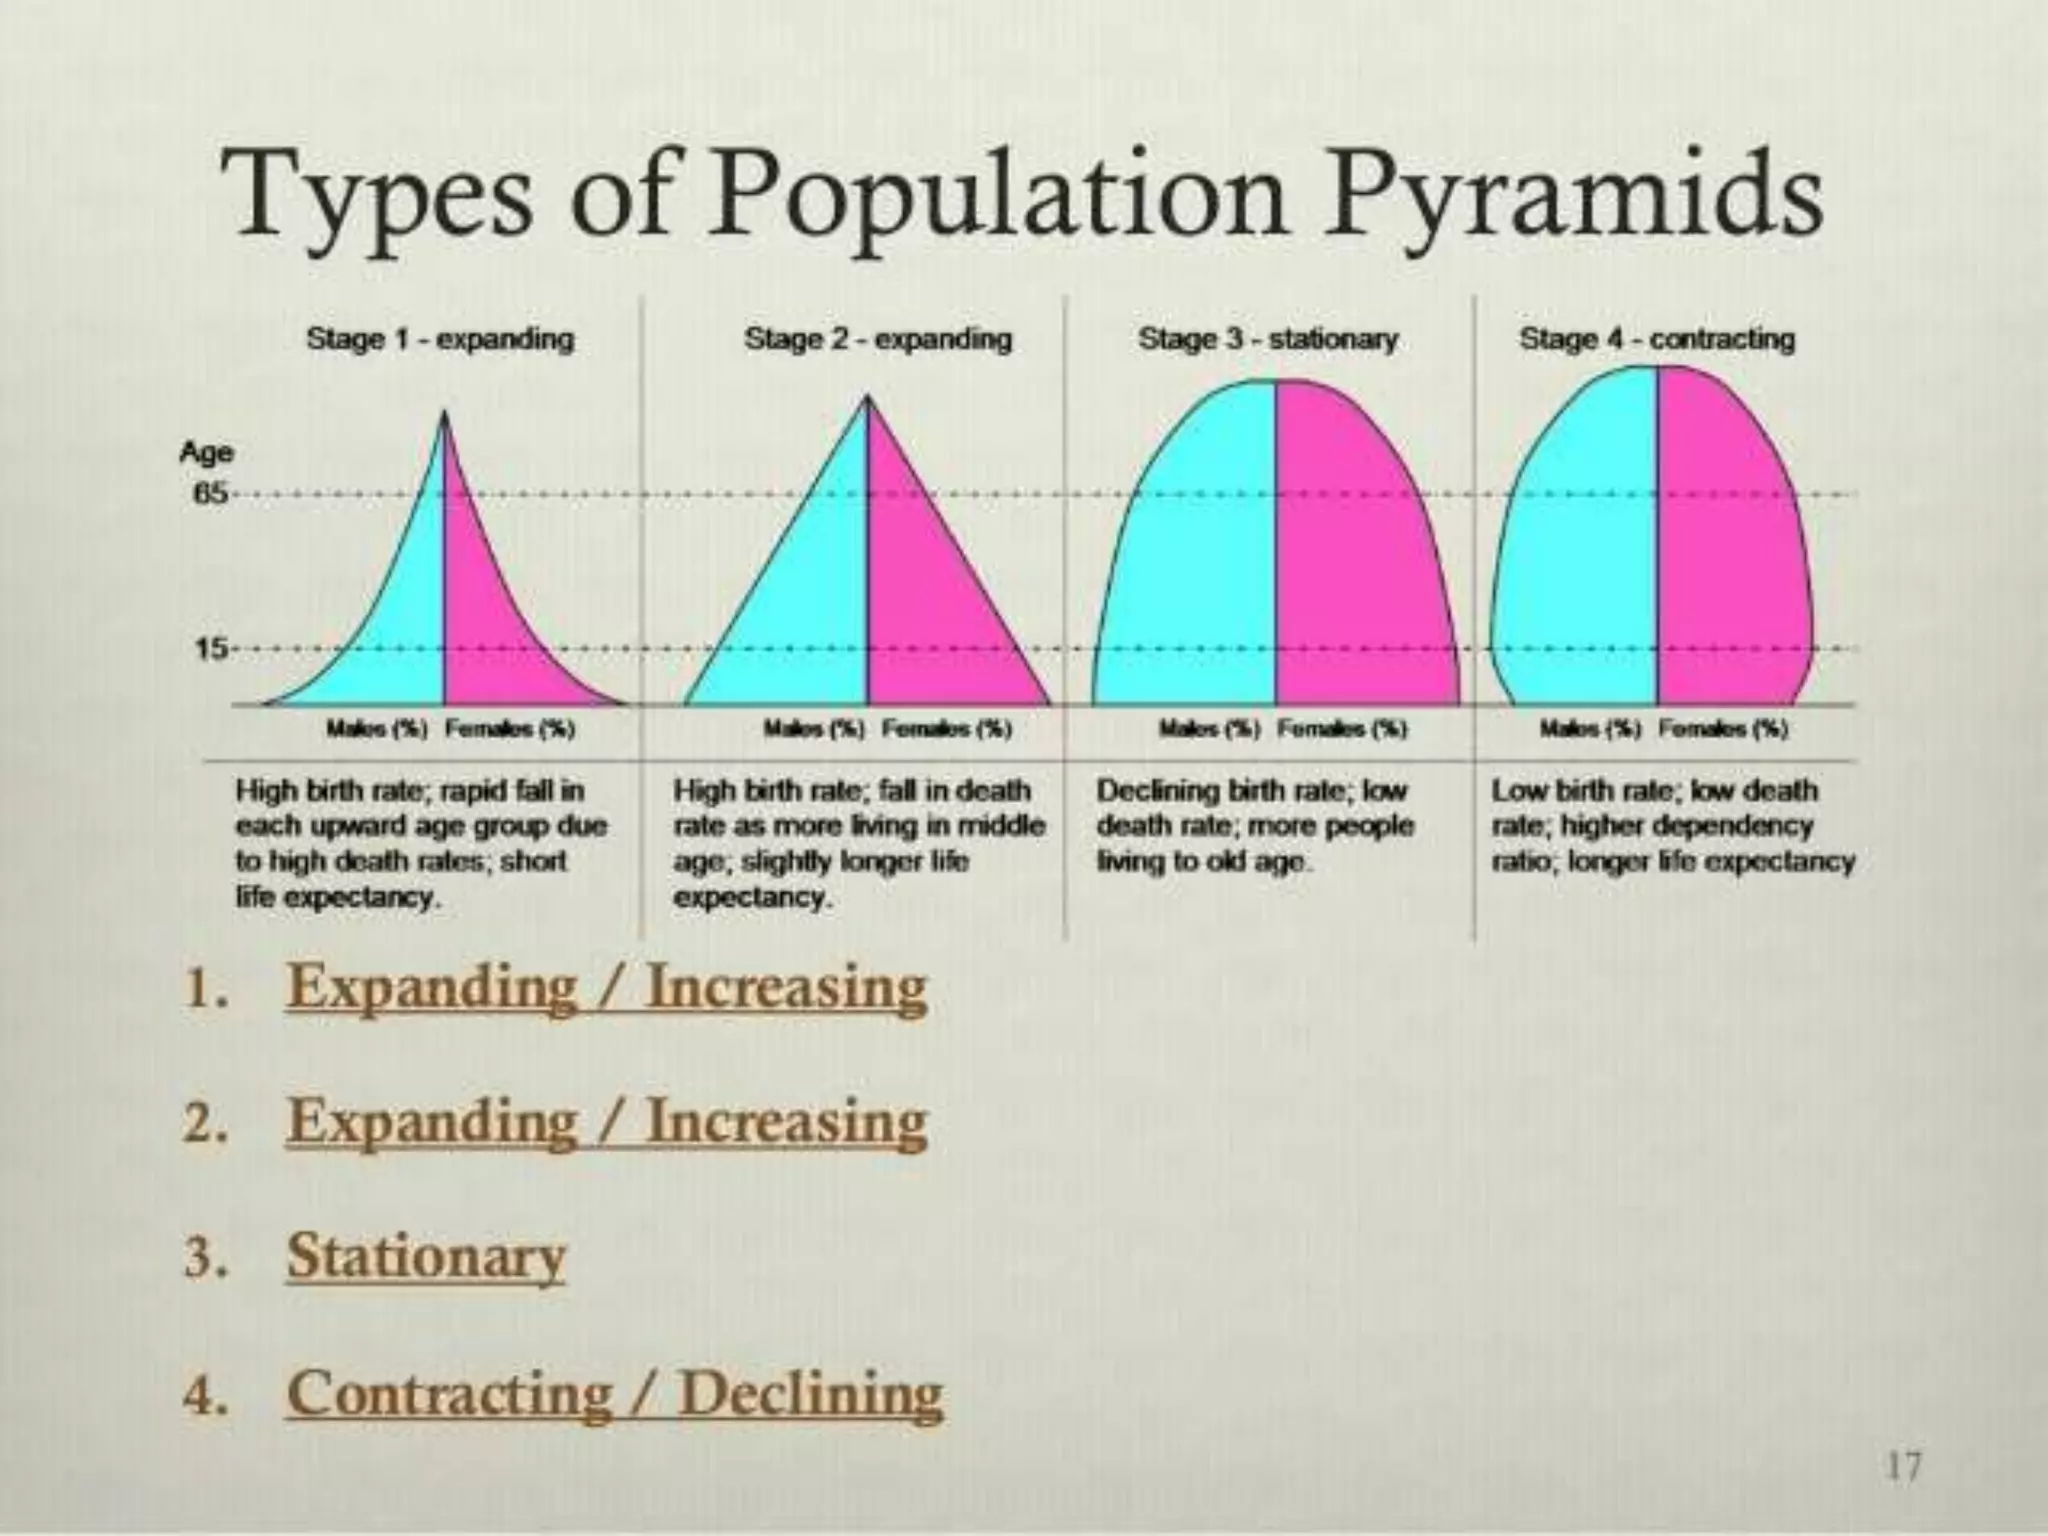
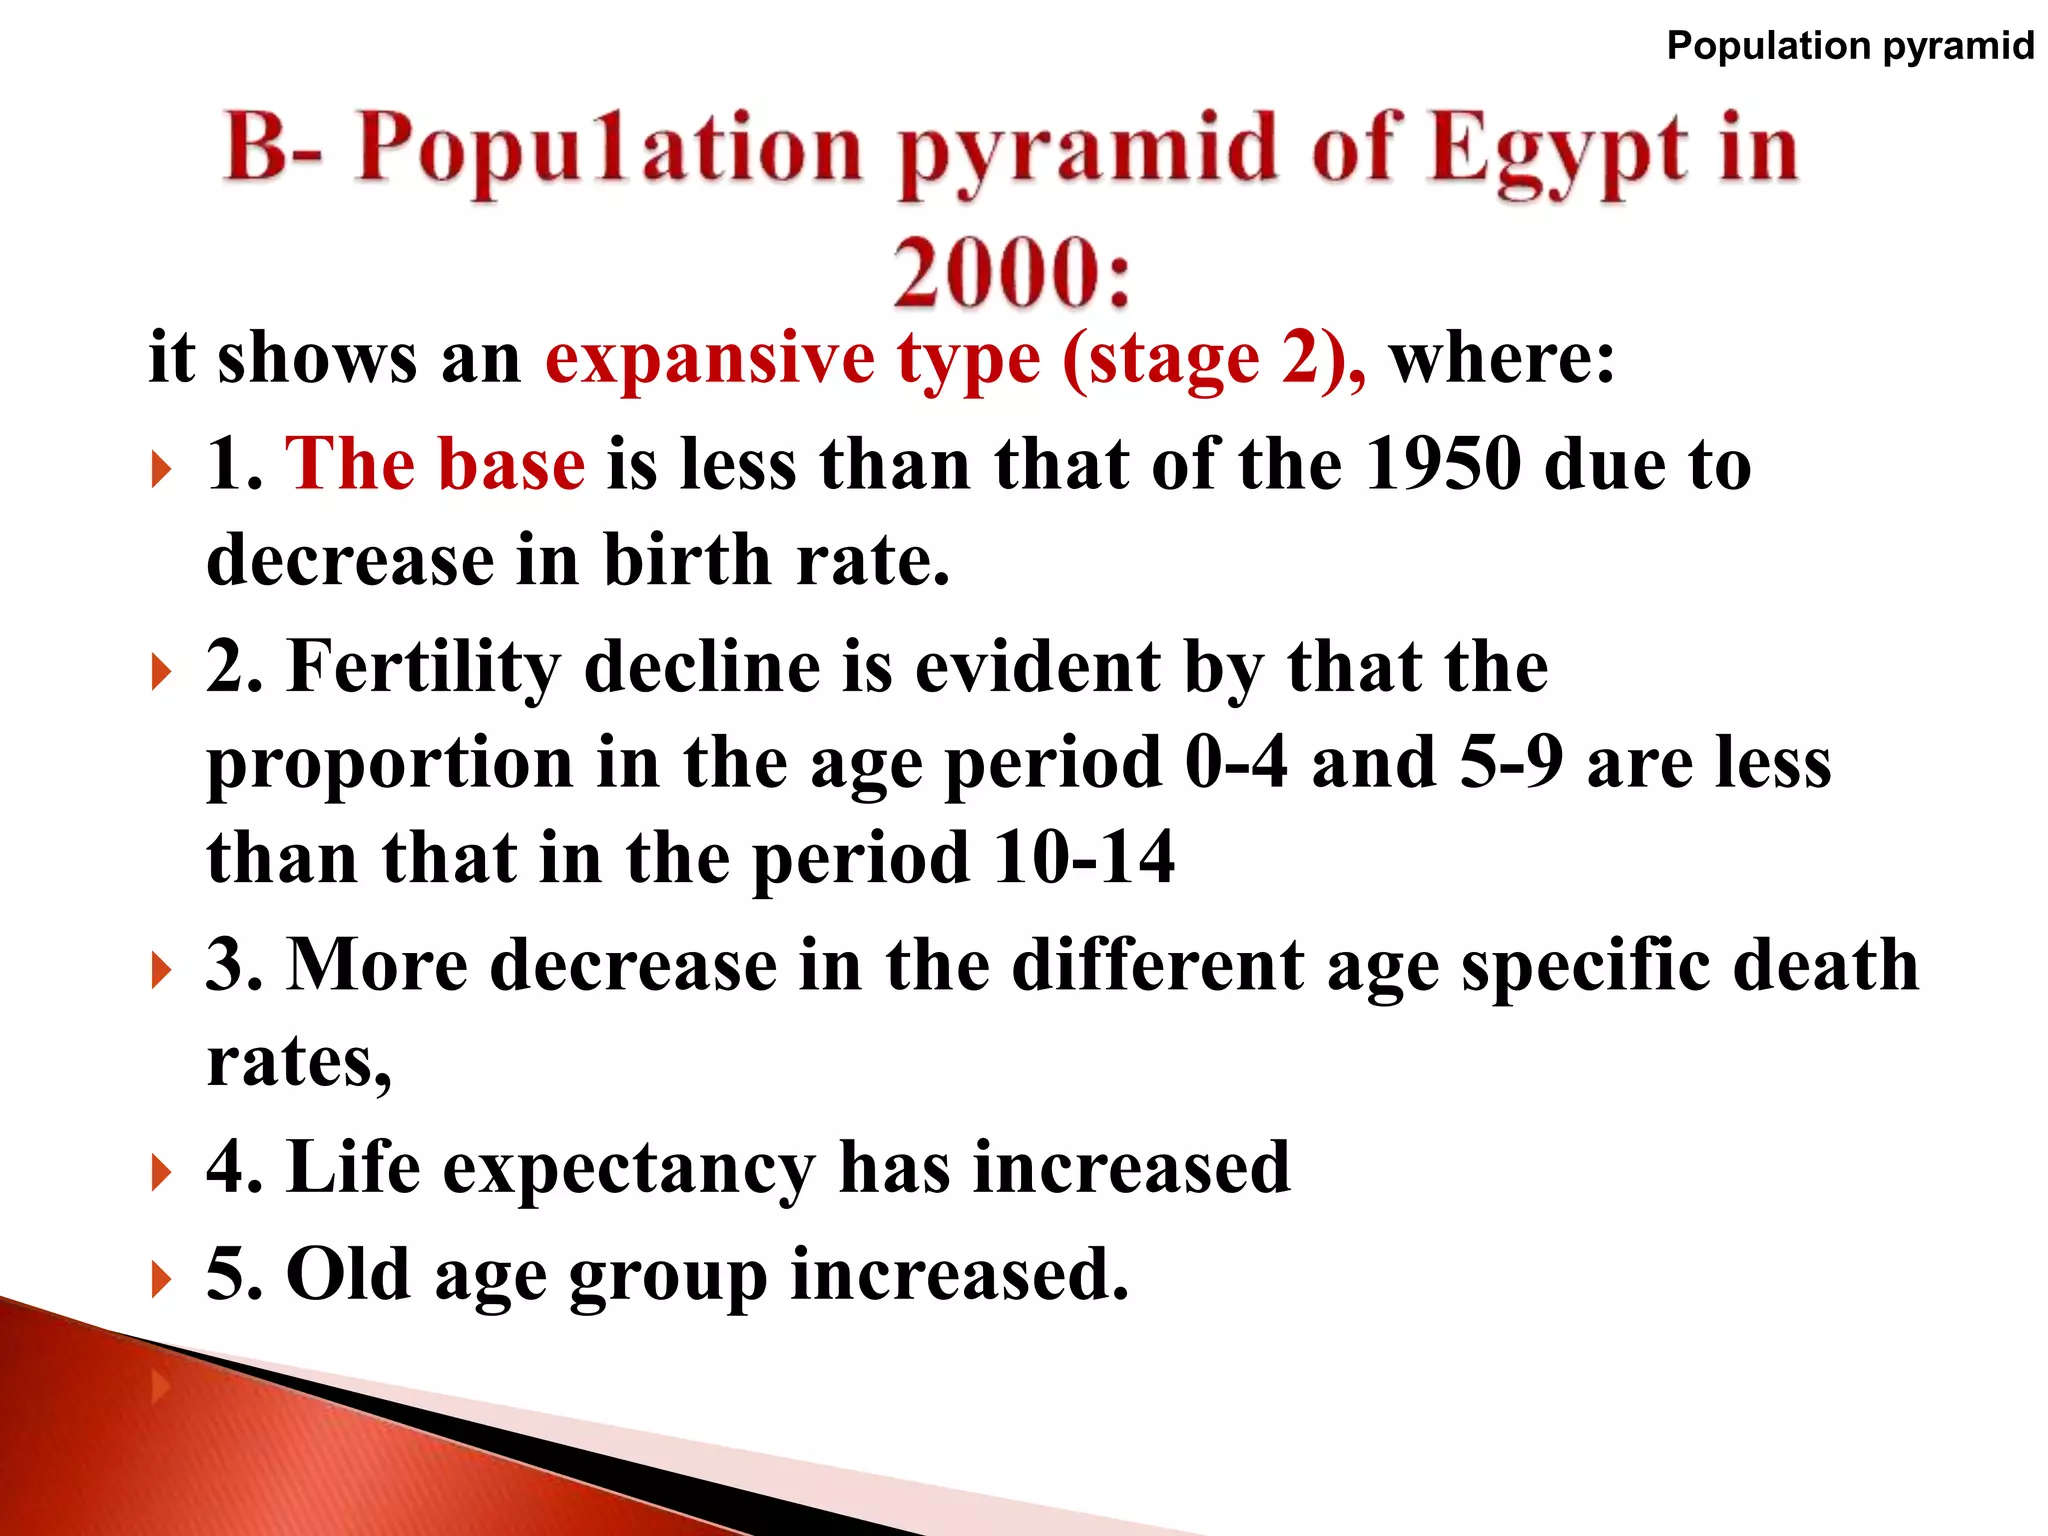
Describe & interpret different profiles of the
population pyramid
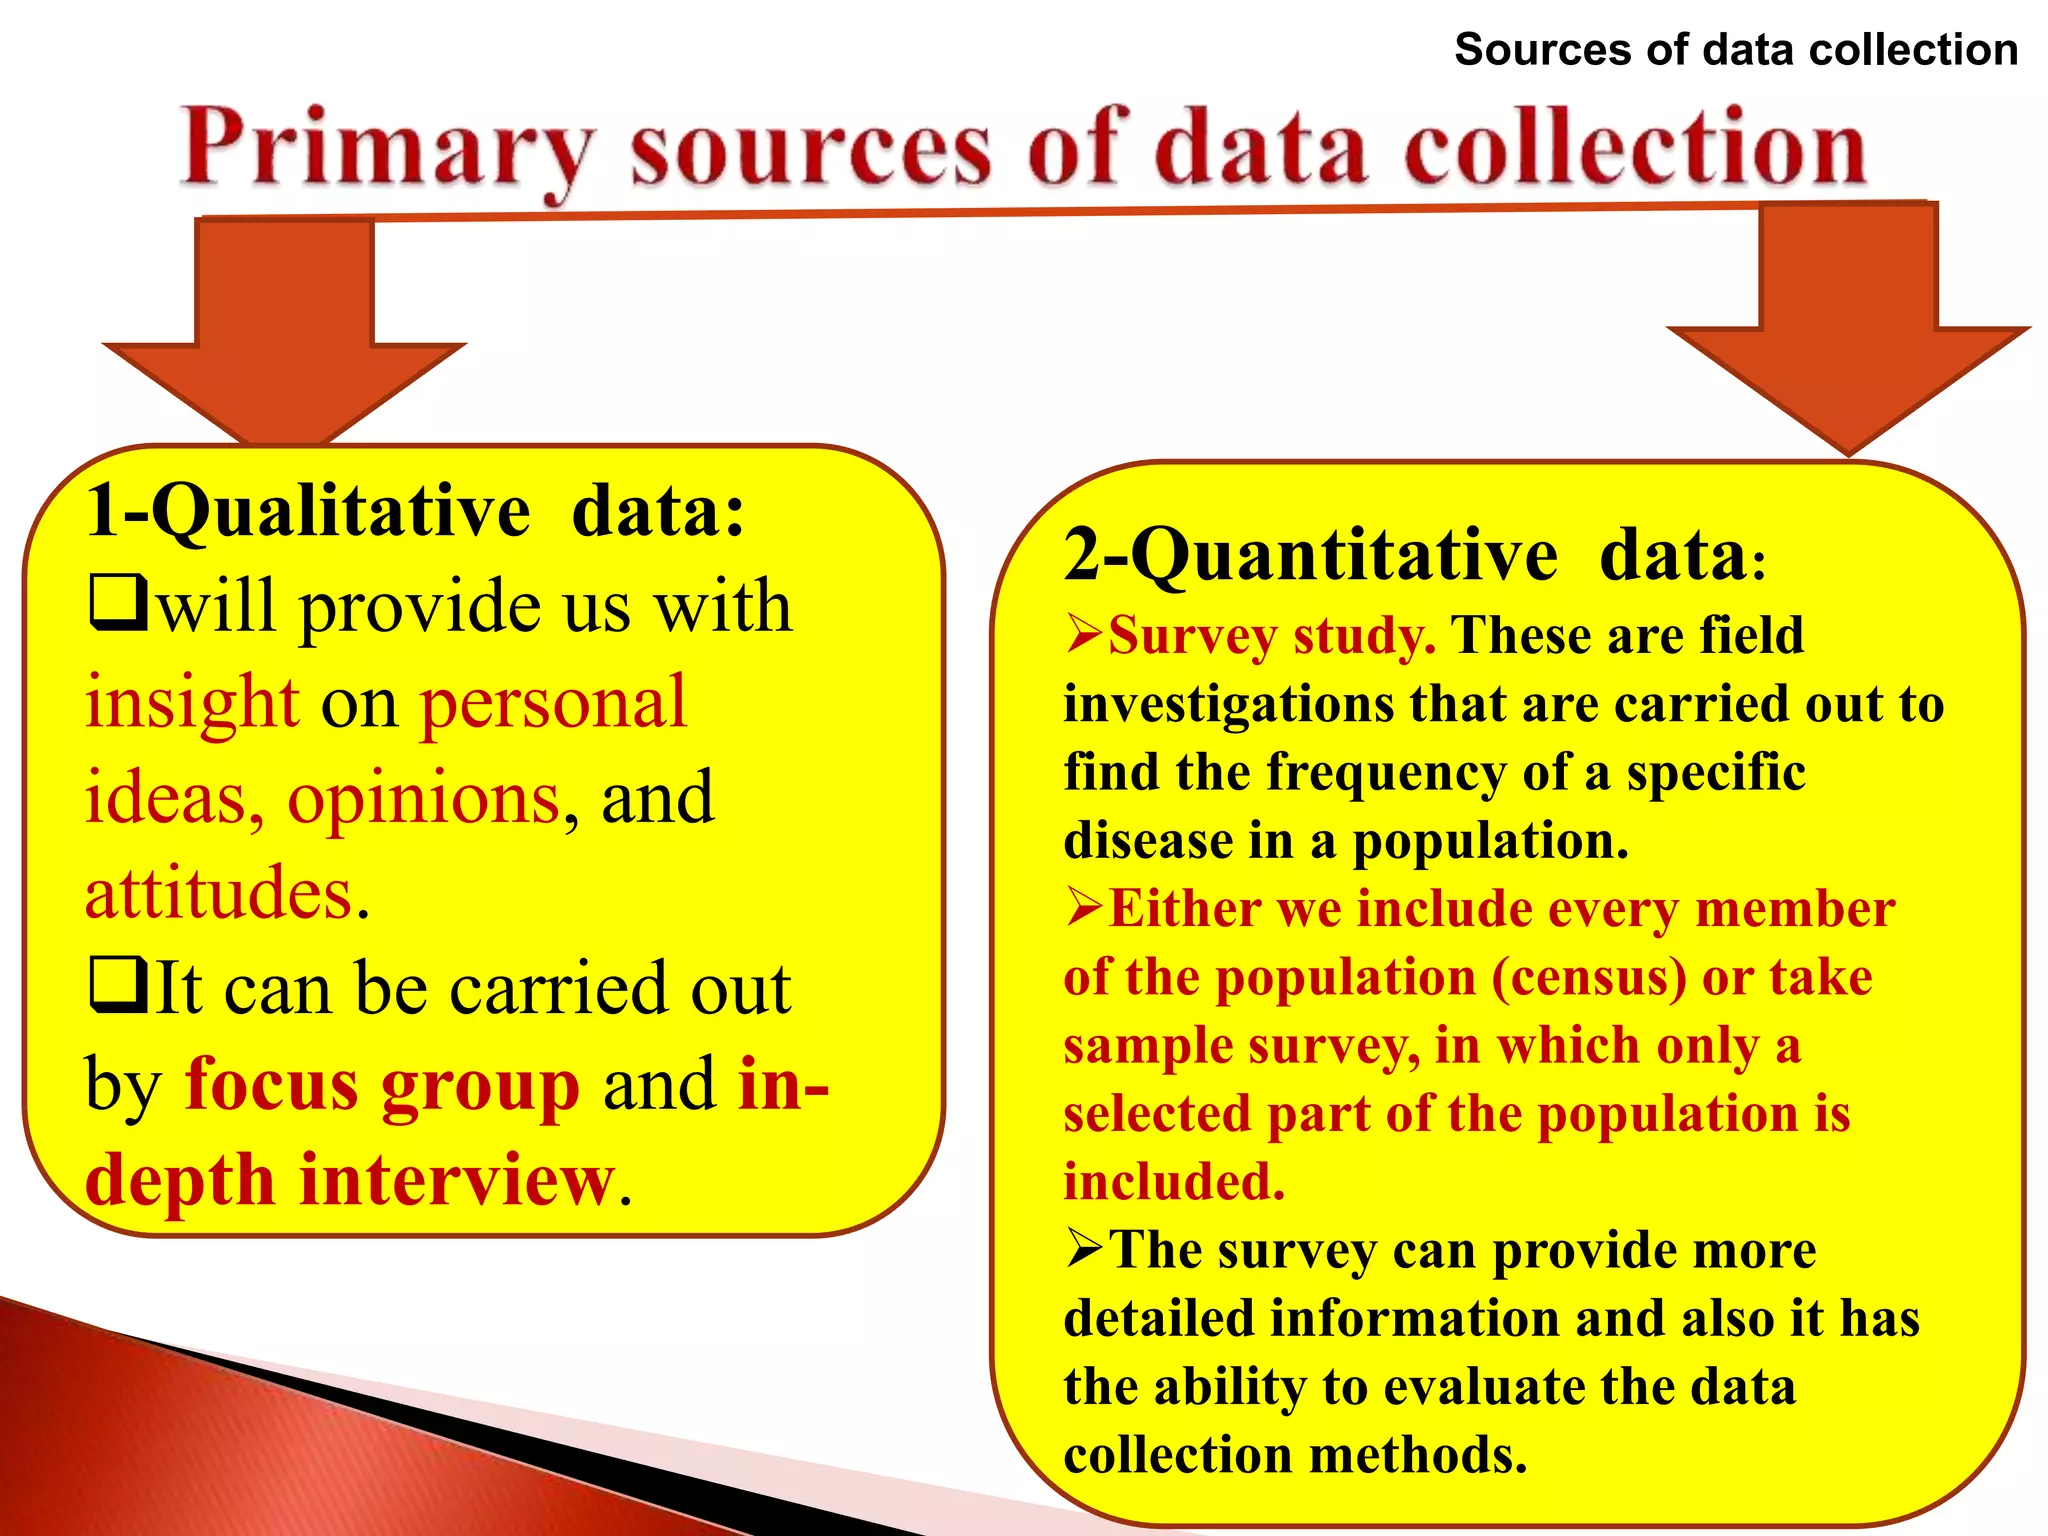
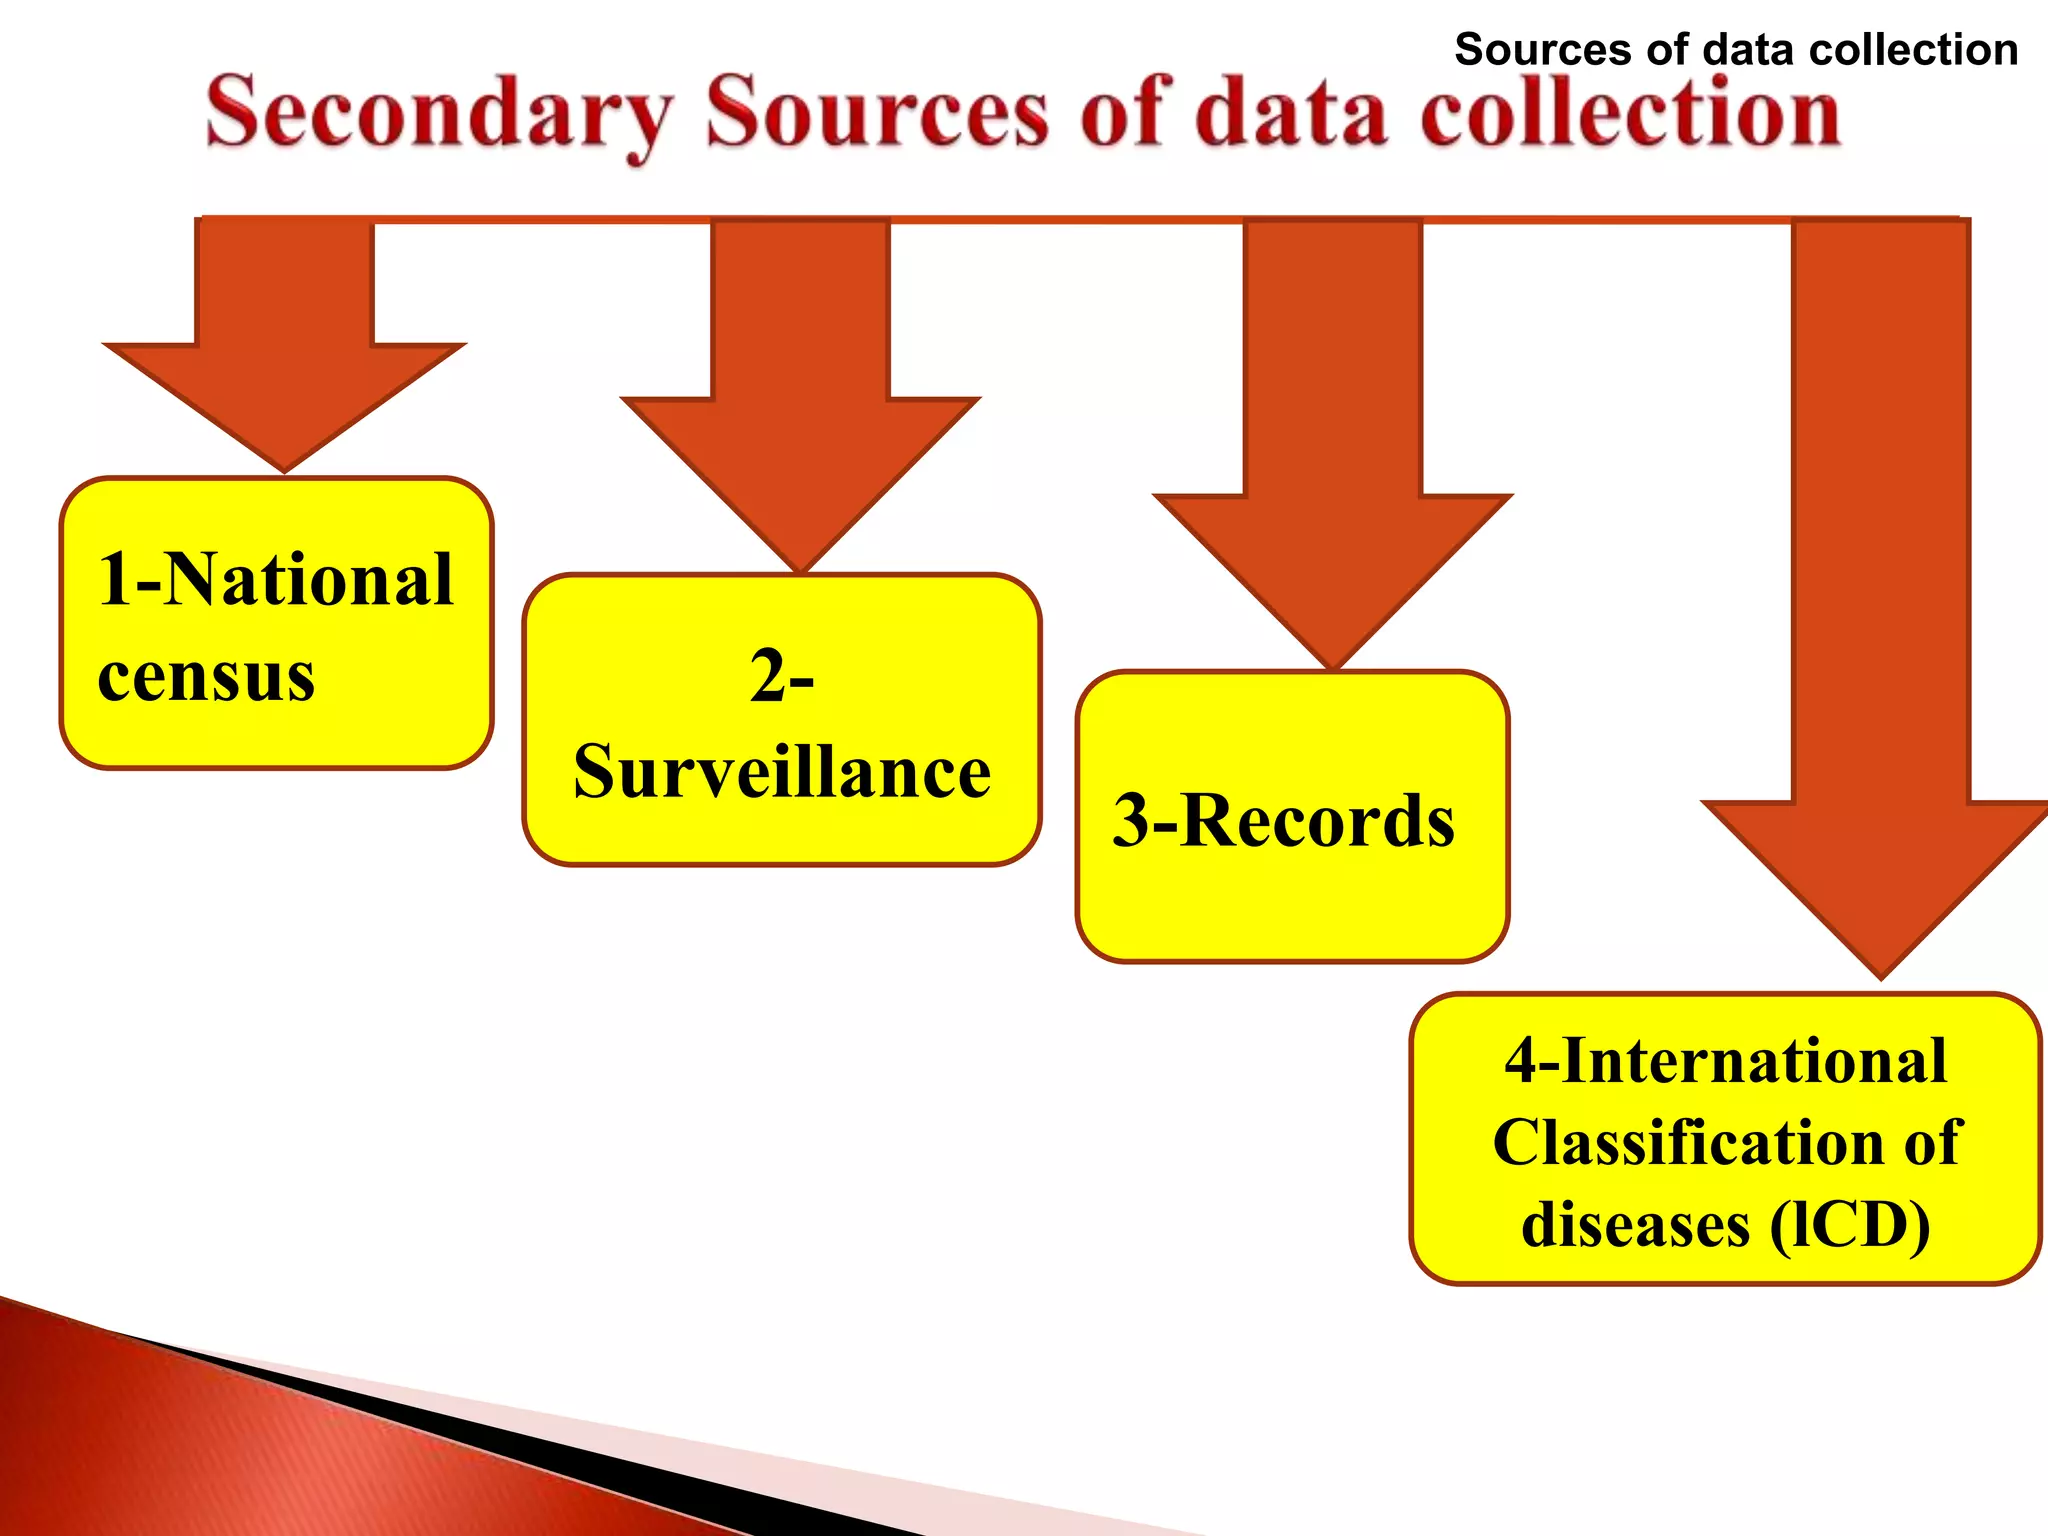
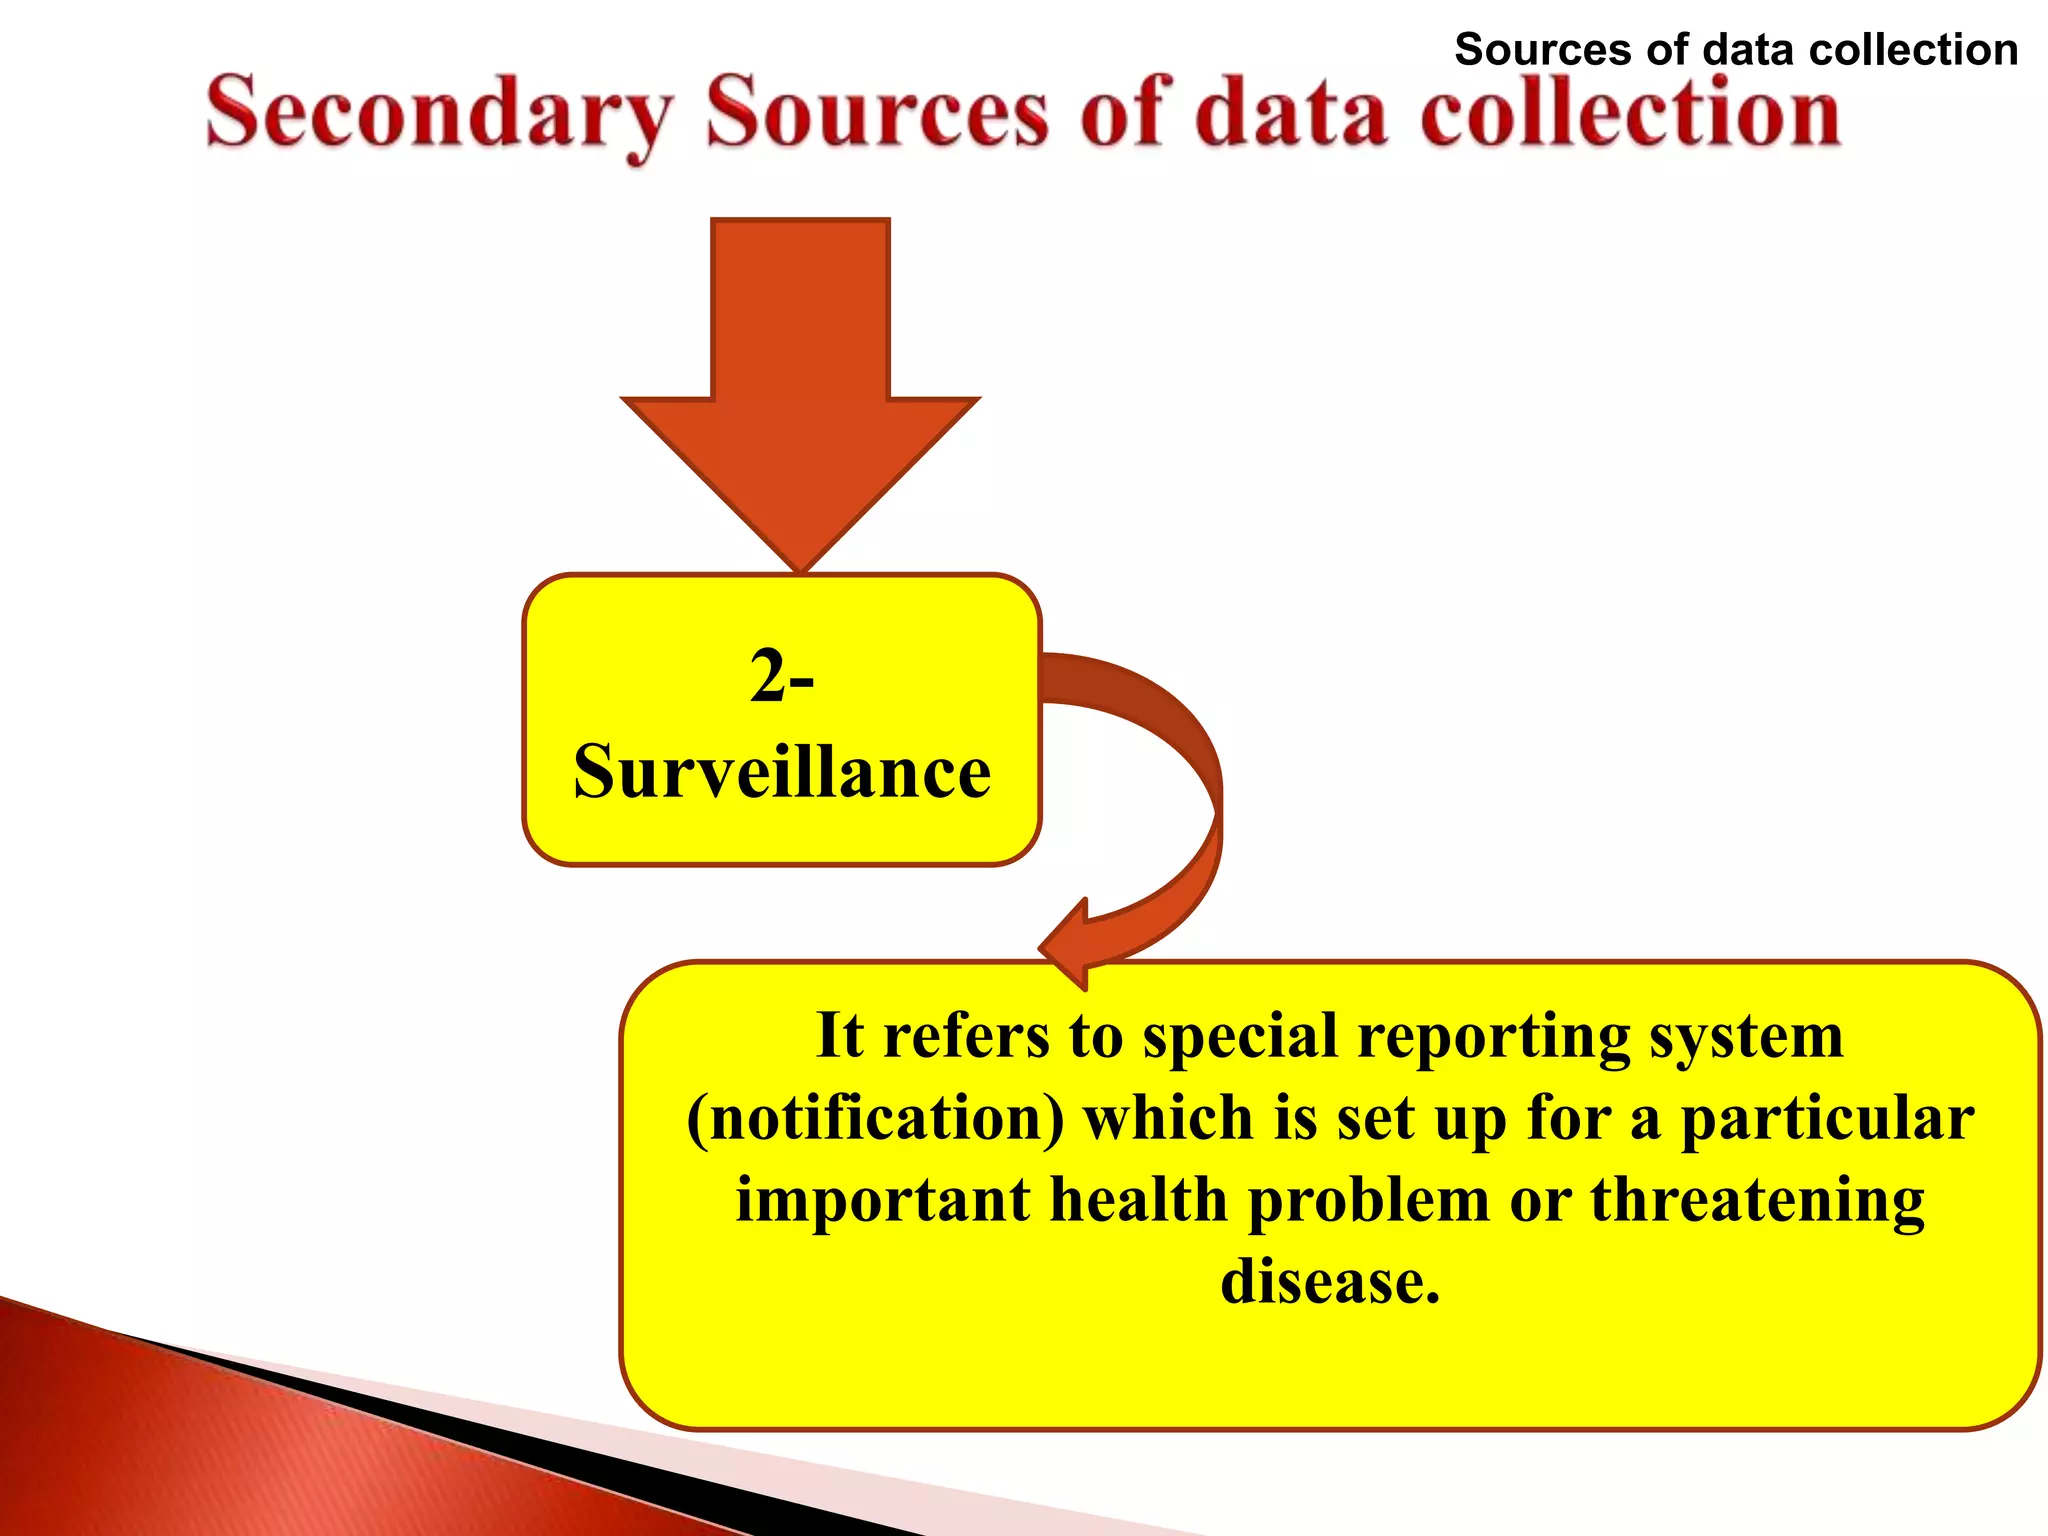
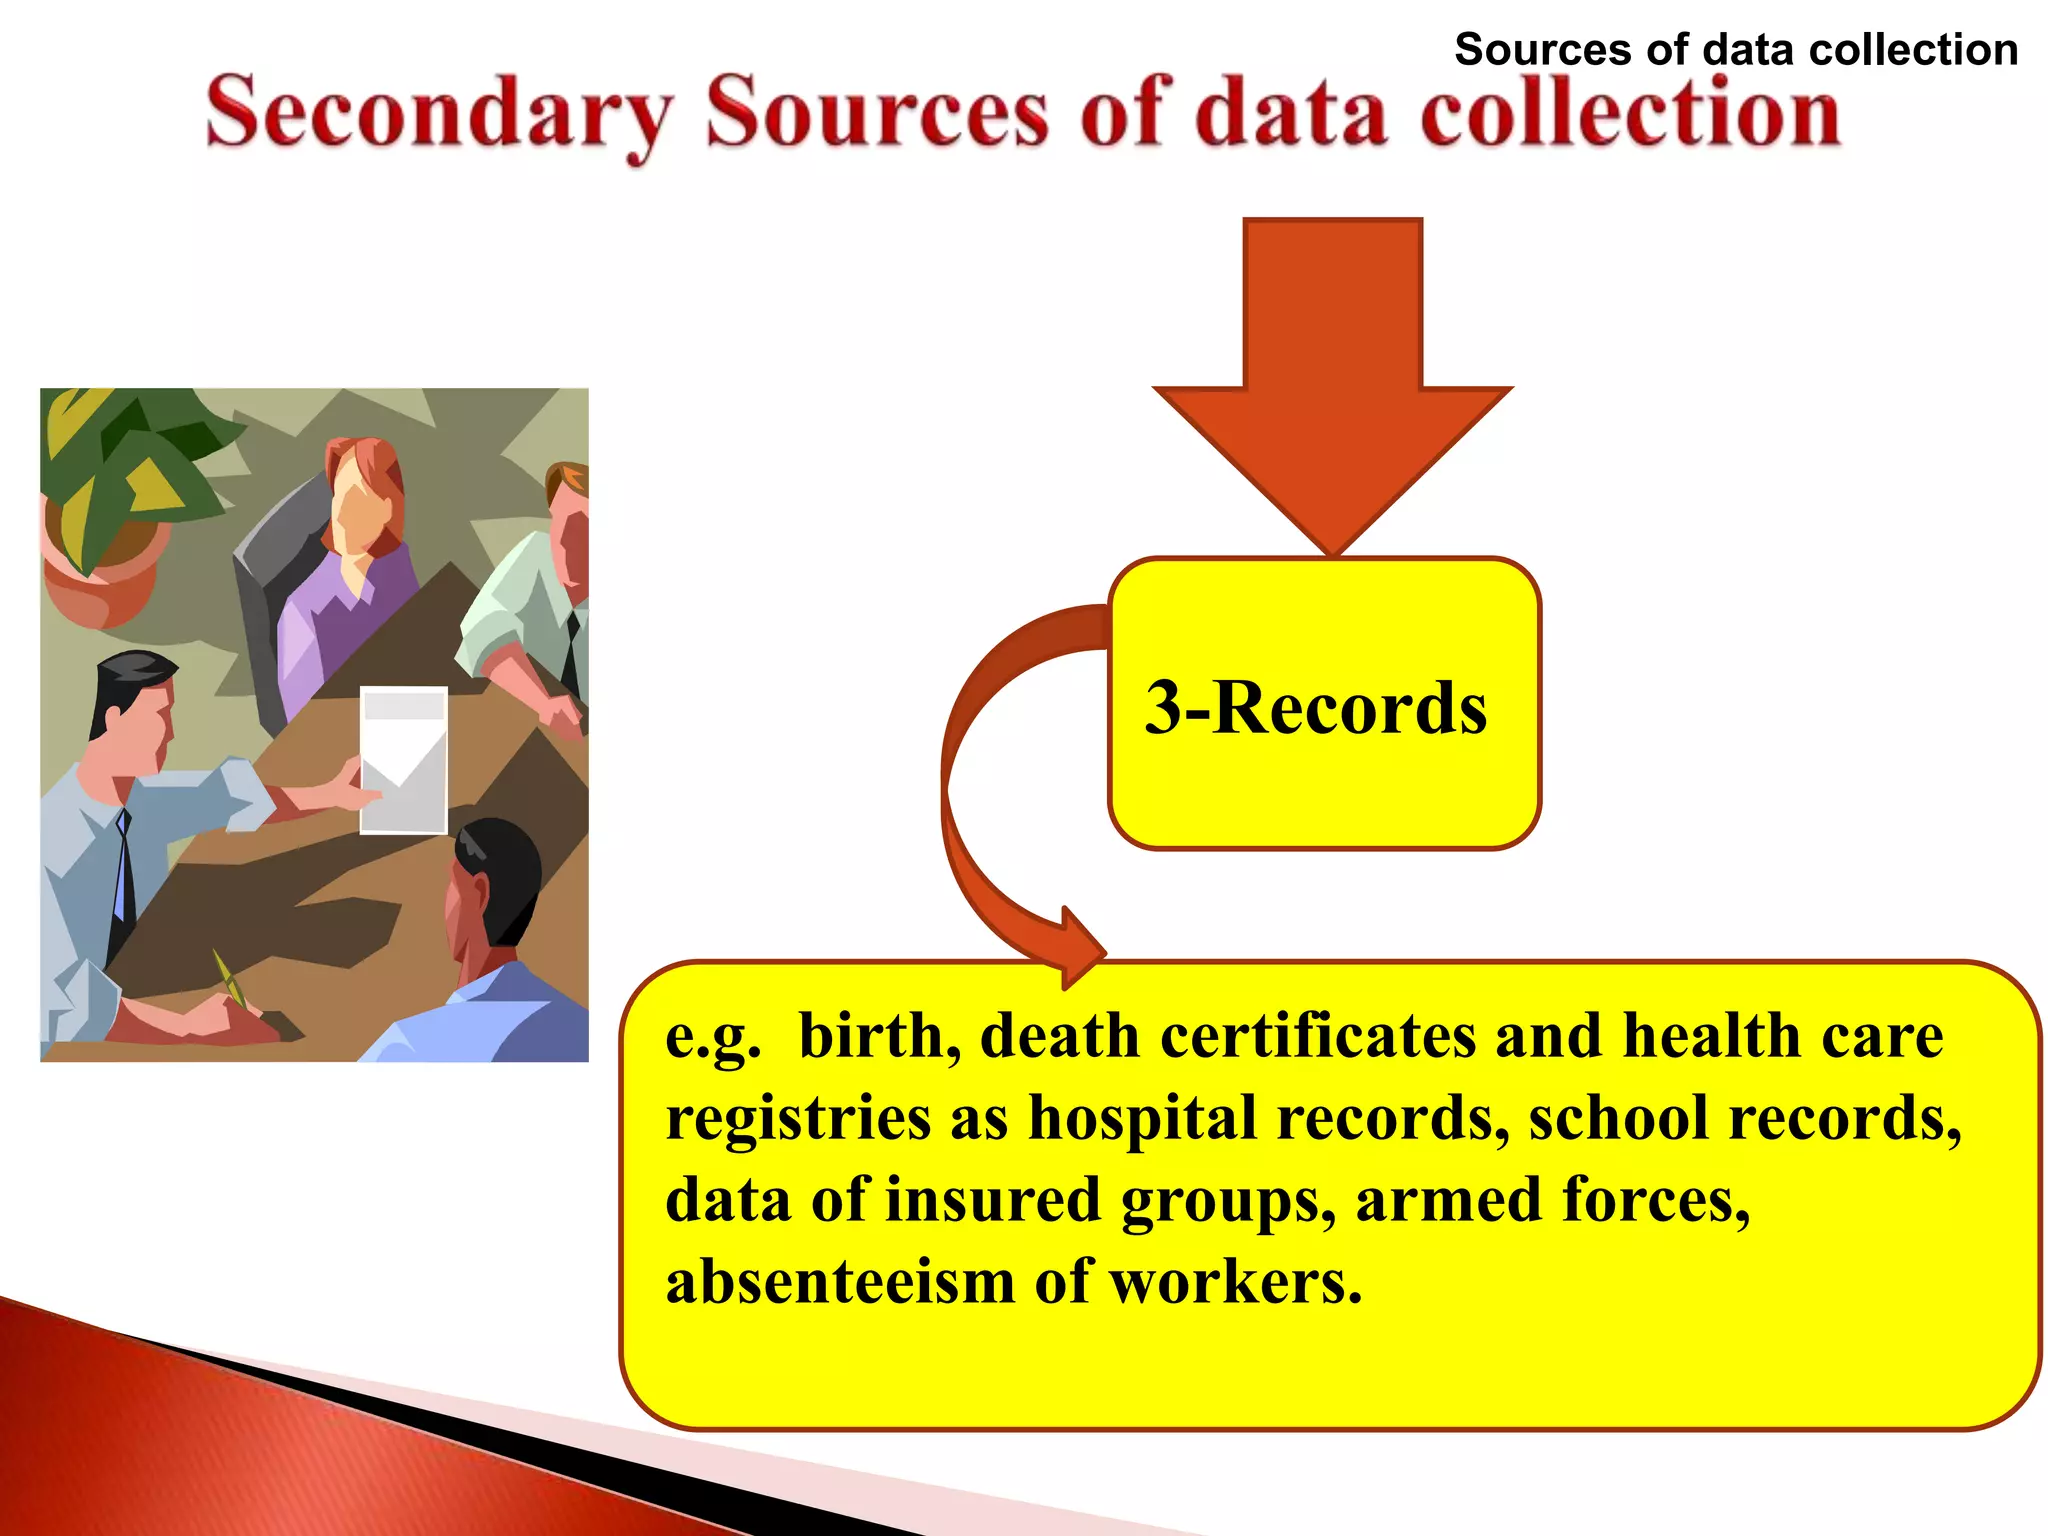
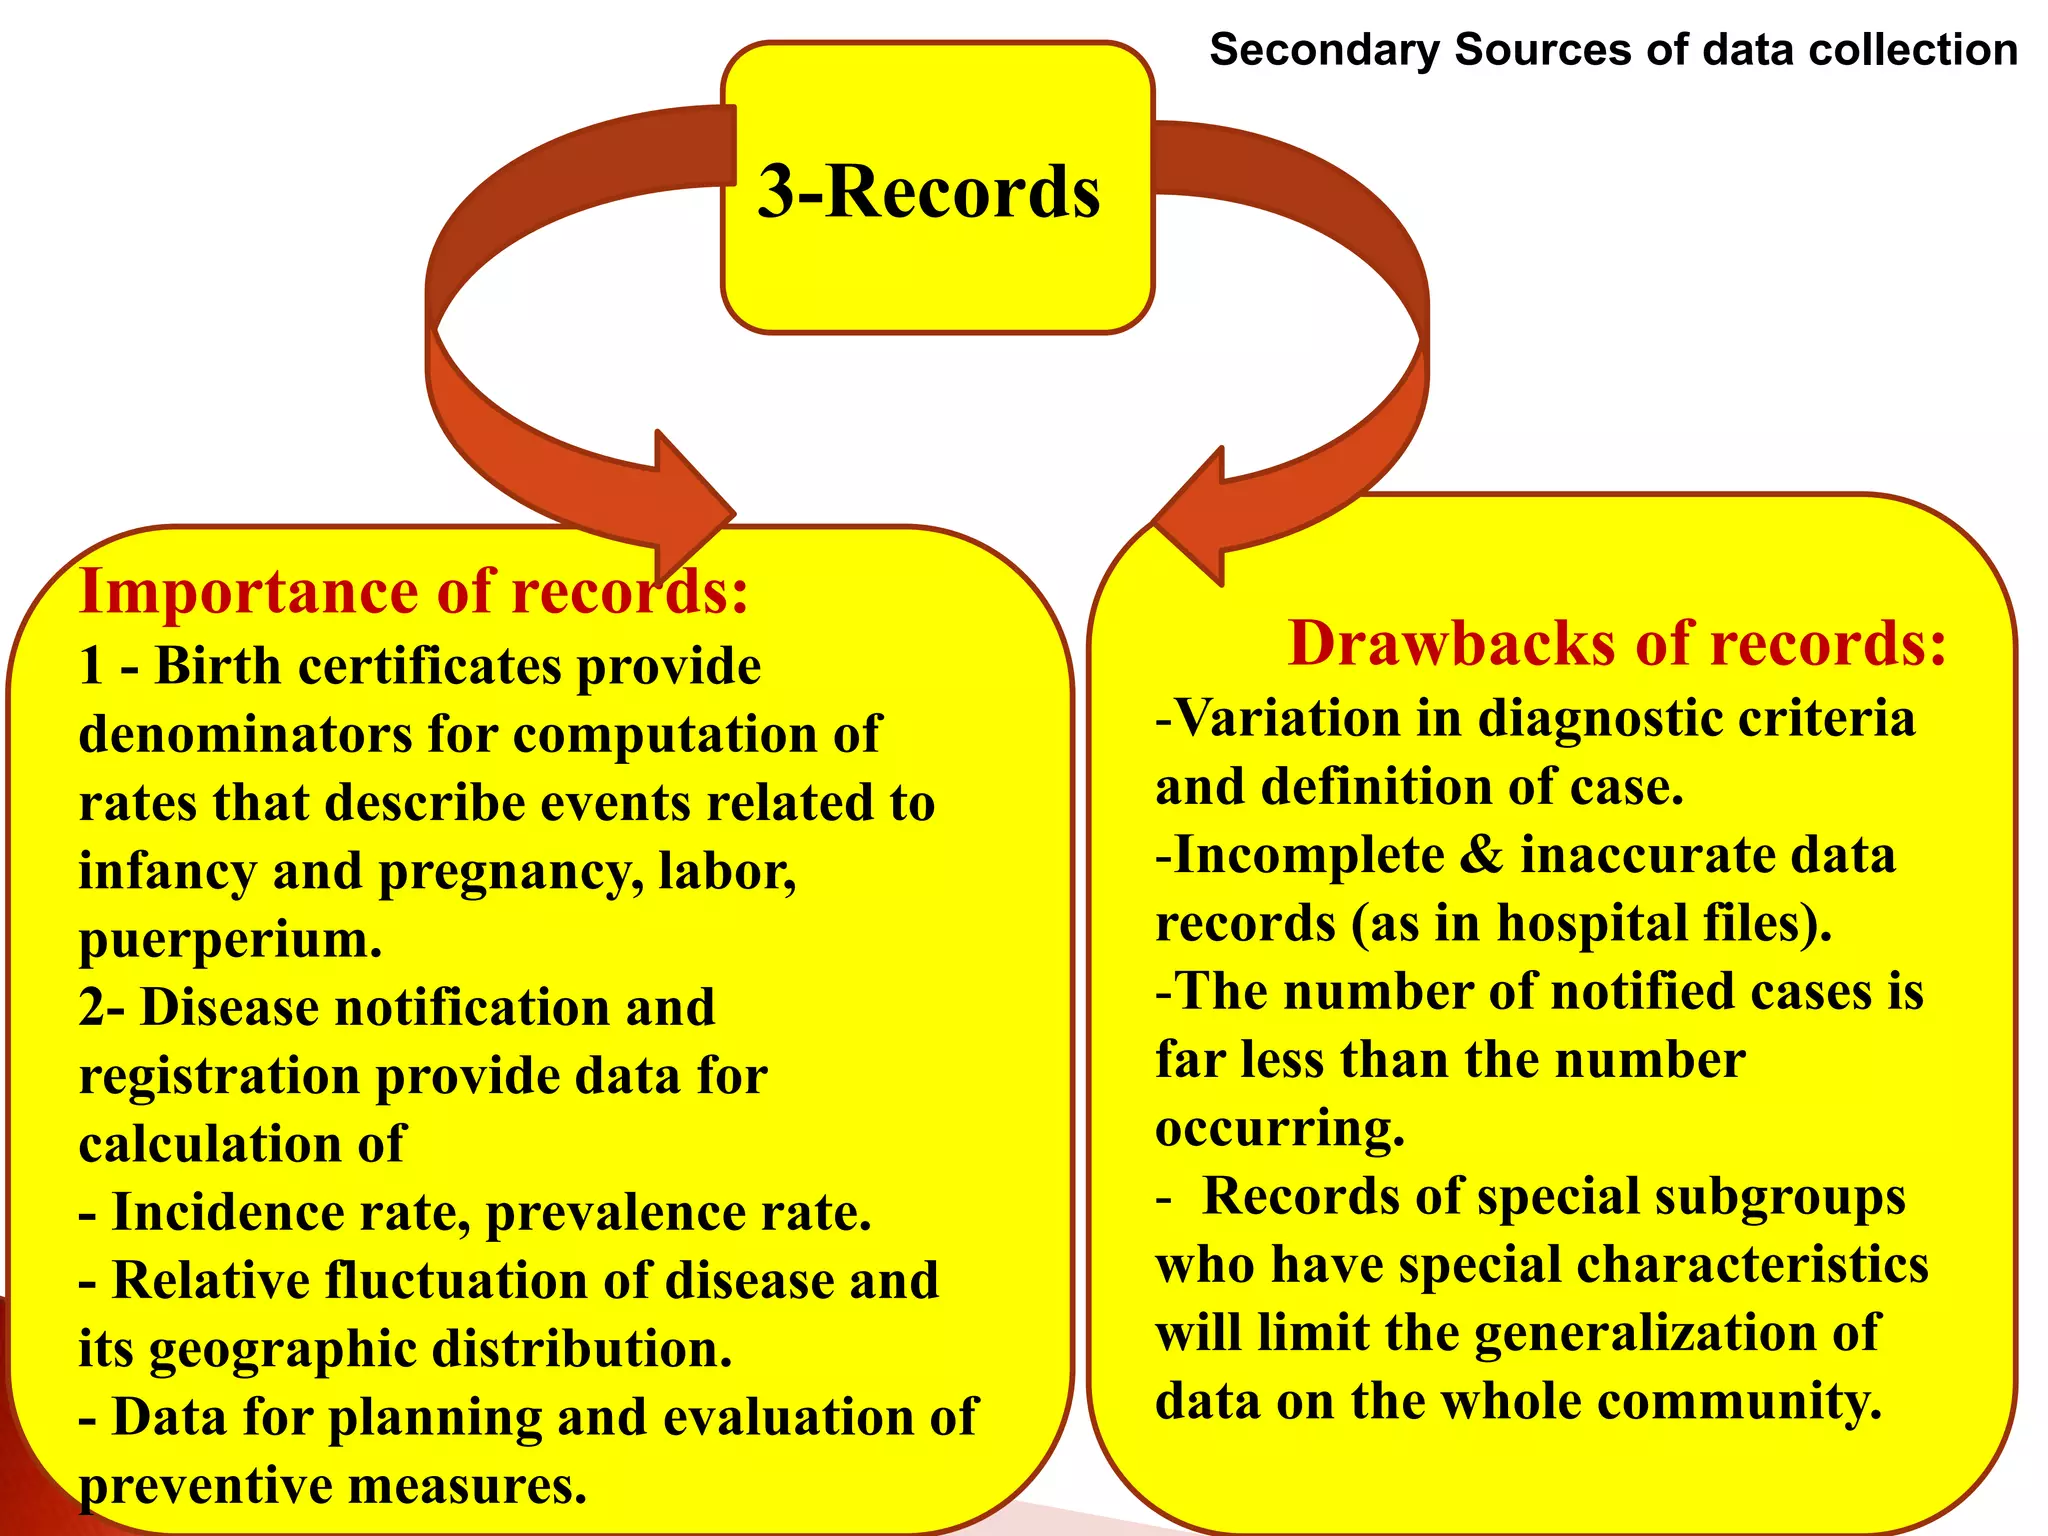
Categorize data sources for vital statistics
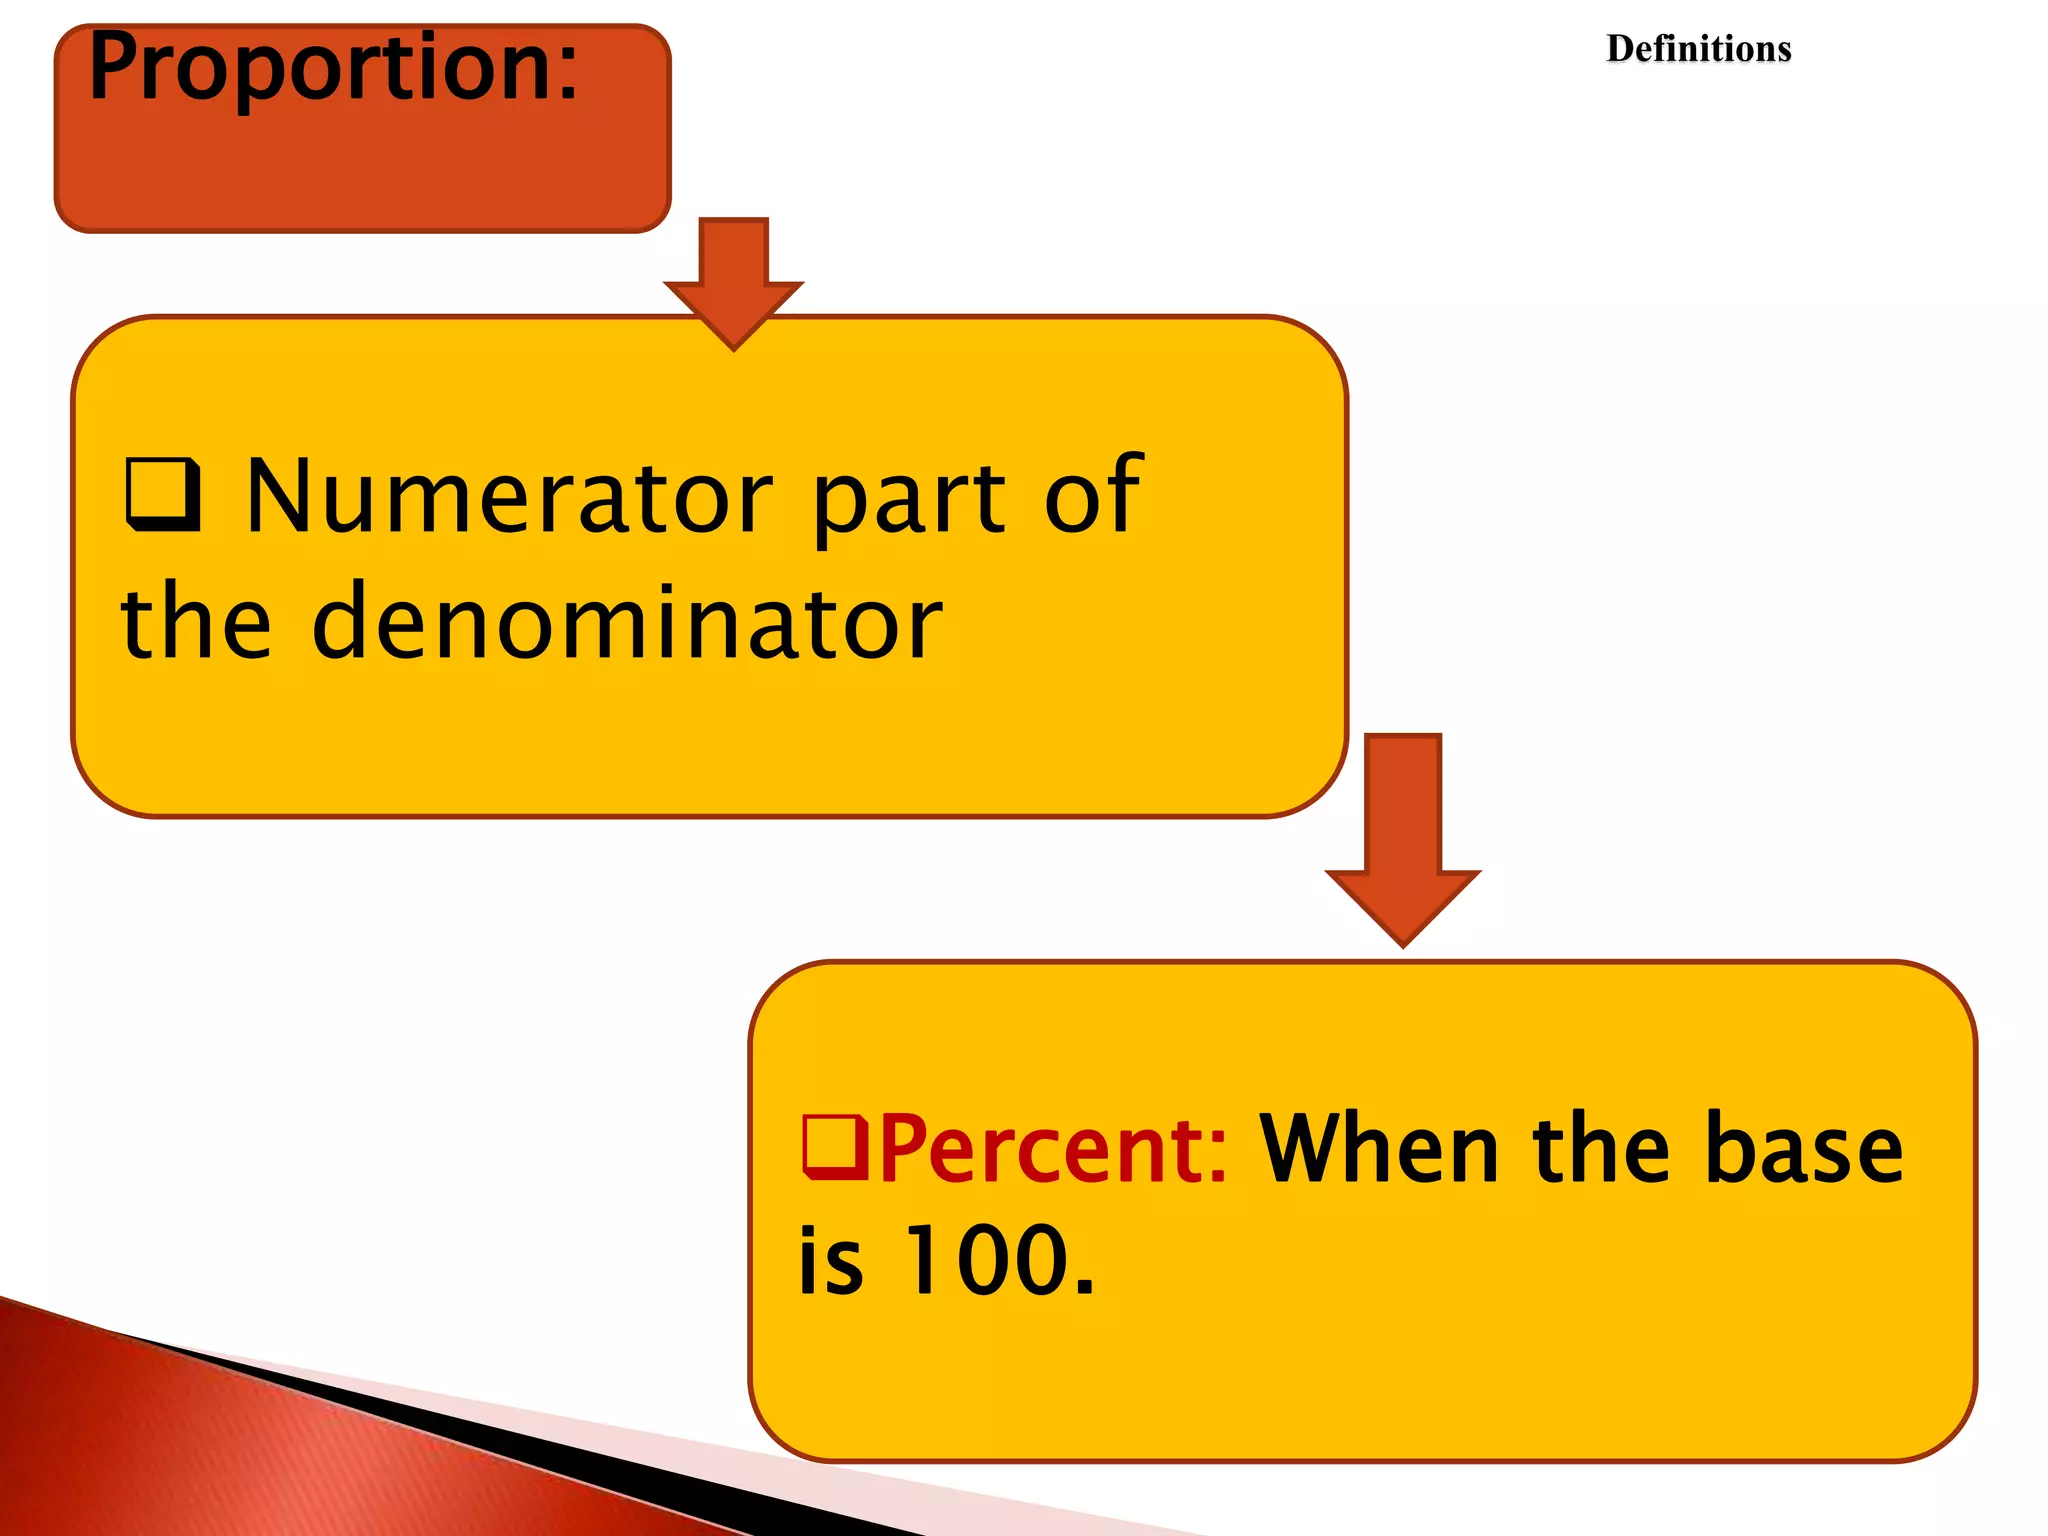
Differentiate between proportion, ratio, and rate.
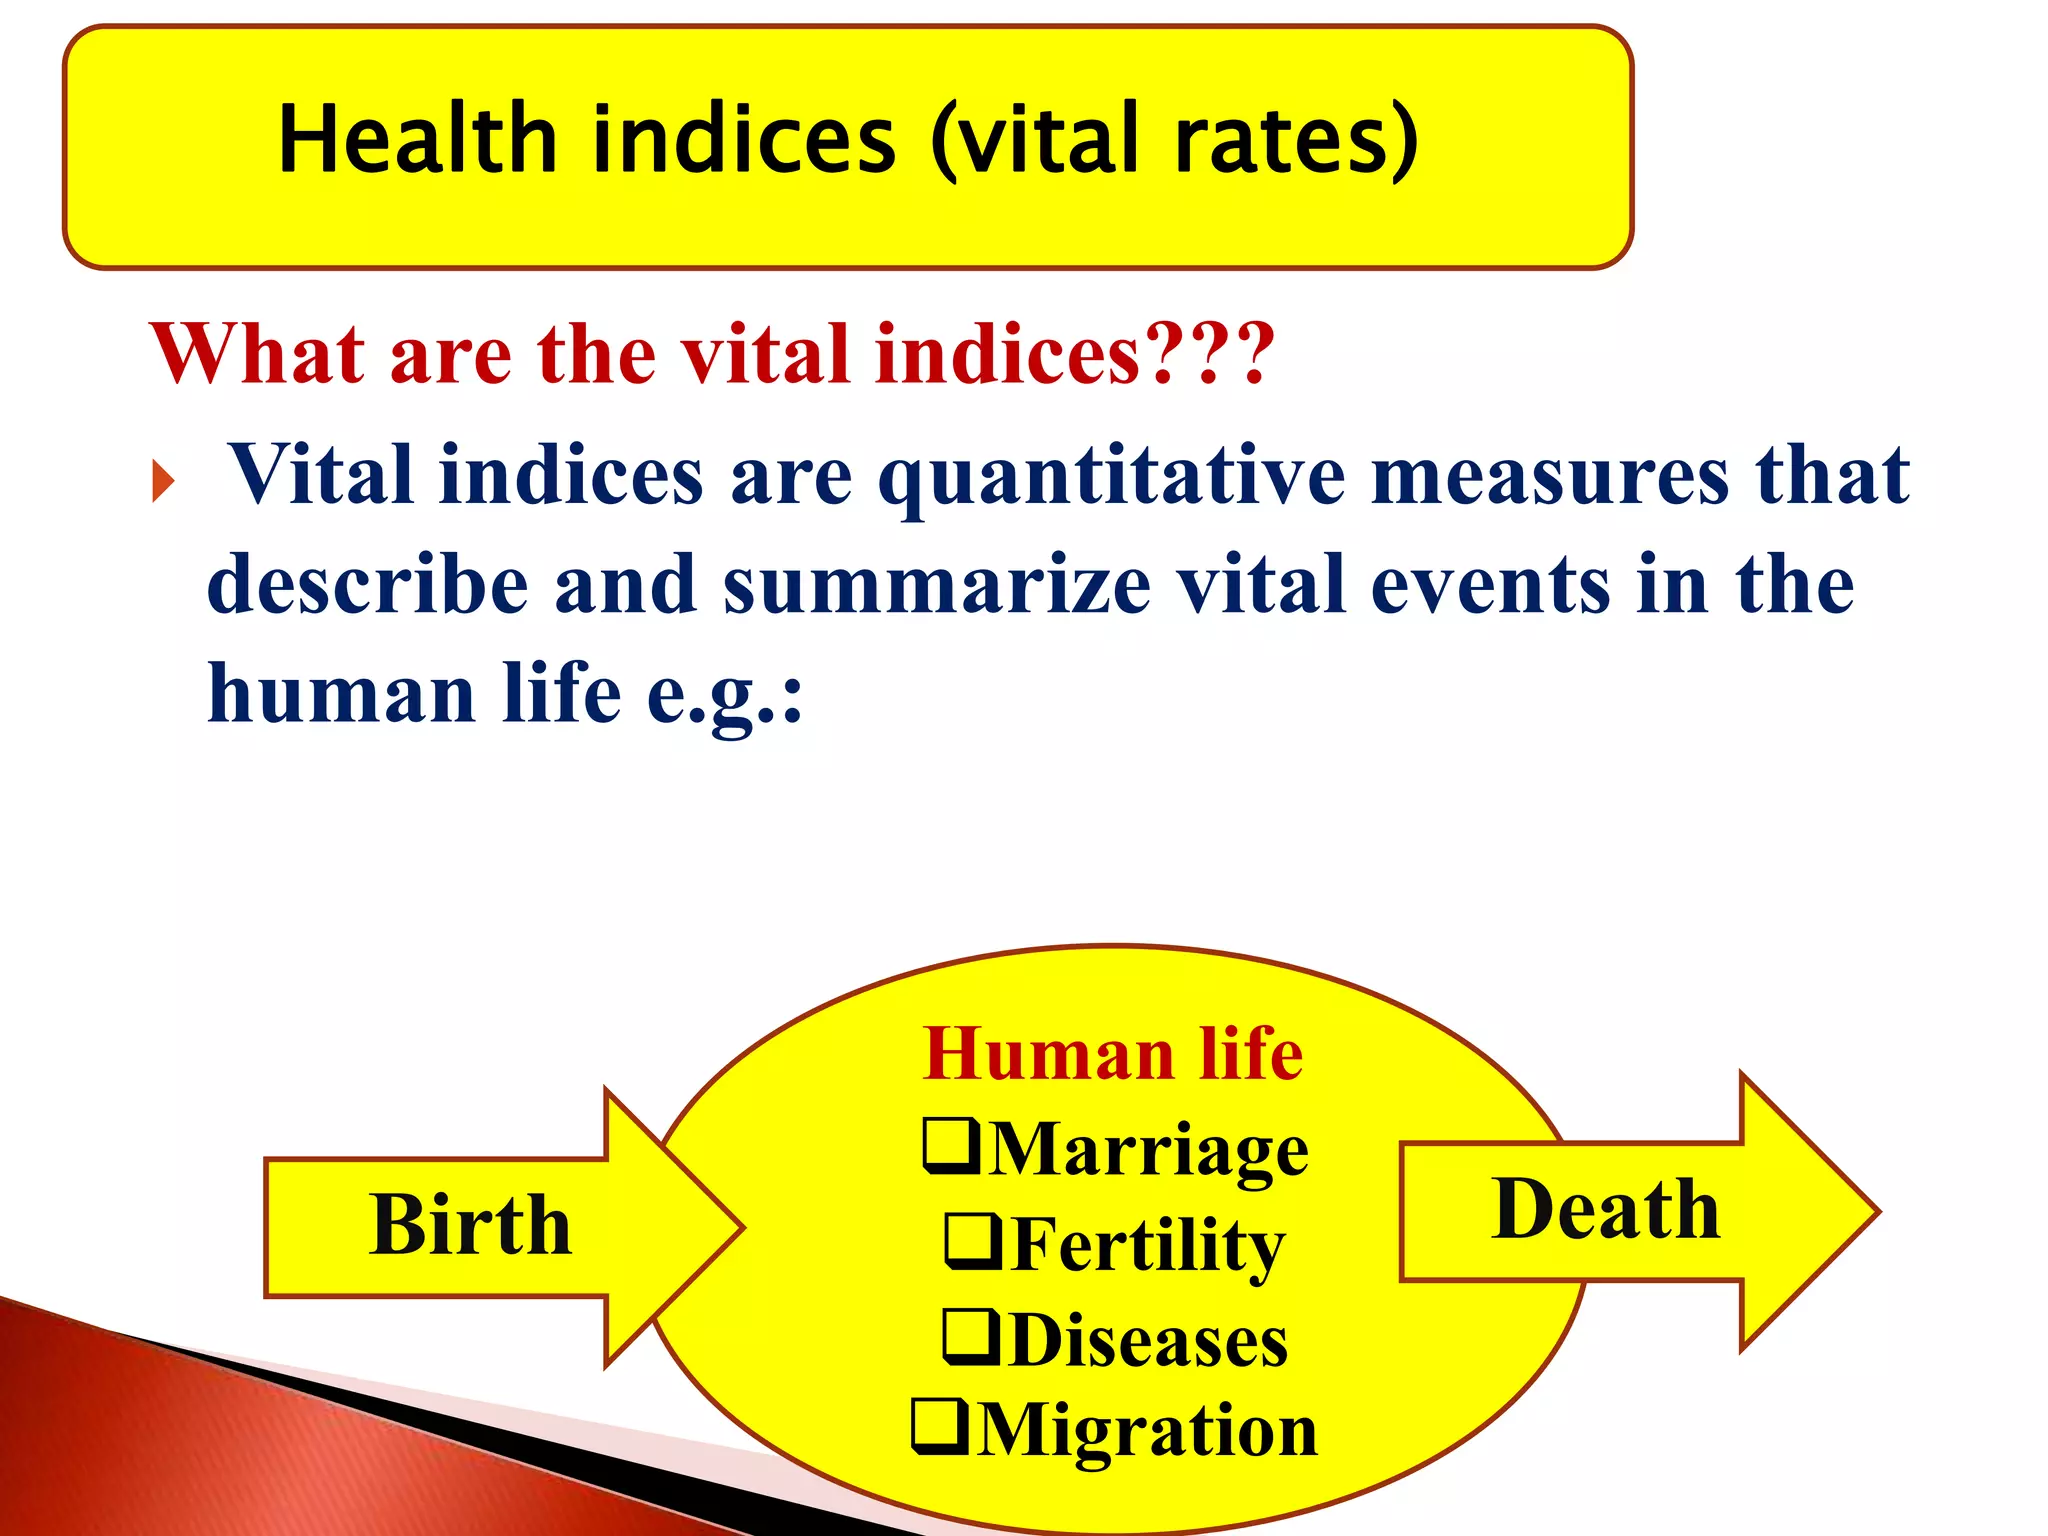
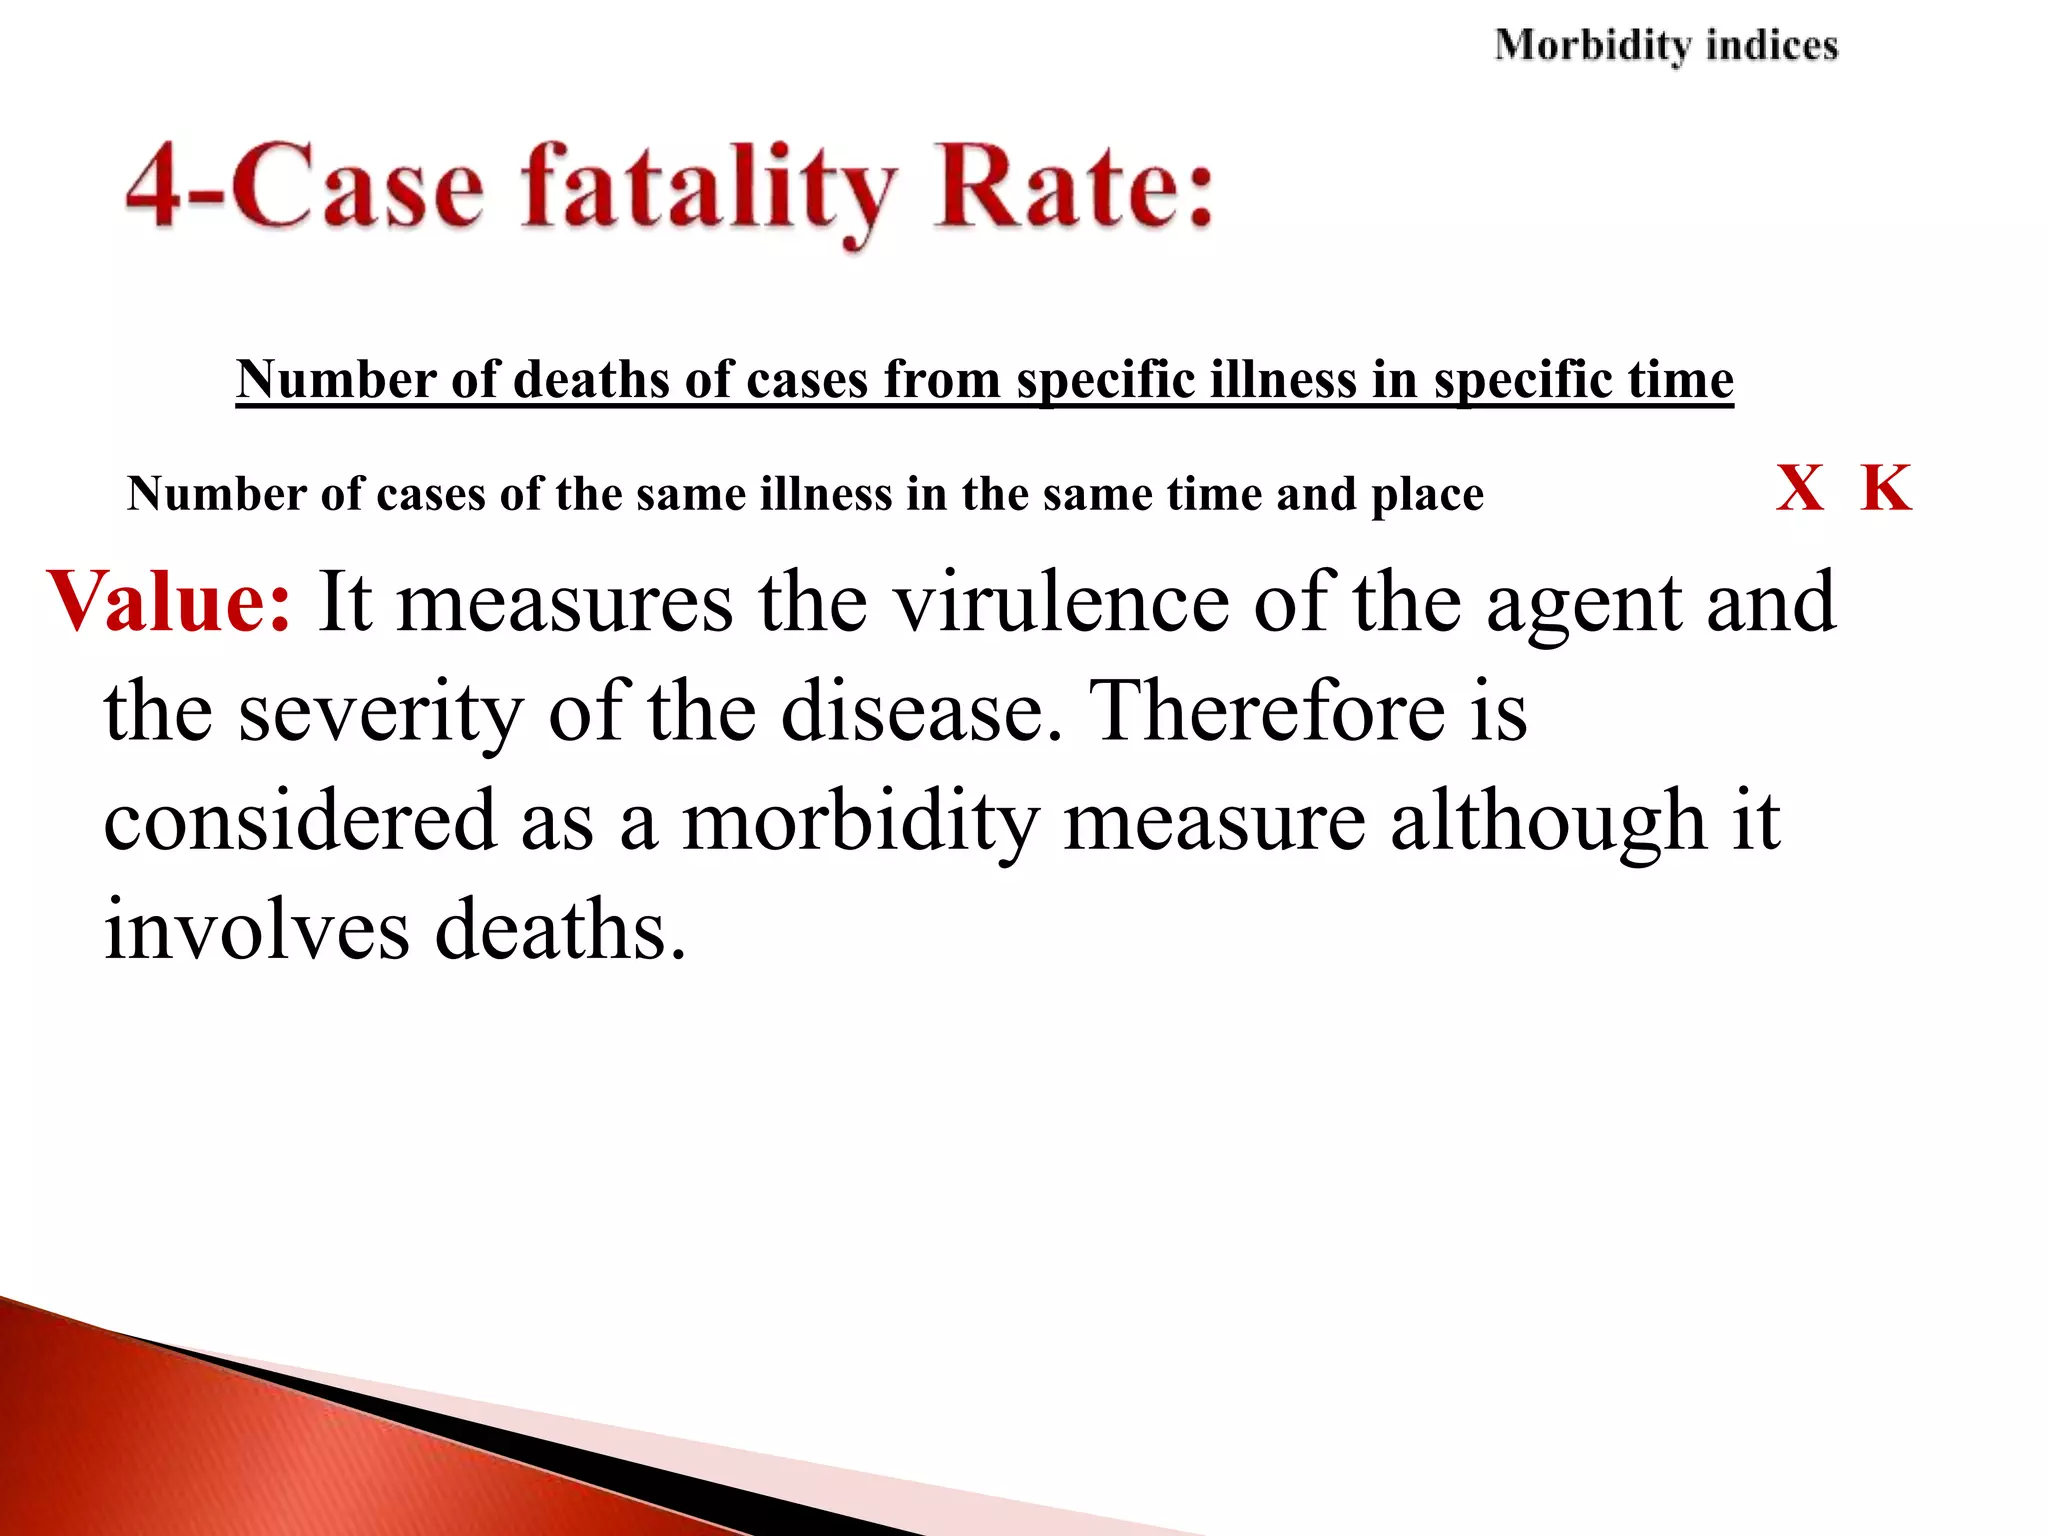
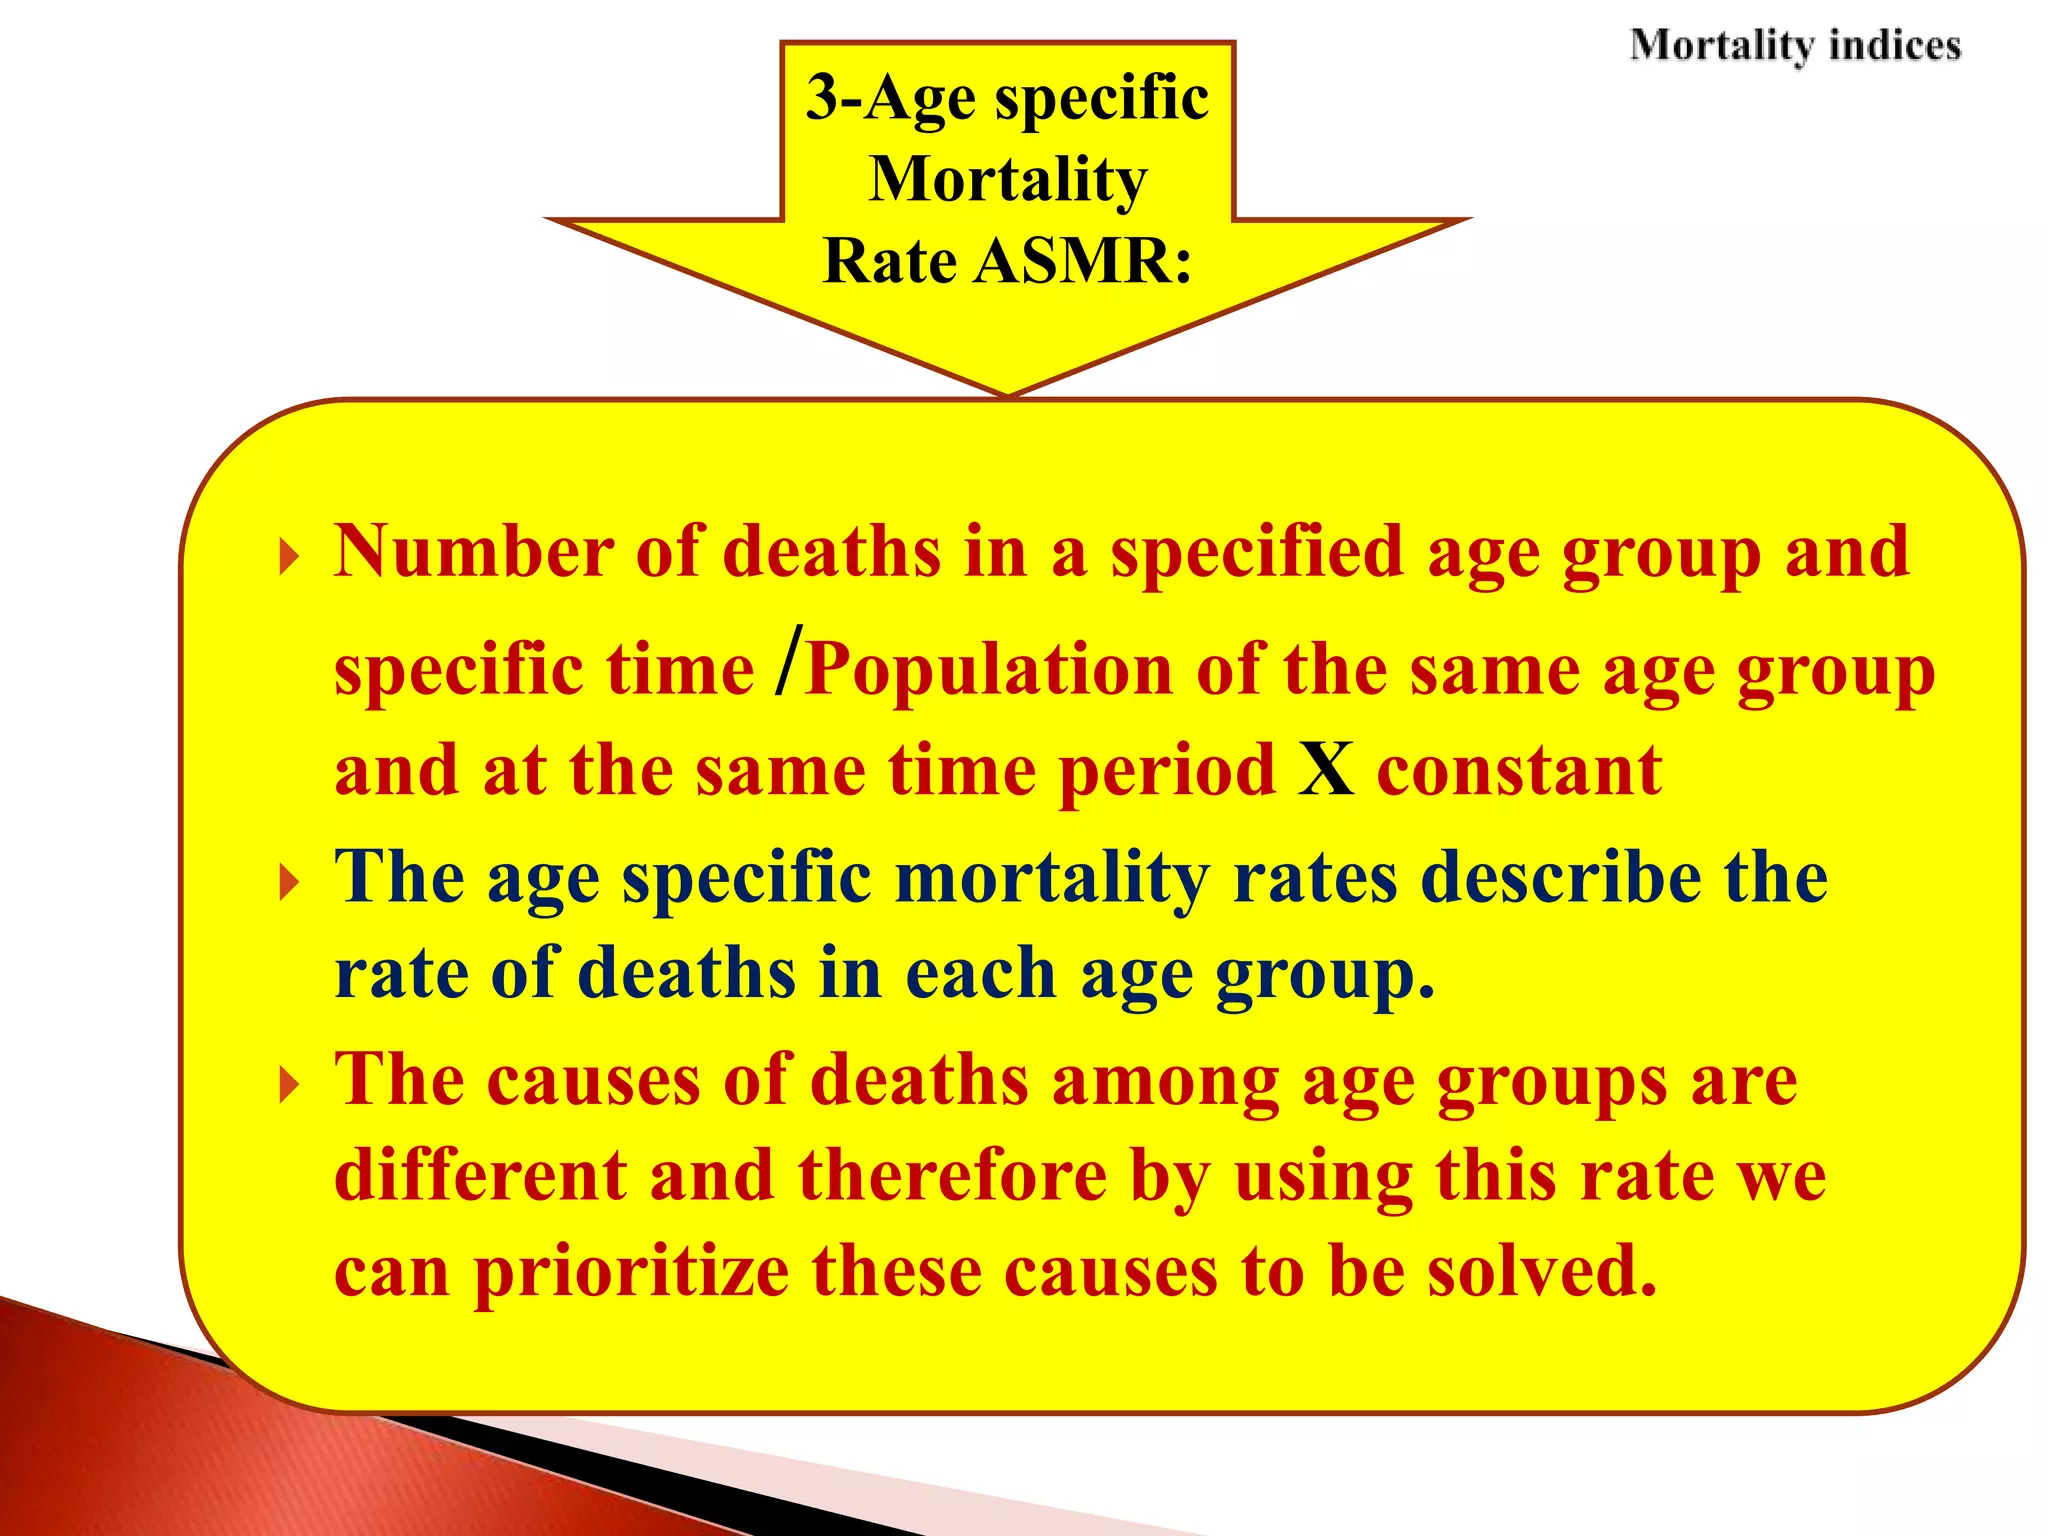
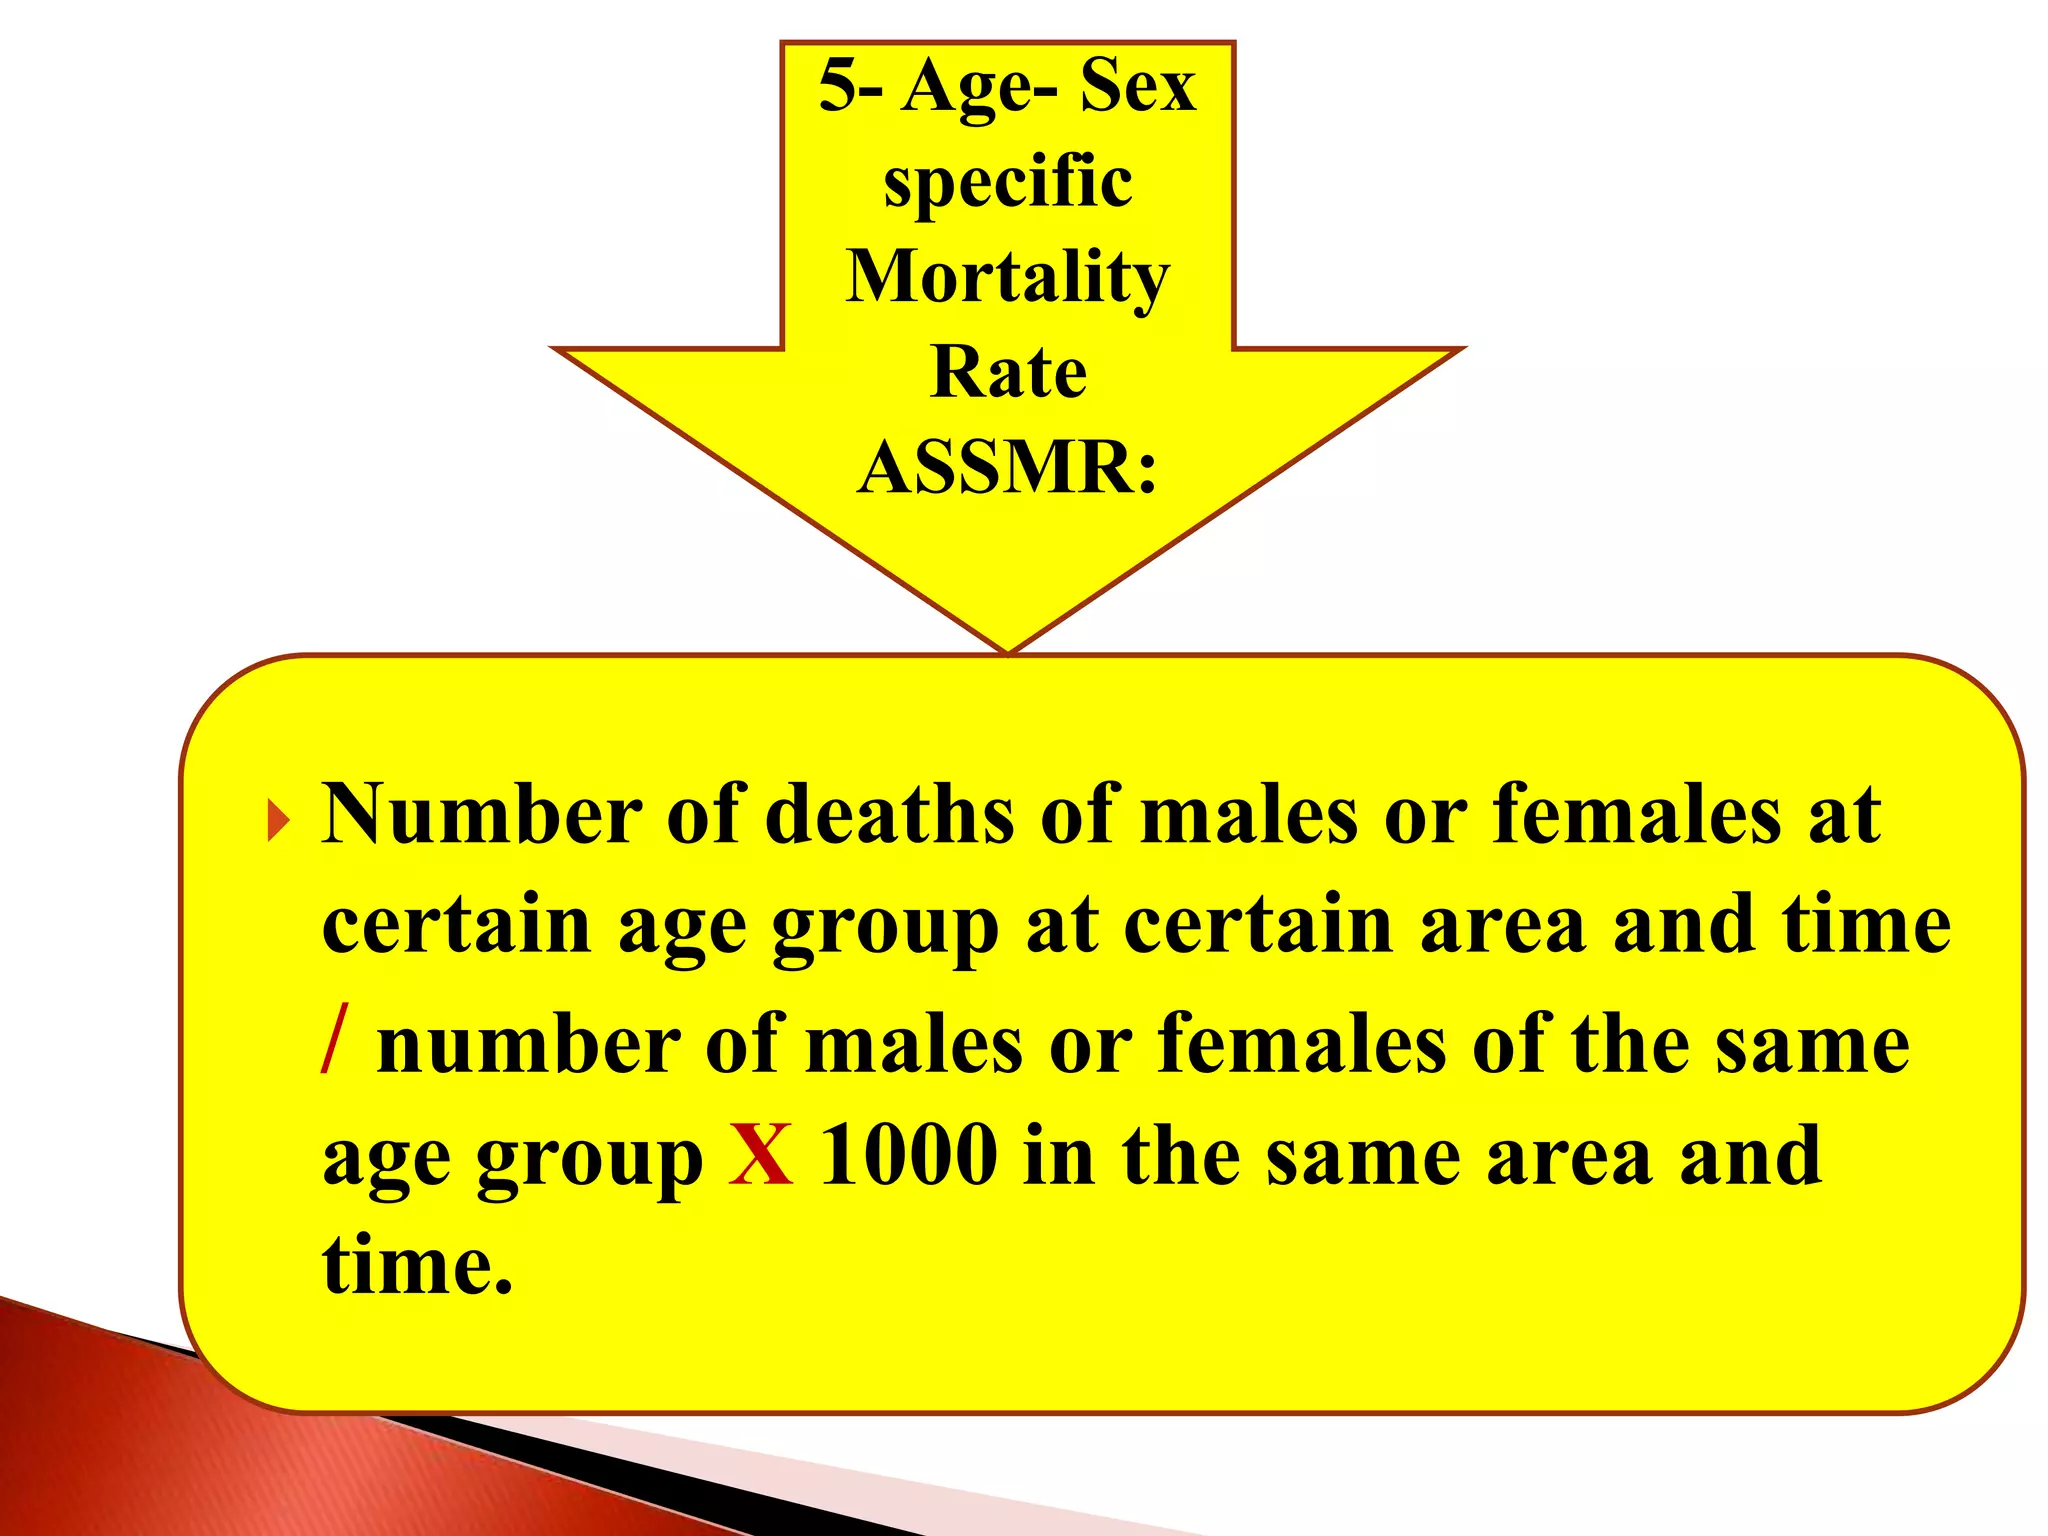
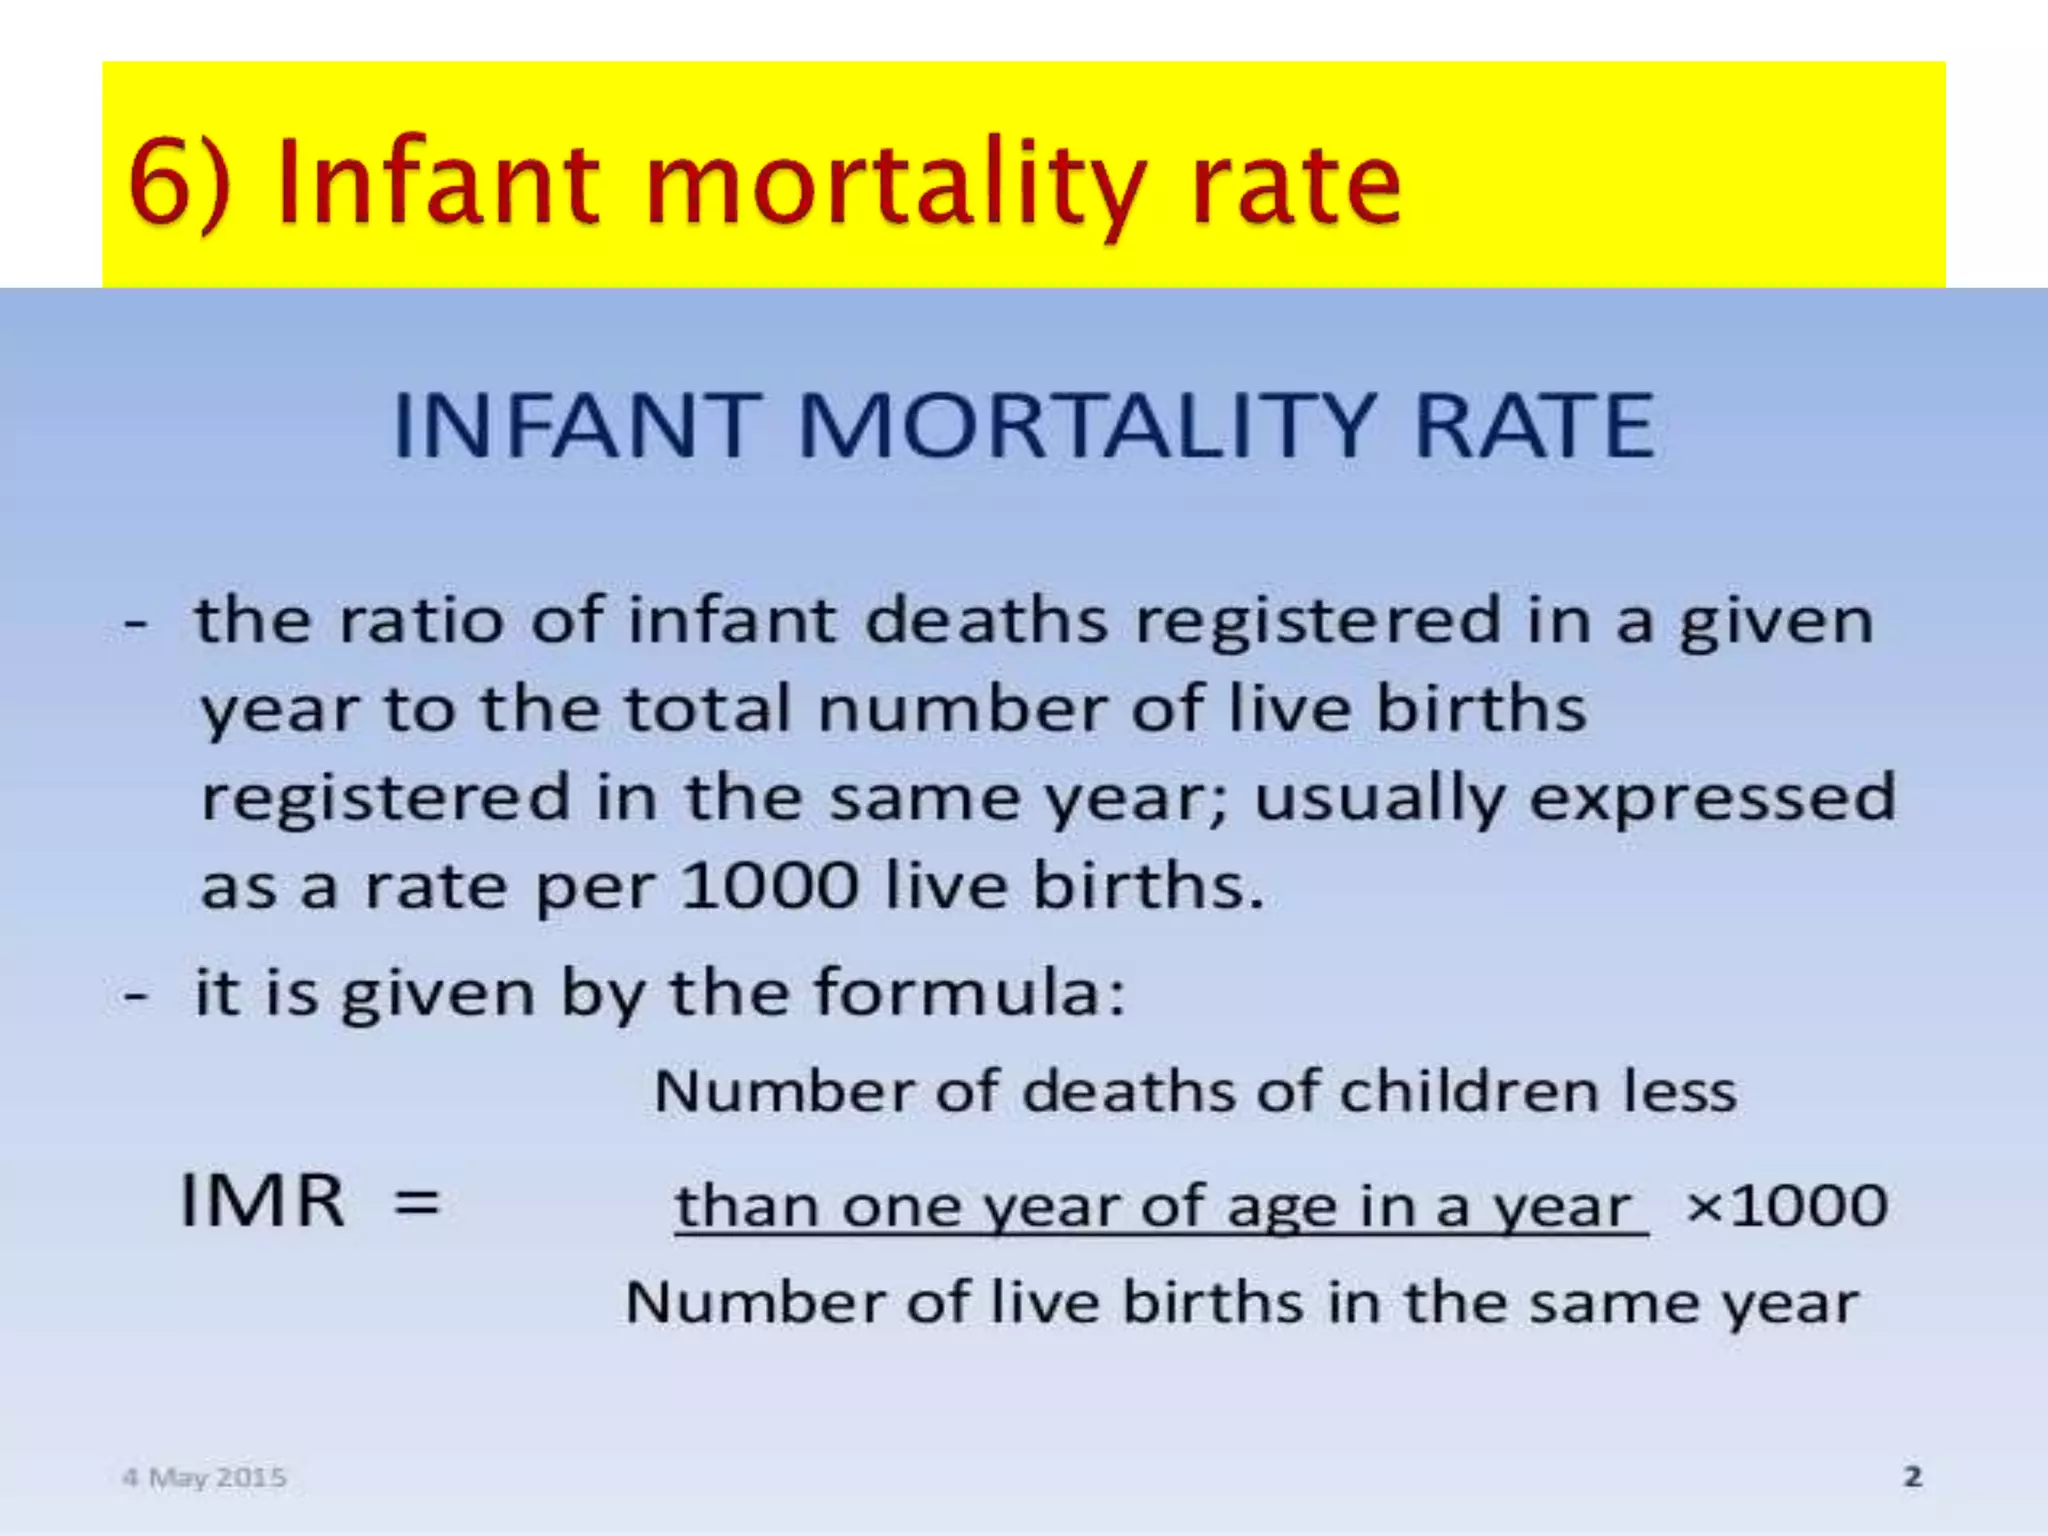
Calculate Vital indices [fertility - birth, morbidity
(disease) –death (mortality)].
Recognize the relationship between MDGS & vital
indices
3. 3
Demography
It is the study of population
characteristics, size or number,
structure, geographical distribution as
well as the changes of these
determinants over time.
4. It is very important to public health as
it provides:
The number of population to be
covered by health services,
The amount of vaccines or drugs
needed every year,
The characteristics of population in
different geographical areas that can affect
health,
Data necessary to calculate health
indicators (used in comparison, planning,
evaluation and prediction of community
health services and programs)
Value of
demography
6. I-Population census
Def. To enumerate people in certain area (country)
at certain time
It collects data about:
the number of population,
characteristics as age, sex, and socio-economic data as
income, crowdness index, occupation, education level
etc..
Census is done every 10 years since it is time, effort and
cost consuming.
Mid-year population is the number of population
calculated from census at the 1st of July (it was chosen
as a standard for any census).
7. I-Population census
What is Importance of census:
Calculate the actual number of population living in
that country at the year of census.
For planning for future health care programs.
Provides general characteristics of the population used
in comparison over periods of time, or comparison with
other foreign populations.
To estimate population in years between censuses.
Calculate vital statistical rates.
8. I-Population census
Drawbacks of census:
Expensive, needs time, money, personnel. As it needs long time in
data collection and analysis the results will be irrelevant i.e census
is done in 2006 and results announces in 2010.
Data may be inaccurate: People tend to round their age because
they do not know their birthday exactly. People hide their real
income and others hide the actual number of children they have.
There are some areas where people are moving . They are missed
or under-estimated.
Lack of co-operation between people and census data collectors.
Data collectors may fill questionnaire by themselves when houses
are empty.
11. if we need to estimate population number at 1994
we deduce population census at 1990 from that at
2000 (difference between 2 subsequent censuses)
then divide that difference by 10 (to find the
annual increase of population) multiply this
annual increase by 4 to get the increase in 4
years.
Add the result to population number in census
1990 to get population number in 1994. This
method presume that population increase yearly
with the same amount which is not true.
Inter-census population
12. Census
1990 = 60 millions
2000 = 80 millions
1994 ?
Census 2000 - census 1990
80 - 60 = 20 millions
Annual increase of pop.= 20 / 10 = 2 millions
Pop. Increase in 4 years = 2 x 4 = 8 millions
Pop. Number in 1994 =
8 + 60 (pop. 1990) = 68 millions
13. is the difference between crude birth rate
and crude death rate which is considered as
the number of population added per year.
Multiply this increase by the number of
years (e.g.4 for 1994) then added to the
census of 1990 (as the previous example).
This method neglects the migration factor
that can increase/decrease population
number whether to or from the country.
Inter-census population
14. RNI = crude Birth rate - crude death rate =
number of pop. Added / year (Annual increase of pop.)
Pop. Increase in 4 years = x 4 = ---- millions
Pop. Number in 1994 =
Pop. No. in 4 years + 60 (pop. 1990) = 68 millions
------------------------
Crude Birth rate = No. of live births / mid year pop. X 1000
1994?
15. It equals (crude birth rate + immigrants to
the country) minus (crude death rate +
emigrants outside).
Then estimated population is calculated in
arithmetic way as previous.
Inter-census population
16. By plotting a straight line connecting
population numbers in all previous censuses
(x-axis represents years of censuses) and (y-
axis represents population number in million).
We can know from that graph the estimated
population number in years between 2
censuses
also we can predict the number of population
in the future by extending the line.
Inter-census population
18. It is calculated by certain equation that
depends on the last two population
censuses, the number of years in between
censuses and the annual rate of increase.
This method assumes that population
growth is not linear (or steady every year).
Inter-census population
19.
20. 1- The census of Egypt in 1996 was 60 millions,
while in the year 2006 was 75 millions.
Calculate the expected population number in
the year 1998 and 2004 by two different
methods.
21. 1-Arithmatic method:
Census2006 – census 1996 =75-60=15
million
Annual increase= 15milion/10years=
1.5million
Census at the year 1998=60+2X1.5=63
million
Census at the 2004=75-2X1.5=72
million
2-Graphic method:
24. II-Population growth
pattern
Changing population growth pattern (transition)
is mainly affected by:
births, deaths, migration (in some countries it is
an important factor) and life expectancy.
The process of a change in society’s populations
from a condition of high birth rate and death
rate and low RNI to a condition of low birth
rate and death rate and low RNI and even to
negative growth (can be described by 5 stages).
25. More healthcare/education/empowered women
Amazon
population
Ethiopia India UK Germany
Birth rate High and
fluctuating
High and
steady
Rapidly
decreasing
Low and
fluctuating
Slowly
falling
Death rate High and
fluctuating
Rapidly
falling
Slowly
falling
Low and
fluctuating
Low and
fluctuating
Population
growth rate
Zero Very high High Zero Negative
Population
size
Low and
steady
Rapidly
increasing
Increasing High and
steady
Slowly
falling
26. Life expectancy:
is the average number of years that can be expected to
be lived by any individual at certain age.
Life expectancy is directly proportional to country
development, socio-economic level, health services
standard, use of new technology, good nutrition, healthy
environment, literacy etc.
In developed countries the life expectancy of new
borne is 85 years while in under developed countries it
reaches 40 years.
In Egypt, life expectancy at birth (72.7 years) 2016
(Males 71.4 years) (Females 74.2 years)
II-Population growth
pattern
28. III-Population pyramid
It is a graphical presentation of population by age
and sex (Histogram).
Vertical axis represents age groups(in five years)
and
the horizontal axis represents percentage of
population of these age groups in relation to sex.
Characteristics of the population pyramid :
29. Base of the pyramid represents the birth rate.
Height represents the number of years to be lived at
specific age.(life expectancy)
Top represents the percentage of old age groups.
Slope of the pyramid represents the age specific death
rates.
Dependency ratio: is the number of young ages below
15 years old plus the number of old ages over 65(who
are dependents) per 100 persons from 15 to 64(who
are independent).
Percentage of males and females at each age group.
30. Total Dependency ratio: is the number of young ages
below 15 years old plus the number of old ages over
65(who are dependents) per 100 persons from 15 to
64(who are independent). In Egypt = 62.3% (2016)
Youth dependency ratio: is the number of young ages
below 15 years old per 100 persons from 15 to 64(who
are independent). In Egypt = 53.8% (2016)
Elderly dependency ratio: is the number of elderly
people > 65 years old per 100 persons from 15 to
64(who are independent). In Egypt = 8.5% (2016)
32. 1- Birth rate
2-
Life
expectancy
3- Old age group
5- Dependency ratio=
No of dependents/
No. independents
6- Percentage of males
and females at
each age group
Characheristics
41. It follows the expansive type of model, where:
1. The base is wide due to high birth rate,
2. Tapers rapidly due to high specific death rates
especially 0 to 5 years,
3. The top is narrow due to low proportion of
elderly.
4. The height is short due to short life expectancy.
Population pyramid
42. it shows an expansive type (stage 2), where:
1. The base is less than that of the 1950 due to
decrease in birth rate.
2. Fertility decline is evident by that the
proportion in the age period 0-4 and 5-9 are less
than that in the period 10-14
3. More decrease in the different age specific death
rates,
4. Life expectancy has increased
5. Old age group increased.
Population pyramid
43. It is expected to be of a Stationary type, where:
1. The different age group proportion will be
almost equal due to almost equal birth and
death rates
2. There a slow tapering at old age due to
expected low age specific death rates. More
flat top due to expected increase in elderly
sector.
3. Longer life expectancy may reach 80 years.
47. V-Health indicators
What are the values of health indicators?
1- Describing and diagnosis of community health
problems.
2- Comparing different countries at the same time
or changes in a country at different times.
3- Planning of health services and programs.
4- Evaluation of community health services and
programs.
5- Prediction of future health needs of the
community.
48. What are the health indicators used???
(Vital rates): birth, fertility, death, and
morbidity.
Annual economic growth rate
Per capita income
Literacy percentage
Dependency ratio
Life expectancy
IV-Health indicators
49. Health indices (vital rates)
What are the vital indices???
Vital indices are quantitative measures that
describe and summarize vital events in the
human life e.g.:
Human life
Marriage
Fertility
Diseases
Migration
Birth Death
50. Ratio:
The relation between
two unrelated events
e.g. male to female ratio is
1:2.
Black to white ratio is 2:3.
Definitions
52. Rate:
the frequency of an event
in a population in relation to
time
e.g. birth rate means the number of births
occurred in population during a year (or month).
N.B. The rate is usually multiplied by a
constant as 100 or 1000 to get an integer number.
54. A-Crude birth rate (CBR)
CBR= number of live births/ mid year
population X 1000 in a given year and locality.
Advantages: CBR describes the increase in
population over time, simple & easy to know
birth number (birth registries) and population
number at any time (from census),
Disadvantages: it is not specific for comparison
between countries because the denominator is
the whole population. The rate must exclude
men , young girls, unmarried, infertile, and
menopausal women.
55. A-Crude birth rate (CBR)
in Egypt
CBR (1990) = 33.5 births / 1000 population
CBR (2010) = 23 births / 1000 population
CBR (2014) = 27.8 births / 1000 population
CBR (2016) = 30.3 births / 1000 population
56. B-Fertility indices:
Fertility is the reproduction performance
of a population.
Fertility indices include:
1. CBR
2. General Fertility Rate (GFR)
3. Age-Specific Fertility Rate (ASFR)
4. Total Fertility Rate (TFR)
5. Fecundity Rate (FR)
6. Gross Reproduction Rate (GRR)
7. Net Reproduction Rate (NRR)
57. 2-General Fertility Rate (GFR):
GFR=number of live births/number of
women (from15 to 49years) X1000. In the
same locality and year
Since, women in the reproductive age
constitutes about 25 % (1/4) of the
population,
therefore the GFR is considered to be about 4
times the crude birth rate.
B-Fertility indices:
58. 2-General Fertility Rate (GFR):
Advantages: GFR is a more accurate index than the
crude birth rate because:
1. It is related only to females in the reproductive age,
2. It is more suitable for comparison between countries
since it eliminates difference in sex composition
Disadvantages:
1- it doesn’t consider that not all females in the
reproductive age are married and fertile
2-it did not consider the difference in females’ age
distribution in different countries.
B-Fertility indices:
59. B-Fertility indices:
3-Age-Specific Fertility Rate (ASFR):
It is calculated for every five years of the reproductive
age of woman. It is important for differentiating
between fertility behaviors at different age groups.
ASFR (15 - < 20) =Number of live birth borne to
mothers from 15 to 20 years old / number of women of
the same age(15-20 years) X1000. In certain locality
and year
Therefore there are seven ASFRs (every five years) for
all women in reproductive period.
60. B-Fertility indices:
3-Age-Specific Fertility Rate (ASFR):
Advantages: It is a better index than the
general fertility rate as it takes into account
the difference in age distribution of female in
different areas and the degree of fertility in
each age group.
61. B-Fertility indices:
4-Total Fertility Rate (TFR):
It is the number of children that would be
born to a woman if she passes through her
child bearing period following the age
specific fertility rates in a given year and
locality.
TFR in Egypt (2016) = 3.5 children /
woman
62. B-Fertility indices:
The Total fertility rate (TFR ) is
calculated as:
TFR = ∑ ASFR (for single year
age groups)
TFR = 5 ∑ ASFR (for 5-year age
groups)
63. TFR Calculation (Practical example)
Estimate of the average annual TFR for all
women aged 15-49, Egypt, 1997-2000.
TFR= 5 (.051 + .196 + .208 + .147 +
.075 + .024 +.004) = 3.53
Where: the figures in parentheses are
age-specific rates for the 15-19, 20-
24, ... , 45-49 age categories,
respectively.
64. B-Fertility indices:
5-Fecundity Rate (FR):
It is the number of live births born per
thousand married women in a certain locality
and year.
Advantages: It is better index than the general
fertility rate as it includes only married
women.
65. B-Fertility indices:
6-Gross Reproduction Rate (GRR):
The GRR includes only born females, (expected to be
future mothers) per 1000 women in the childbearing
period.
GRR = Total Fertility Rate X Proportion of females in
relation to total birth.
In Egypt, it is estimated to be 1.5, which means that
every woman will give birth to 1 to 2 women during
her childbearing period.
Disadvantages: it did not consider the possibility of
death of women during their child bearing period.
66. B-Fertility indices:
7-Net Reproduction Rate (NRR):
It takes into consideration the deaths of women
during their child bearing period using life tables of
females.
NRR = Gross Reproduction Rate X Life expectancy
of females during childbearing period from life
tables.
Advantages: It is the best measure of fertility.
67. 1-Age and sex structure of the population:
The larger the number of women in the childbearing
period in a certain population the higher is the fertility
level in such population.
2-Age of marriage: The younger the age of marriage the
higher is the fertility.
3-Socioeconomic conditions: Higher economic status,
higher status of women and higher level of education are
associated with low fertility rates.
68. 4 -Fecundity: The physiological capability of
couples to reproduce it is affected by their health
conditions.
5- Fertility Motives:
Fertility motives are the reasons that motivate a
couple to increase or decrease the number of
children they will have. Several motivations
explain such attitude:
69. 1- Economic motives: If the children are becoming a source of
income to the family, this will lead to the desire of family to have a
large number of children.
2-Health motives: The high infant and preschool death rates lead to
worry of the family of loosing their children; therefore they
compensate for these expected losses by having more children;
3-Cultural and religious motives:
- Traditions and community believes to have large family since this is
considered as a source of power and social status.
- Some wives believe that large number of children ensure security
and prevent divorce.
- Some believes that religion is against family planning.
70. 1- Economic motives:
Children would need large
expenses to enjoy good education
and health. Thus, with a fixed
income smaller family will enjoy
better living standards.
2- Health motives:
- The health of the mother and children are better
with spacing of pregnancies.
- Large family can have a bad effect on the
physical, mental, social and spiritual health of the
family.
71. Dimensions of the population problem in
Egypt are summarized in:
A-Population Growth,
B-Population Characteristics, and
C-Population Distribution
73. Improvement in the health conditions in the last few
years has lead to a decrease in the death rate and a
proportion of the birth rate and thus the rate of
natural increase has remained high.
But, due to past experience of high birth rate a large
number of the population is entering the fertile age
group and therefore the population growth will
remain high for years before starting to decline.
74. Total Dependency ratio 62.3%,
CBR = 30.3/1000, CDR = 4.7/1000. RNI =2.51.
Life expectancy for males=71.4, and for females
74.2years,
infant mortality rate=19.7/1000 live birth,
maternal mortality rate=33/100,000 live births
TFR =3.5 children / woman
Literacy percent = 73.8%
75. About 95% of population live around the Nile in
a very narrow area representing 5% of Egypt
land, so population density is very high.
Population problem is the result of inadequate
equilibrium between income (resources)
increase and population increase.
76. The solution of this problem:
I-long term solution
(increasing resources) by
investment in industry,
increasing land
cultivation and
productivity, exportation,
building new factories,
reclaiming desert, female
education etc.
II-Short term
solution is by
decreasing birth rate.
In other words we
empower low fertility
motives and try to
decrease high motives.
77. C-Morbidity indices:
They are disease occurrence data that
are used in disease surveillance.
The most widely used measures of illness
in a population are
incidence
prevalence rates
Attack rate
Case
fatality
rate
78. Number of new cases of illness in a specified time /
Population at risk X1000 (or 10000) in the same time and
place.
The population at risk can be the entire population in a
specified area, or specific group of people such as people
of certain age, sex etc.
ITS VALUE:
• It is very important parameter in epidemiology.
• It tells us about new cases and thus we can associate this
event of illness with the possible causal factors.
• It can be calculated for both chronic and acute diseases.
• It measures the relative importance of one illness over
the other
81. Two types of prevalence measurement:
A-Point prevalence: Number
of current cases (old & new) of
an illness at a point of time /
Population examined at same
point of time x constant. Point
of time is a short period (days,
month).
B-Period
Prevalence: Number
of current cases of an
illness over a period of
time / Population
examined at the same
period X constant.
Period of time is longer
(months, years).
82. The prevalence is an indicator of the burden of
disease on the population since it reflects the
number of cases whether old or new.
It measures the relative importance of one
illness over the other
Can be used for evaluation of health services.
83. It is an incidence rate estimated in an
epidemic (or outbreaks) when observation
of population at risk is for short period.
Overall Attack rate: Number of new cases
of specific disease reported during epidemic
period of time / Total number of persons at
risk during the same time X 100
84.
85.
86. Number of deaths of cases from specific illness in specific time
Number of cases of the same illness in the same time and place X K
Value: It measures the virulence of the agent and
the severity of the disease. Therefore is
considered as a morbidity measure although it
involves deaths.
87.
88. D-Mortality indices or Death indices
They are not effective as the morbidity indices
but sometimes they are the only available data.
Values or benefits of death indices:
Death rates are important indicator of the health
status in a community.
They can indicate the impact of a particular
cause on the population.
They can study the relation of a certain cause to
the disease occurrence.
89. Crude Death rate (CDR)
Cause specific death rate
Age specific death rate
Sex specific death rate
Age-sex specific death rate
Infant mortality rate (neonatal – post neonatal)
Perinatal mortality rate
Maternal mortality rate (ratio)
Proportional (relative) mortality rate
Case – fatality rate.
90. Is the number of deaths in a specific period/ mid
year population at the same period and place X
1000.
The crude death rate in Egypt has decreased to
reach 4.7 / 1000 population in 2016. This
improvement can be attributed to community
development, better health services, application of
modern techniques, new drugs, health education
etc.
Disadvantages: The CDR is not specific rate as it
includes all deaths in a population irrespective of
its age, sex distribution or cause of death.
1-Crude
death rate
(CDR):
91. Number of deaths from a specific cause
in a specific time/ Mid year population at
the same time period X constant
The cause specific mortality rate
describes the severity of the disease to
cause deaths.
Cancer has high cause specific MR.
2- Cause
Specific
Mortality
Rate:
92. Number of deaths in a specified age group and
specific time /Population of the same age group
and at the same time period X constant
The age specific mortality rates describe the
rate of deaths in each age group.
The causes of deaths among age groups are
different and therefore by using this rate we
can prioritize these causes to be solved.
3-Age specific
Mortality
Rate ASMR:
93. Number of deaths in a certain sex in a specific
time /Population of the same sex at the same
time period X constant
The sex specific mortality rate describes the
rate of deaths in each sex.
The causes of deaths among different sex are
different and therefore by using this rate we
can identify health problems related to sex.
4-Sex specific
Mortality
Rate ASMR:
94. Number of deaths of males or females at
certain age group at certain area and time
/ number of males or females of the same
age group X 1000 in the same area and
time.
5- Age- Sex
specific
Mortality
Rate
ASSMR:
95.
96.
97.
98. Maternal Mortality Ratio:
Number of deaths among women due to causes
related to pregnancy, labor and puerperium in a
specific year & locality /live births in the same year
& locality X 100,000
It accounts for the greatest number of deaths
among women in reproductive age in devloping
countries. (33 deaths /100000 live births 2016)
7- Maternal
Mortality Ratio
99. Proportional (relative) mortality Rate:
Number of deaths from a specific cause in a
specific time /Total deaths from all causes X
constant
It describes the relative importance of a specific
disease as a cause of mortality in relation to
other causes.
8- Proportional
(relative)
mortality Rate:
100. The risk of dying and contracting most
diseases are related to age and sex.
So, Crude death rate and overall incidence and
prevalence rates depend critically on age-sex
composition of any population.
For example, a relatively older population
would have a higher crude death rate than a
younger population.
101. In order to compare overall morbidity rates and
crude death rate across countries,
to neutralize the difference in age and sex
composition by using:
and
1-
Direct
method
2-
Indirect
method
102. The choice of method is usually governed by
the availability of data and their accuracy.
However, indirect standardization is more
commonly employed for mortalities and
incidences.
Direct standardization is more commonly
employed for prevalence.
103. In this method we use (a standard population).
This is usually one of the following : either one of
the study populations or the total of both
populations.
Then, the age-sex specific rates from each of the
populations under study are applied to the
standard population to give age-sex adjusted
rates.
Death rates
104. The age –sex specific rates from a standard
population are applied to each of the
populations of interest to give standardized
(morbidity or mortality) ratios which in turn are
used to calculate age-sex adjusted rates.
Death rates
105. Is Data collection important???
Yes or No. HOW??????
1. Diagnosis of community health problems &
assess community needs
2. Helps in the comparison of health status and
diseases in different countries and in one
country over the years.
3. Evaluation of health services & health
programs.
Sources of data collection
106. Sources of data collection
Primary Sources:
(the investigator
"s" collects data
not present before)
It can be either
qualitative or
quantitative.
Secondary
Sources: (already
present data,
routinely collected
and reported by
government or
authorized centers)
107. Sources of data collection
1-Qualitative data:
will provide us with
insight on personal
ideas, opinions, and
attitudes.
It can be carried out
by focus group and in-
depth interview.
2-Quantitative data:
Survey study. These are field
investigations that are carried out to
find the frequency of a specific
disease in a population.
Either we include every member
of the population (census) or take
sample survey, in which only a
selected part of the population is
included.
The survey can provide more
detailed information and also it has
the ability to evaluate the data
collection methods.
108. Sources of data collection
1-National
census 2-
Surveillance
3-Records
4-International
Classification of
diseases (lCD)
109. Sources of data collection
1-National
census
It provides a wealth of
demographic and economic
data.
110. Sources of data collection
2-
Surveillance
It refers to special reporting system
(notification) which is set up for a particular
important health problem or threatening
disease.
111. Sources of data collection
3-Records
e.g. birth, death certificates and health care
registries as hospital records, school records,
data of insured groups, armed forces,
absenteeism of workers.
112. Secondary Sources of data collection
3-Records
Importance of records:
1 - Birth certificates provide
denominators for computation of
rates that describe events related to
infancy and pregnancy, labor,
puerperium.
2- Disease notification and
registration provide data for
calculation of
- Incidence rate, prevalence rate.
- Relative fluctuation of disease and
its geographic distribution.
- Data for planning and evaluation of
preventive measures.
Drawbacks of records:
-Variation in diagnostic criteria
and definition of case.
-Incomplete & inaccurate data
records (as in hospital files).
-The number of notified cases is
far less than the number
occurring.
- Records of special subgroups
who have special characteristics
will limit the generalization of
data on the whole community.
113. Sources of data collection
4-International
Classification of
diseases (lCD)
It provides a more standard way to
record diseases and health problems.
It is used to classify diseases and
other health problems in a standard
way.
It allows the storage and retrieval of
diagnostic information for clinical and
epidemiological purposes.
Provides the basis for the collection
of national mortality and morbidity
statistics by WHO.
115. In September 2000, building upon a decade of
major United Nations conferences and
summits, world leaders came together at the
United Nations Headquarters in New York to
adopt the United Nations Millennium
Development Declaration.
The Declaration committed nations to a new
global partnership to reduce extreme poverty,
and set out a series of eight time-bound
targets - with a deadline of 2015 - that have
become known as the Millennium Development
Goals (MDGs).
116. Eradicate extreme poverty and hunger.
Achieve universal primary education.
Promote gender equality and empower woman.
Reduce child mortality.
Improve maternal health.
Combat AIDS / Malaria and other diseases.
Ensure environmental sustainability.
Develop a global partnership for development.