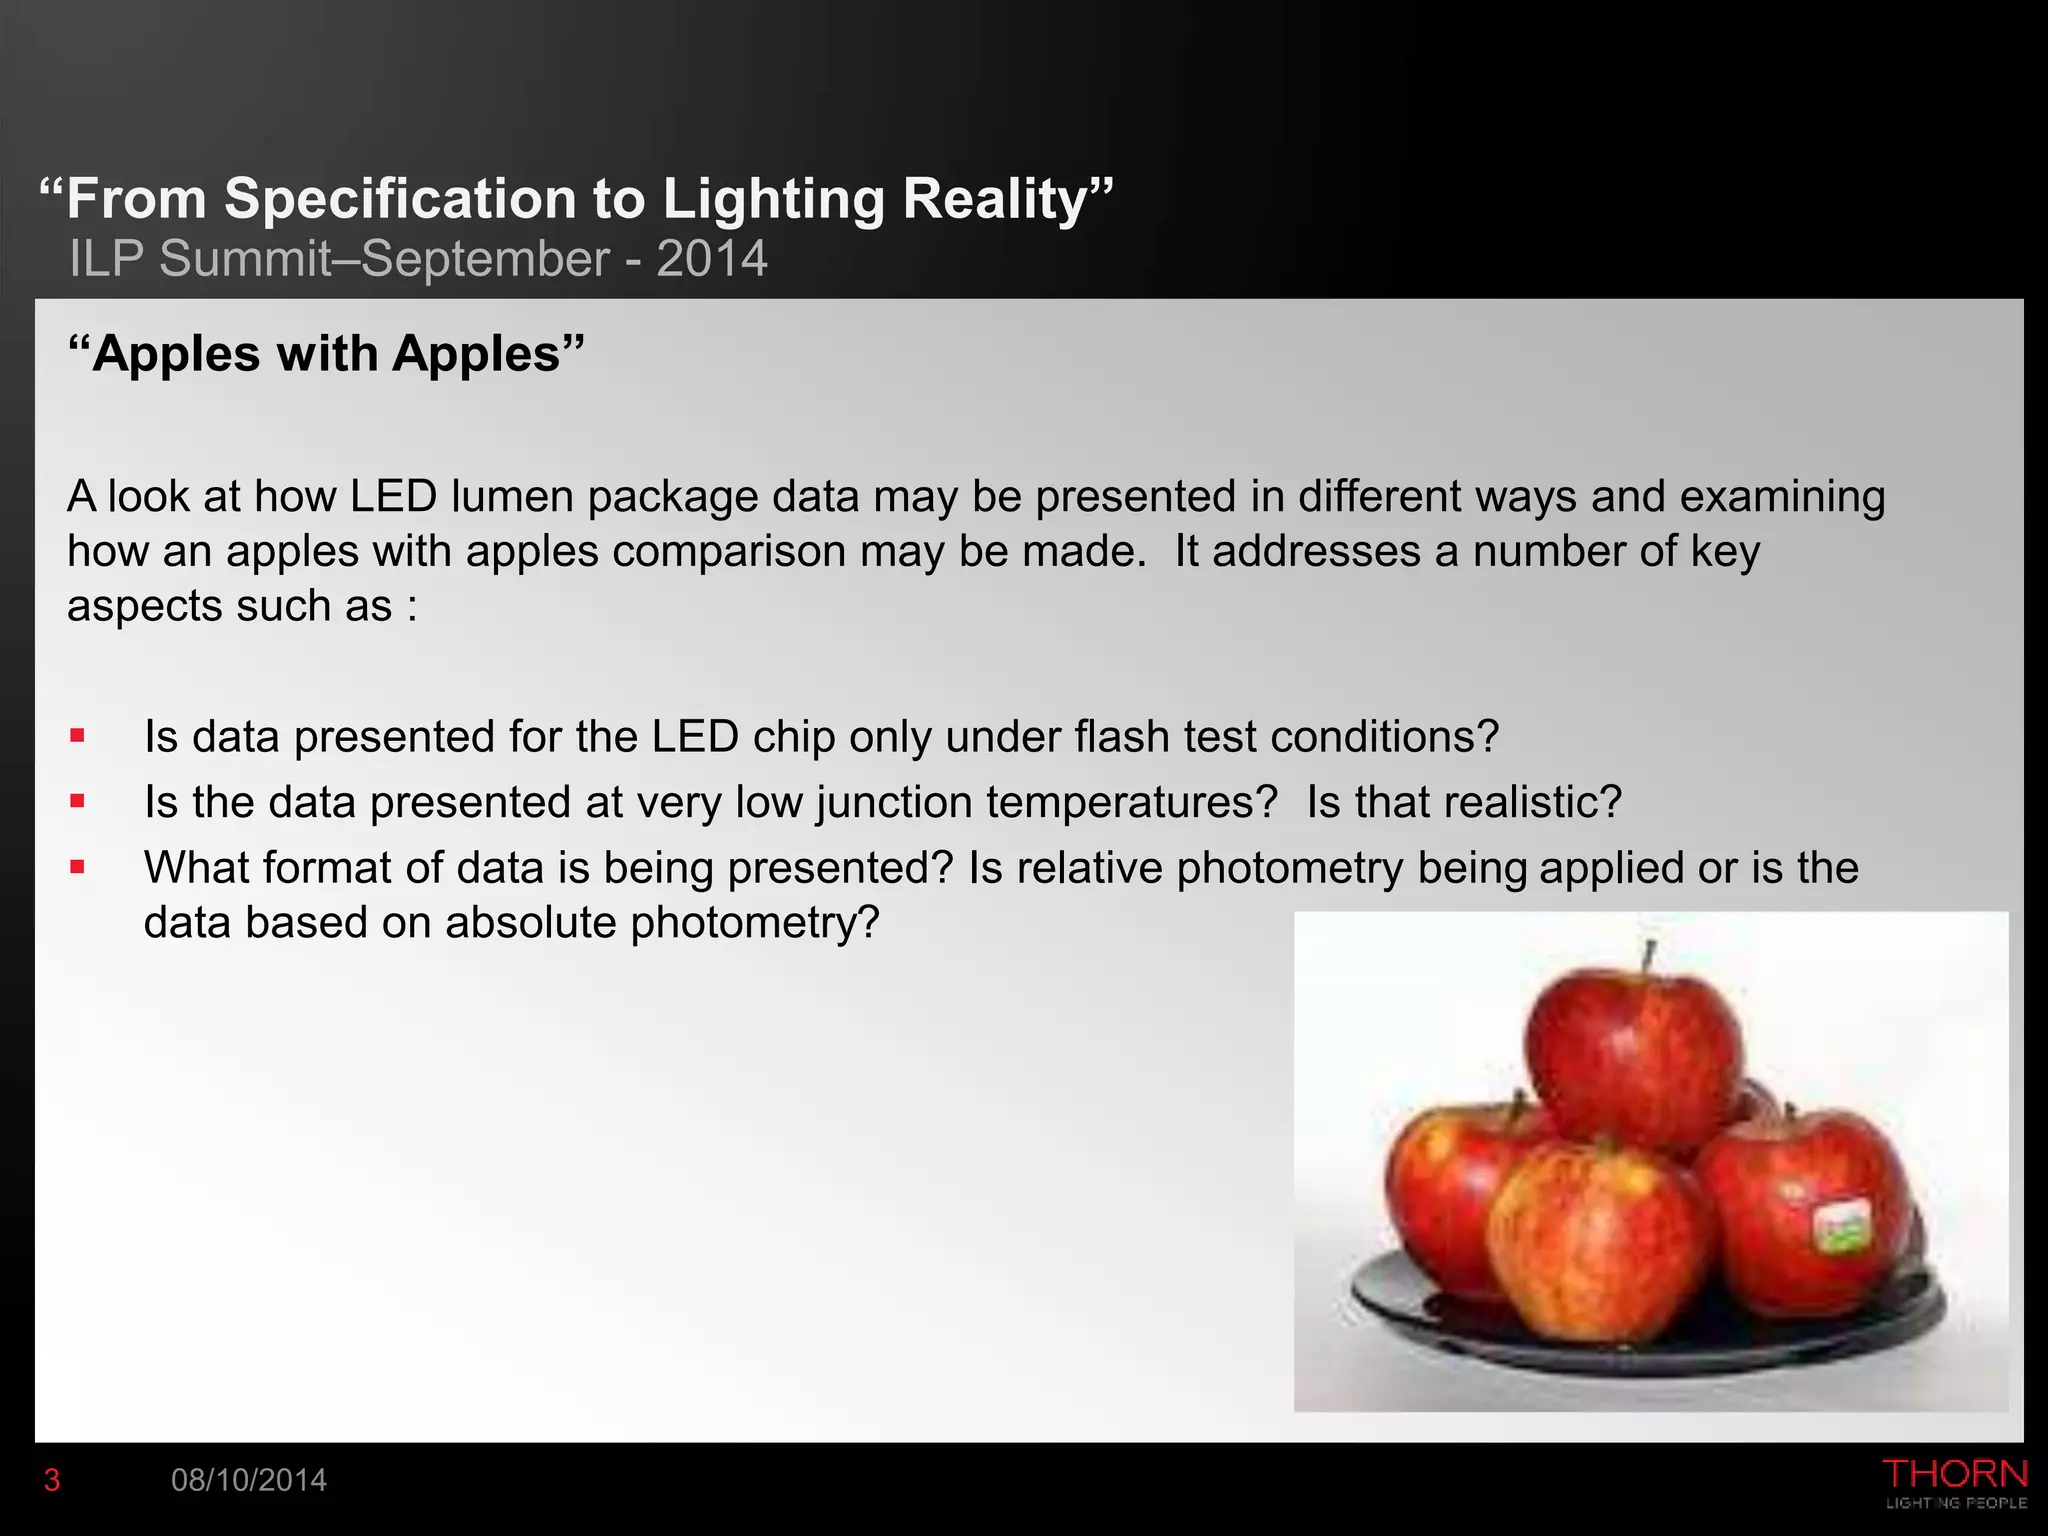
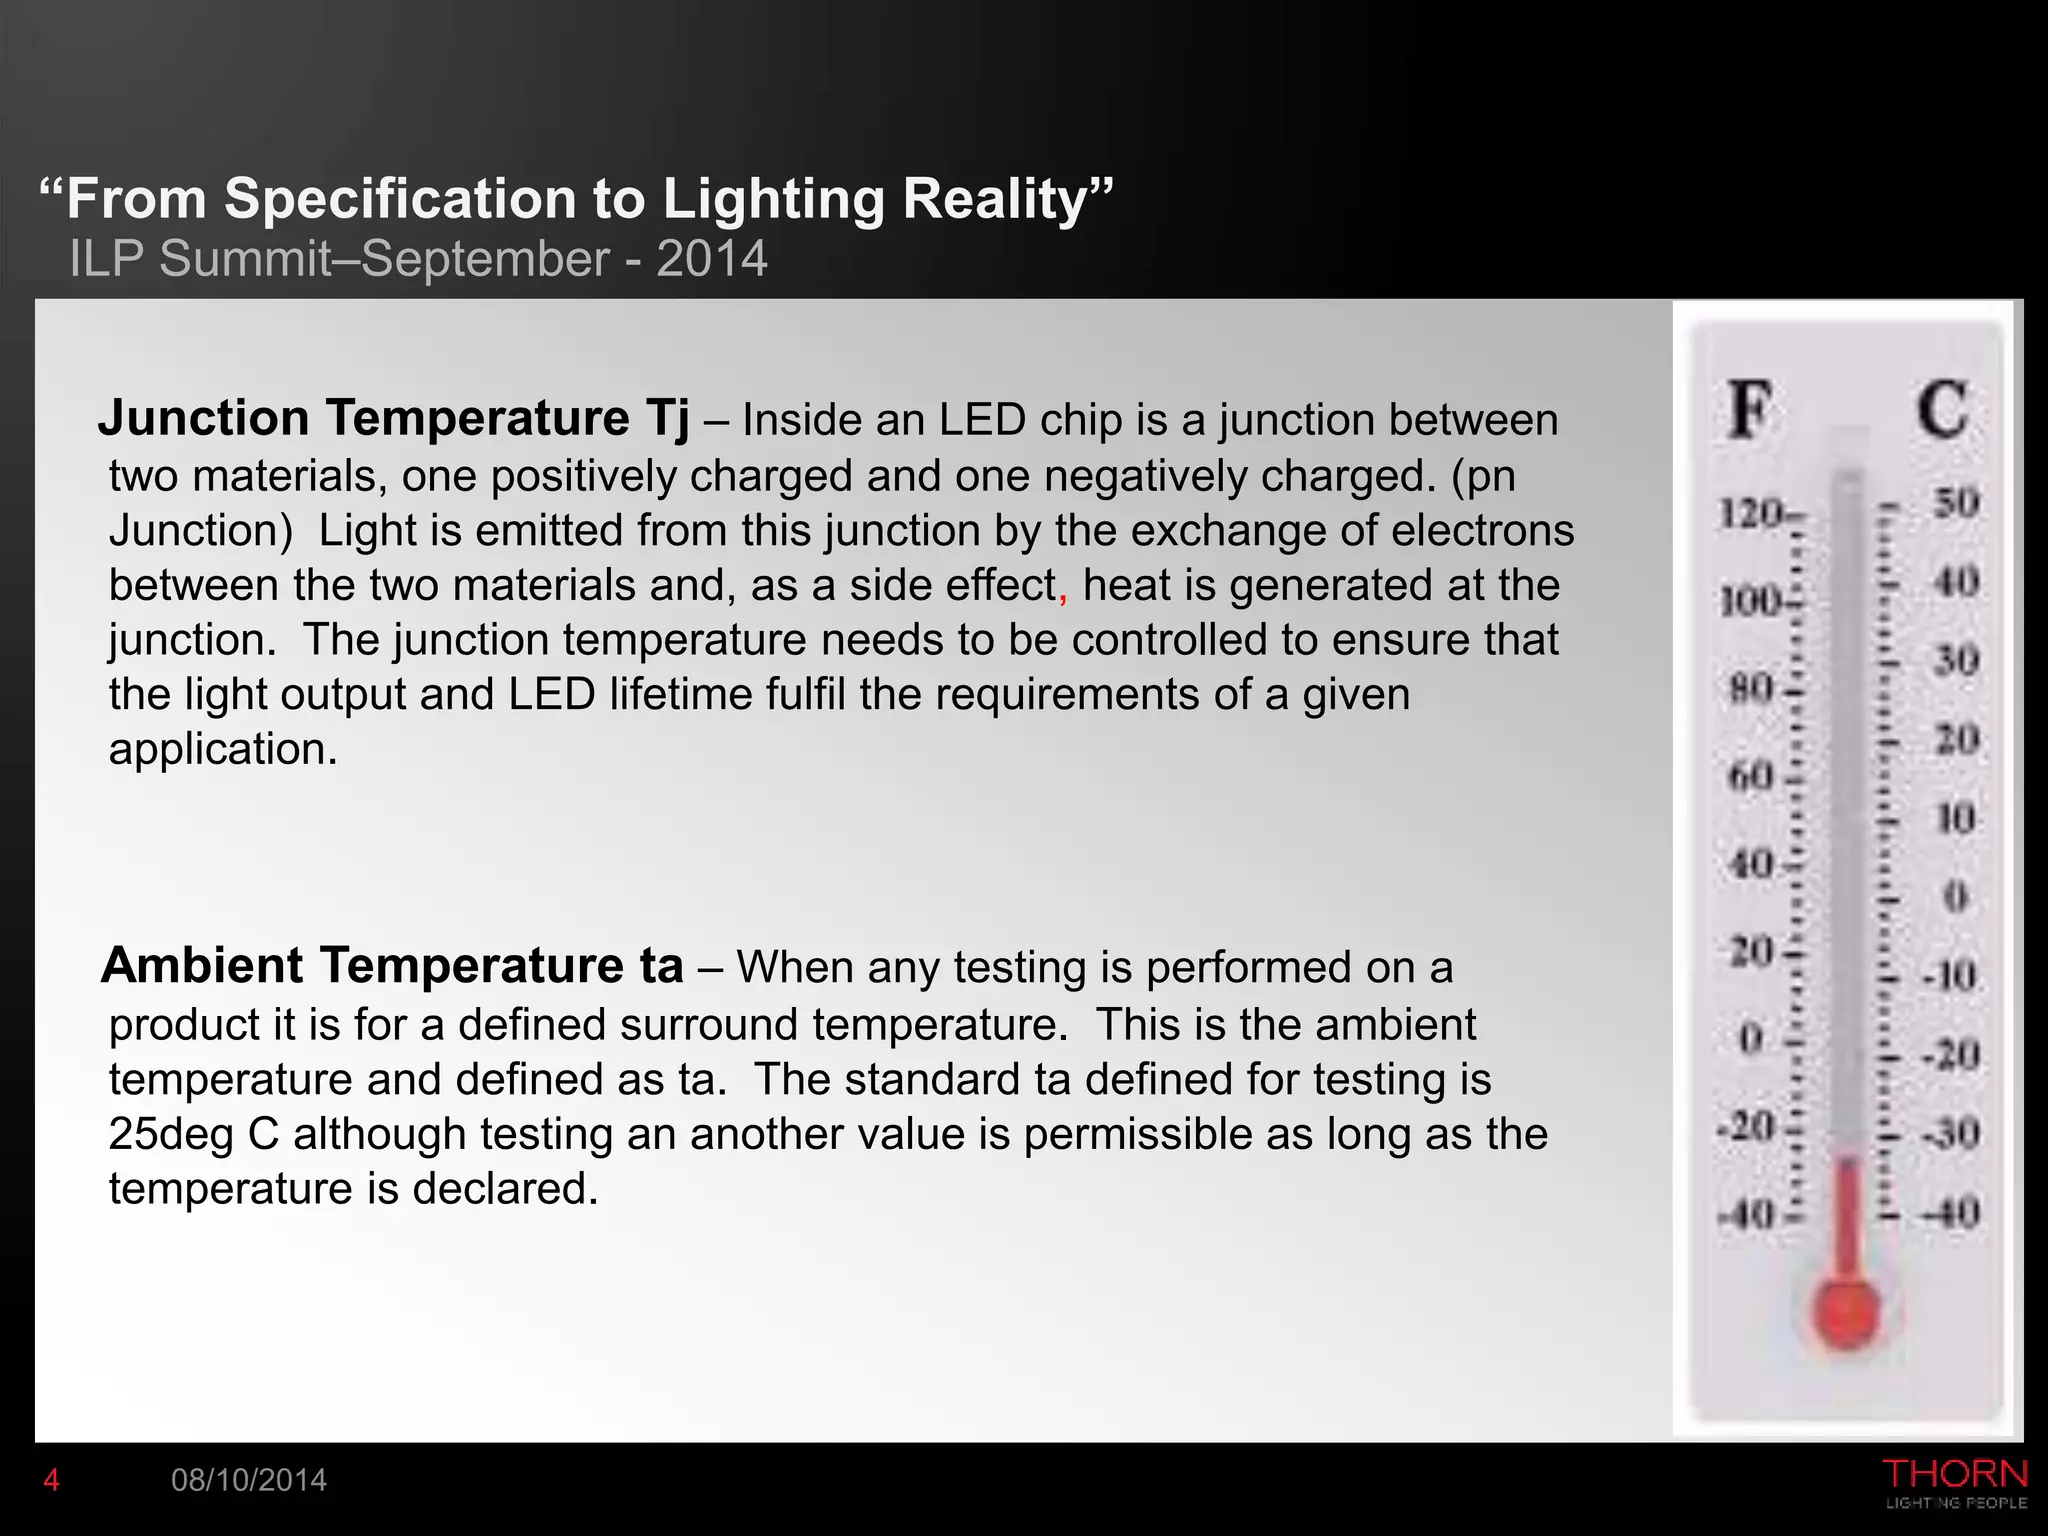
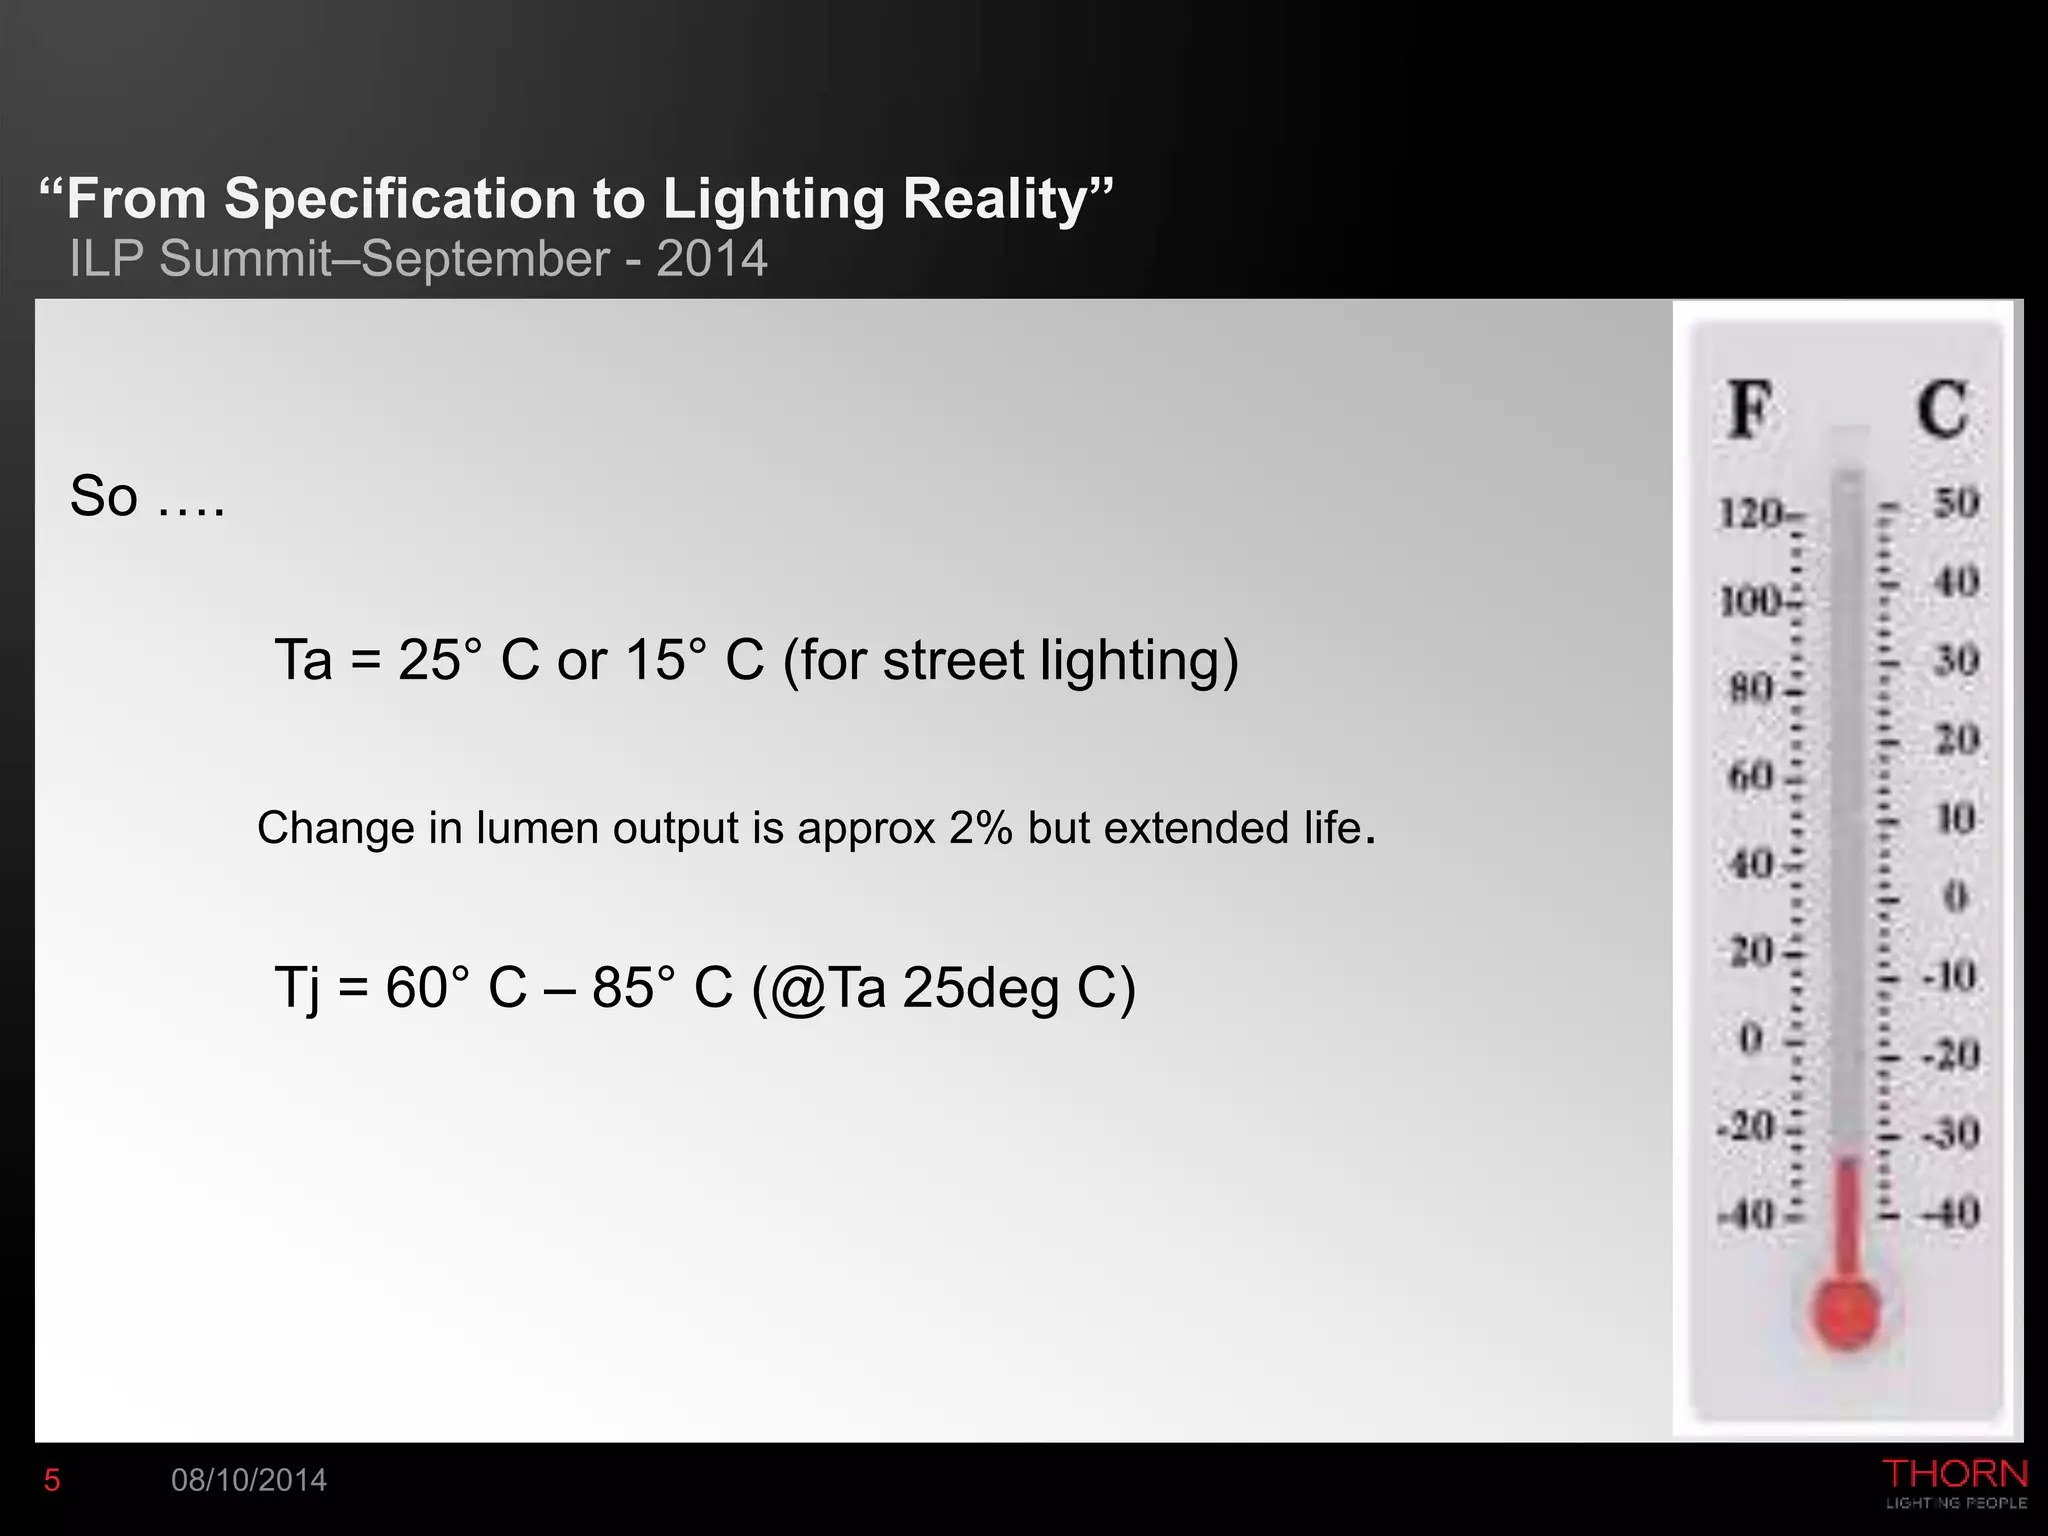
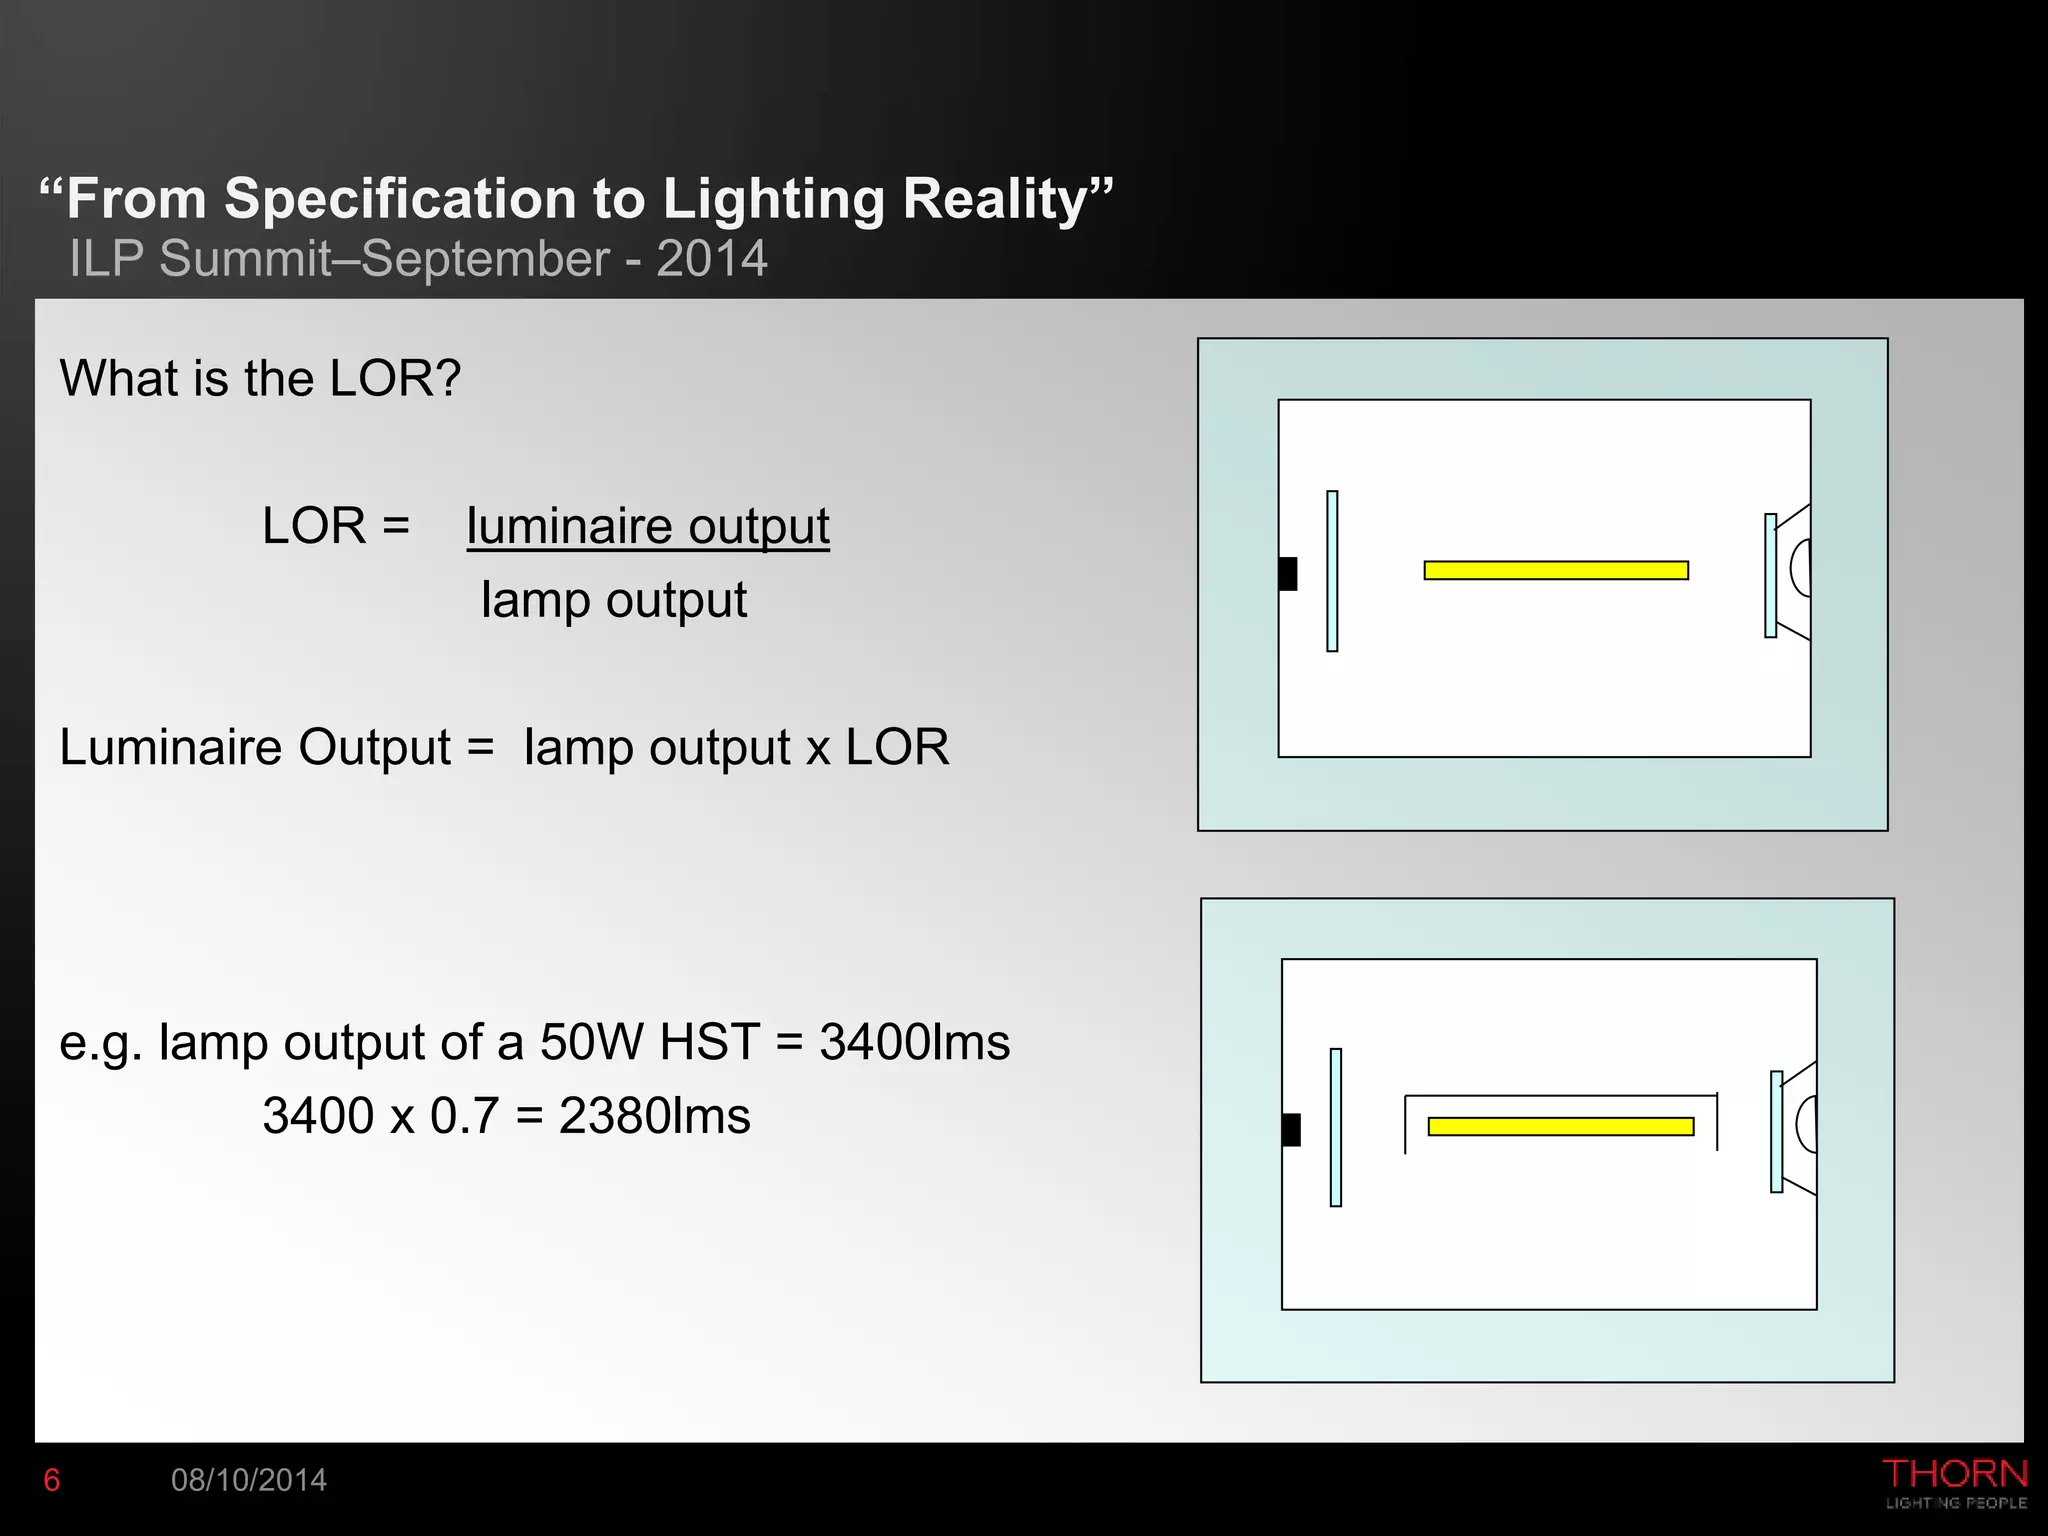
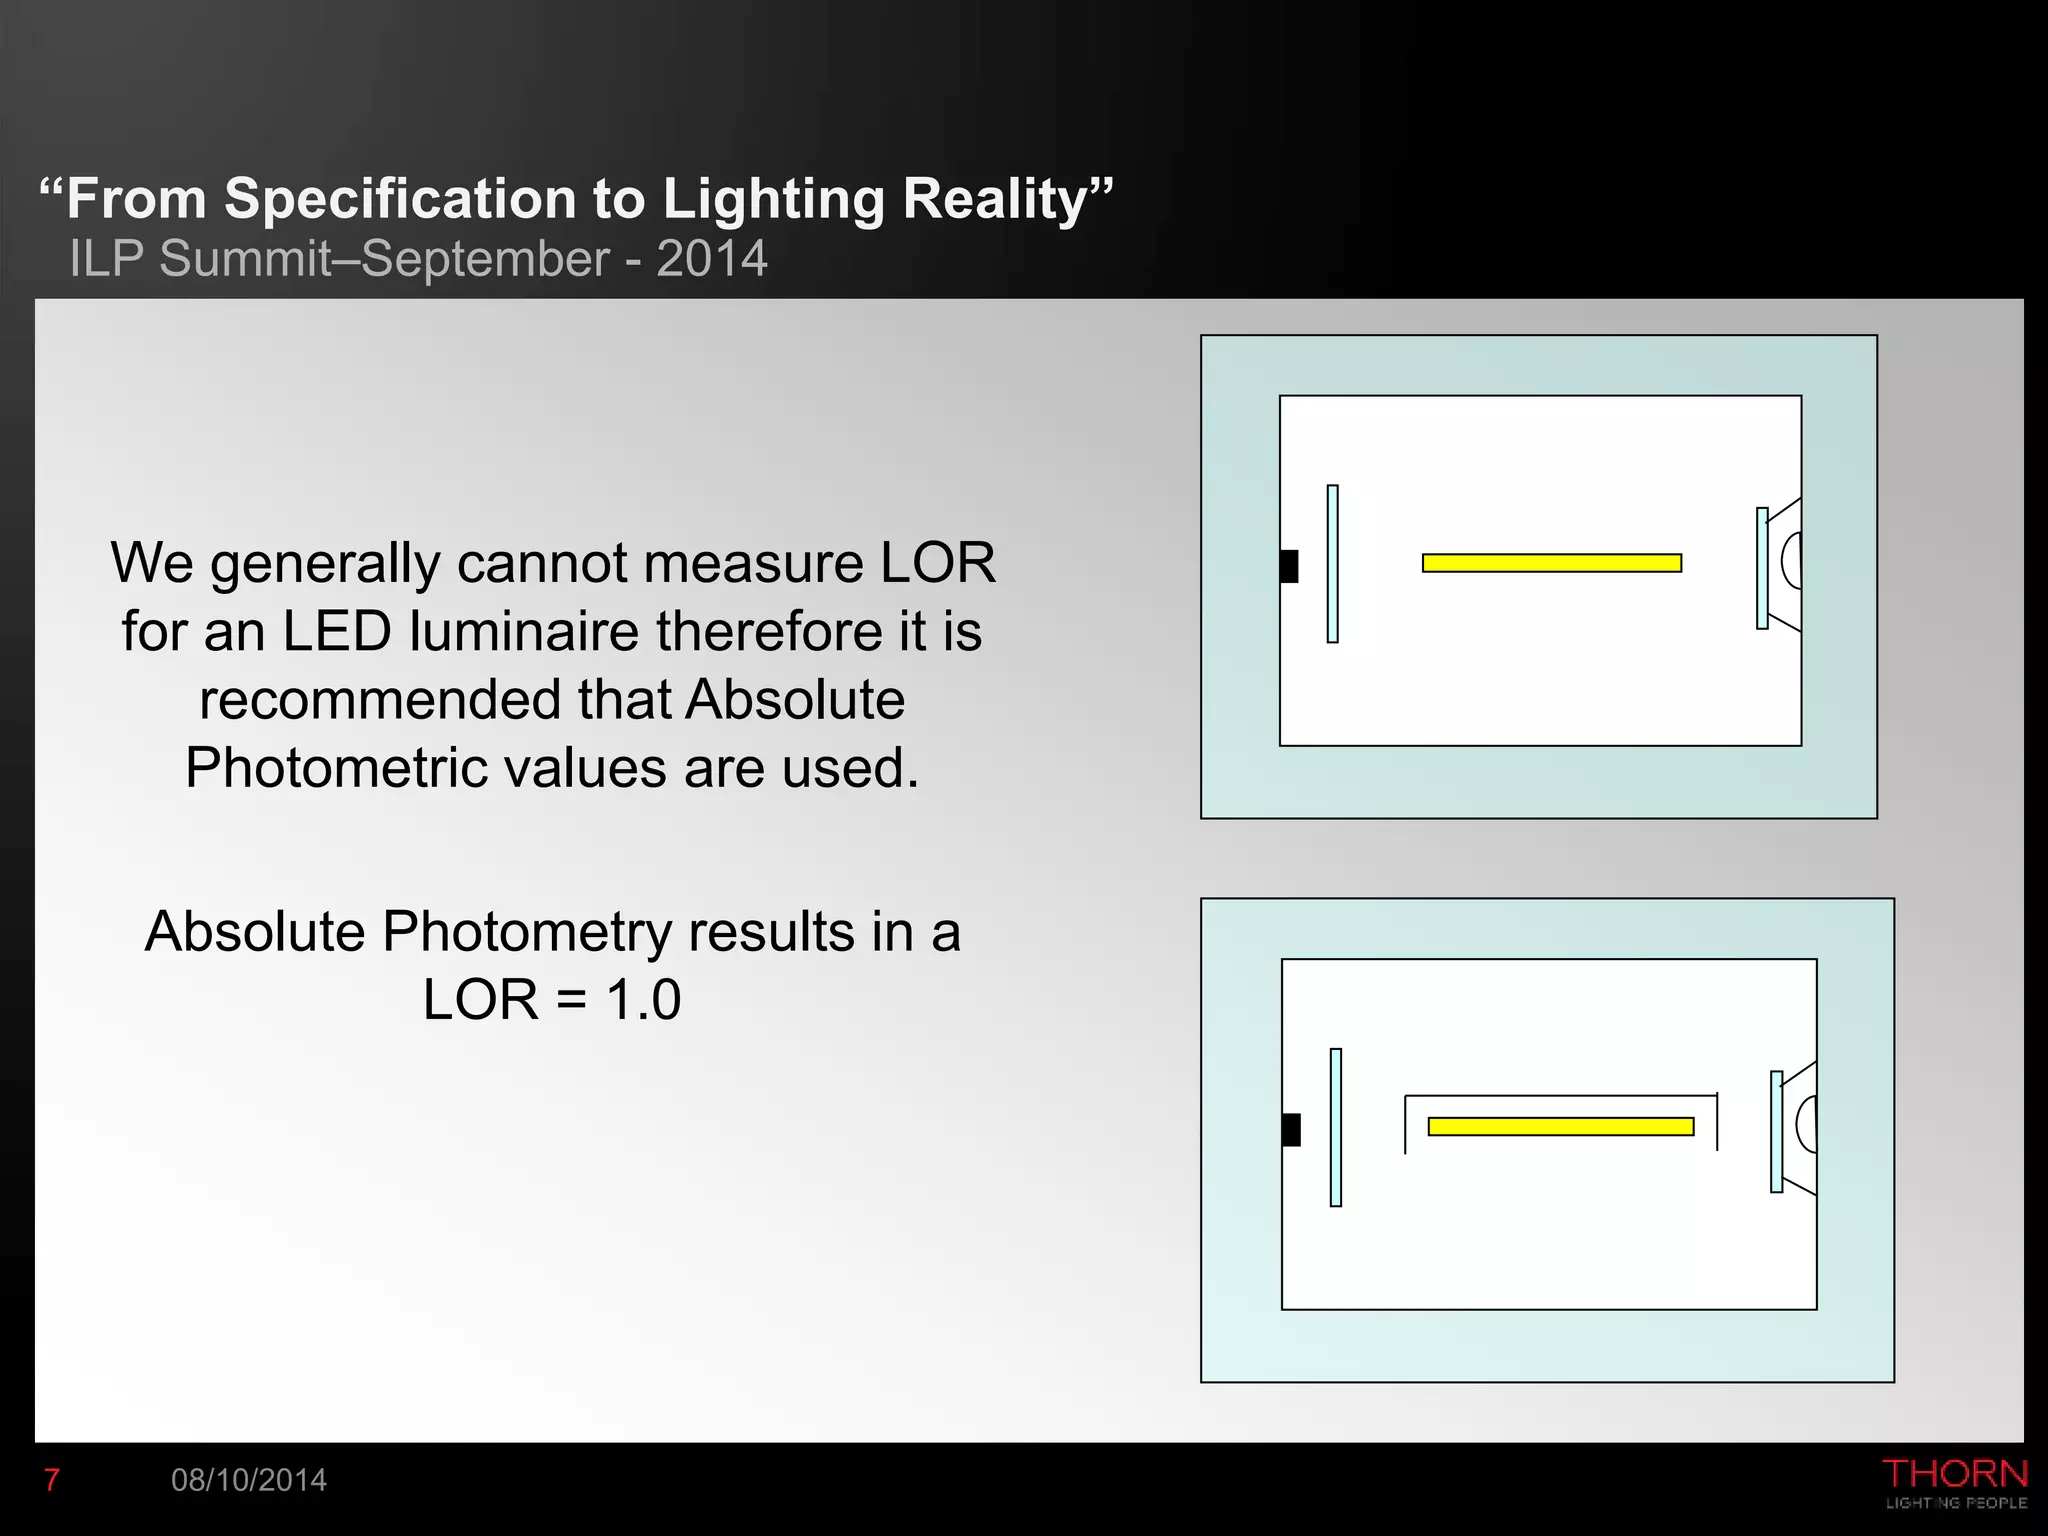
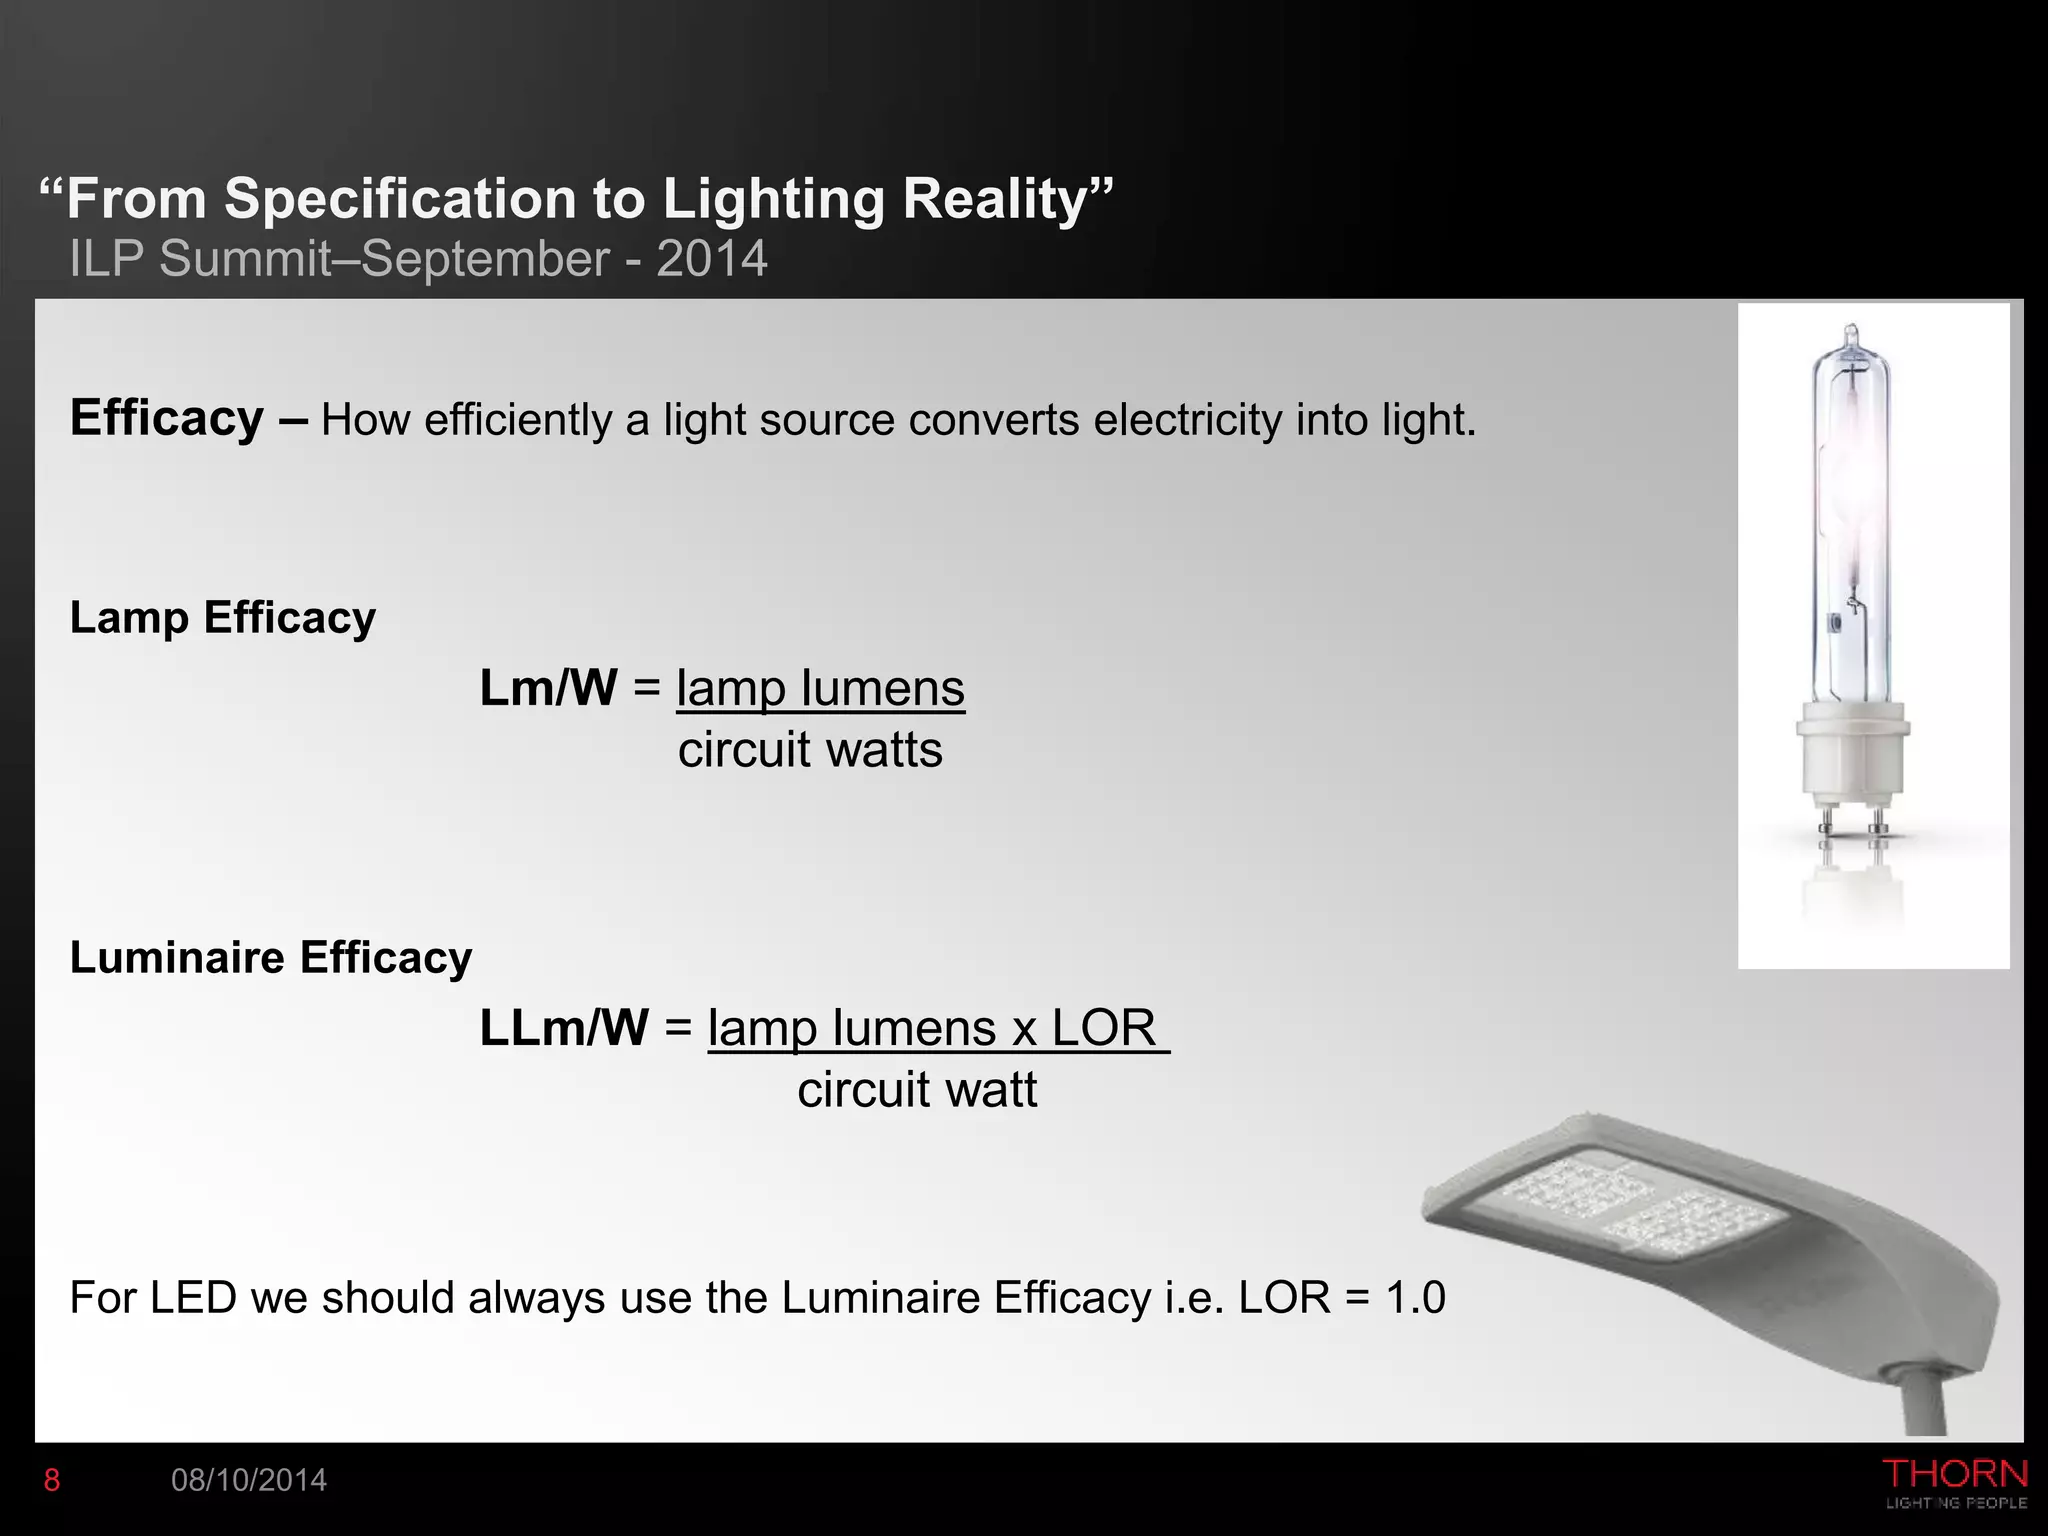
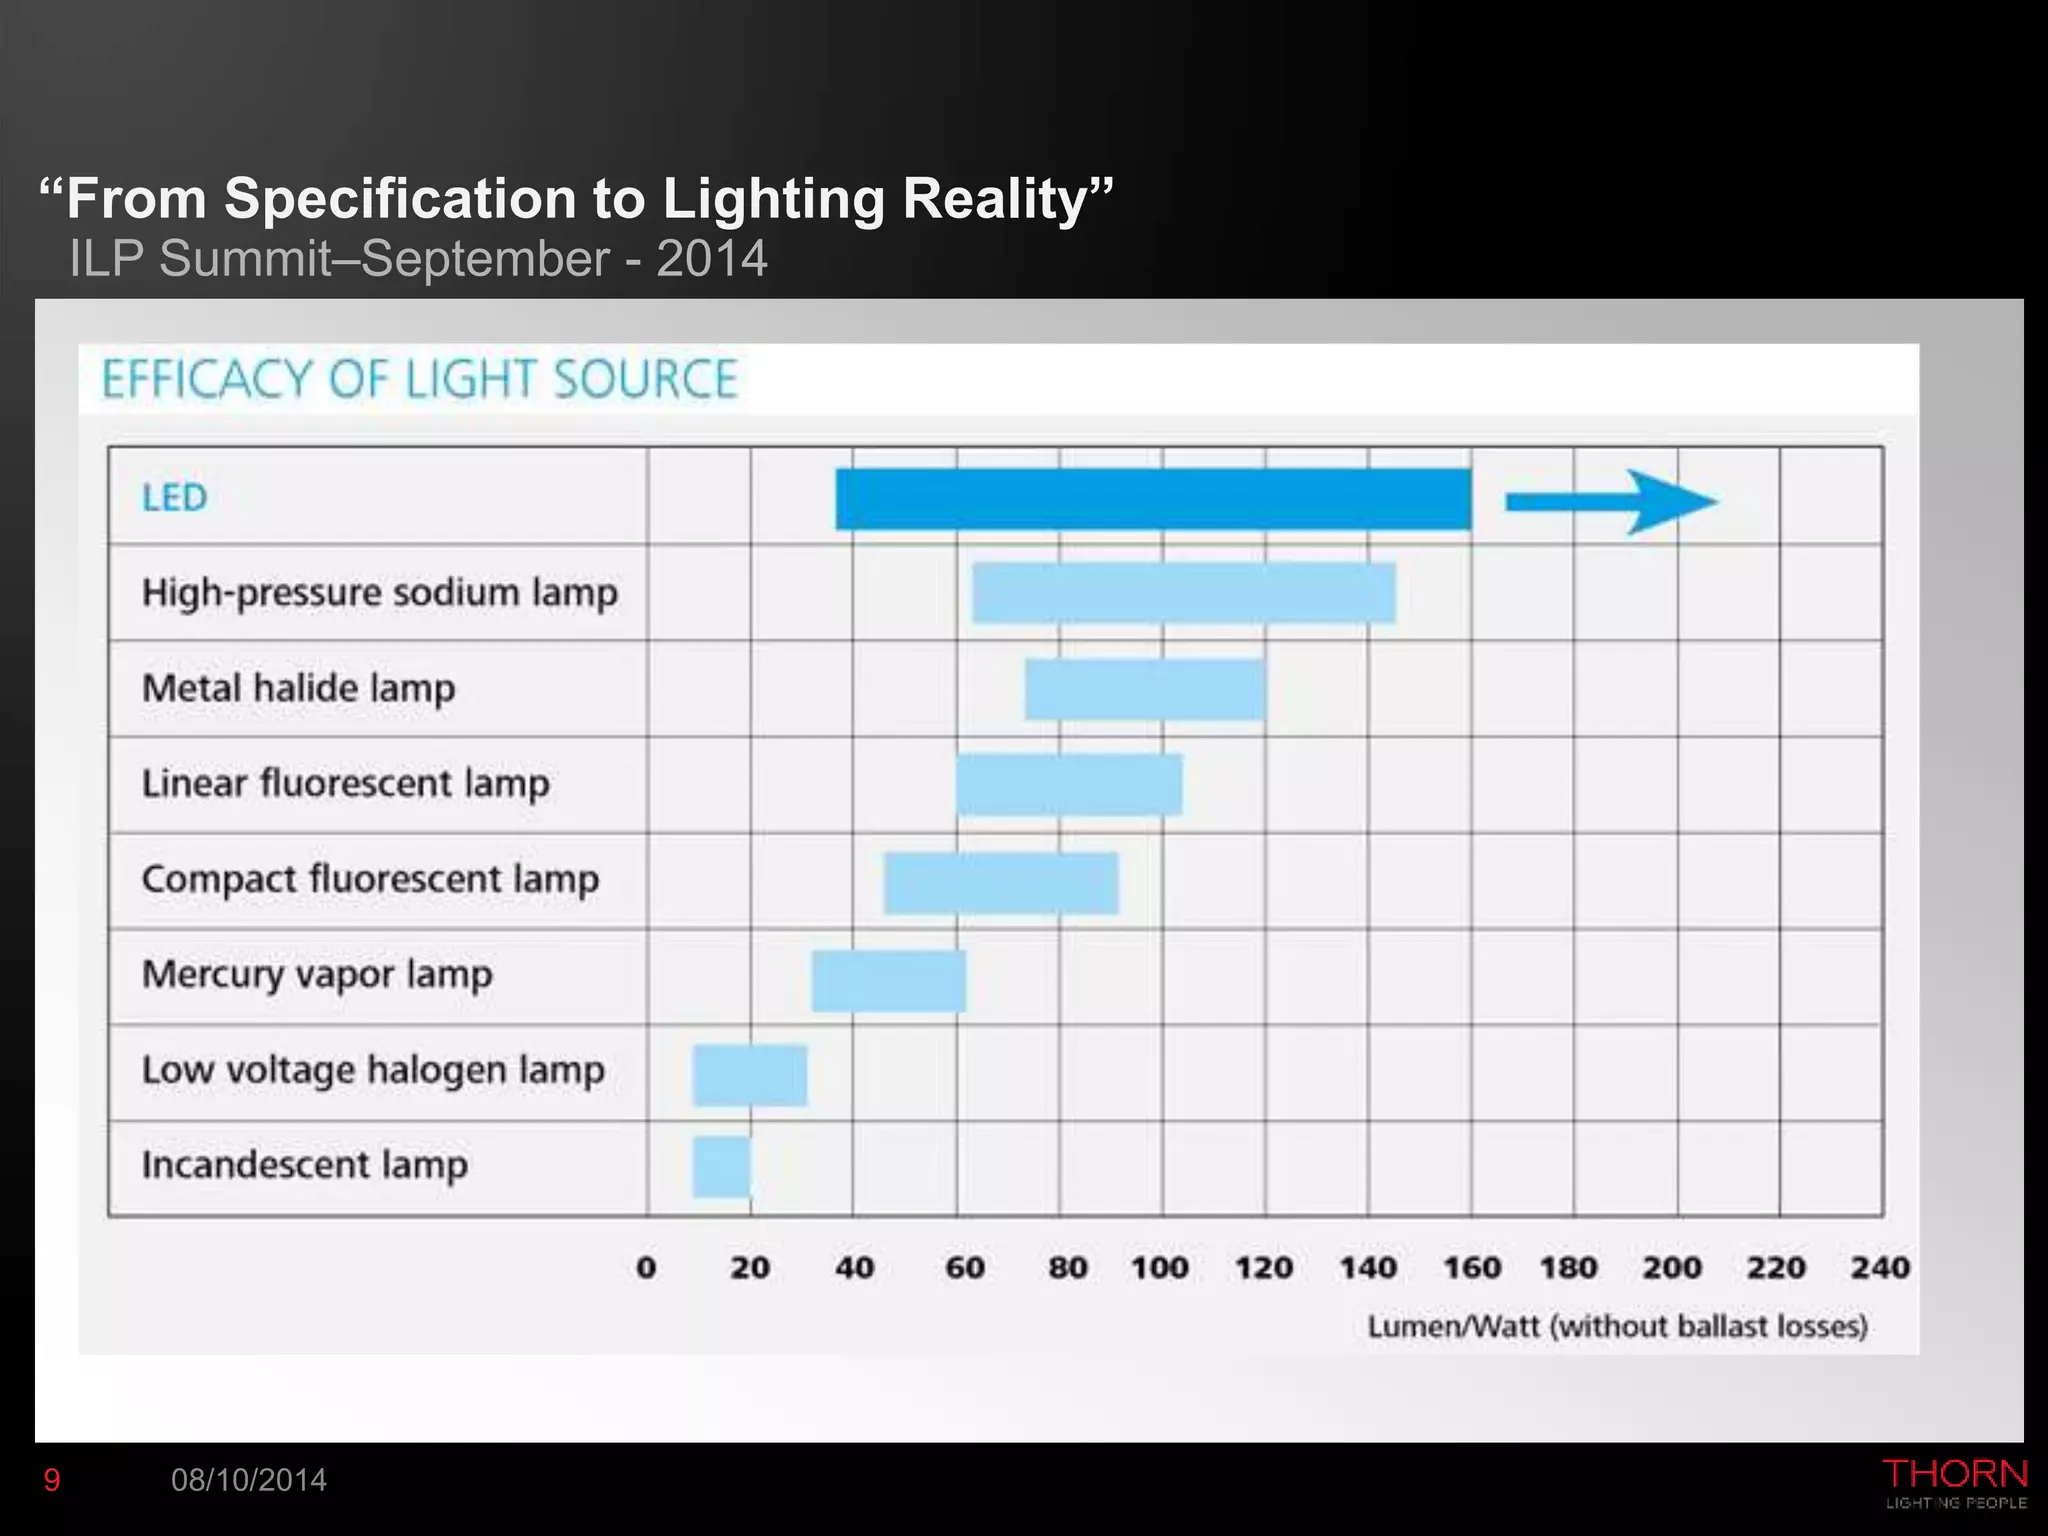
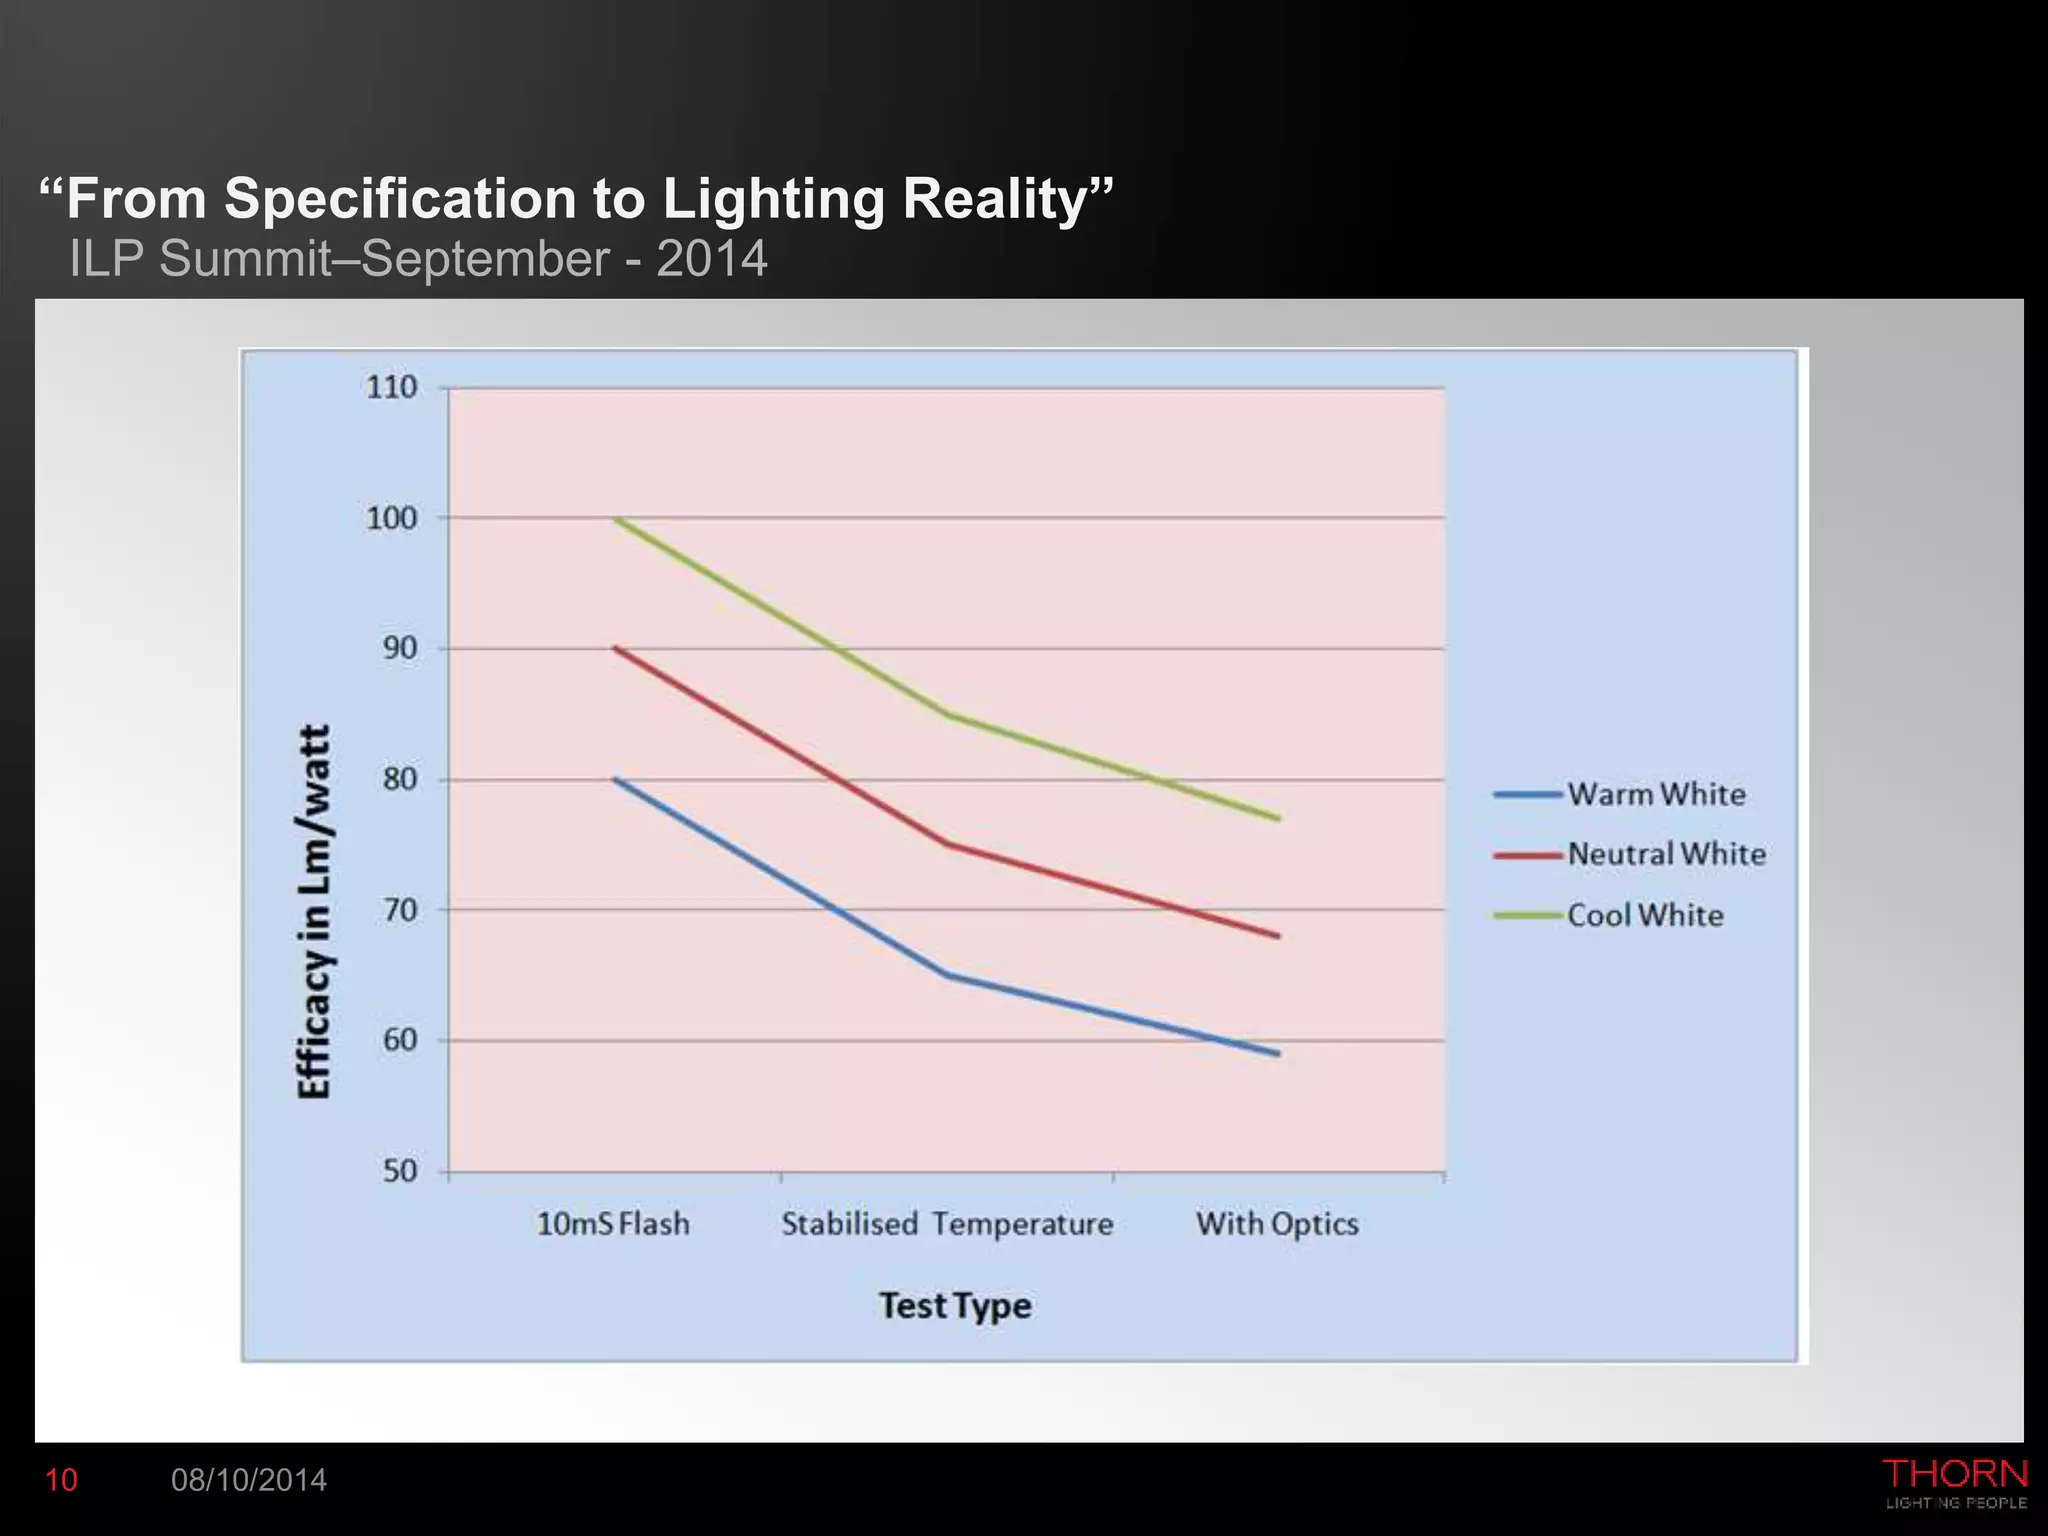
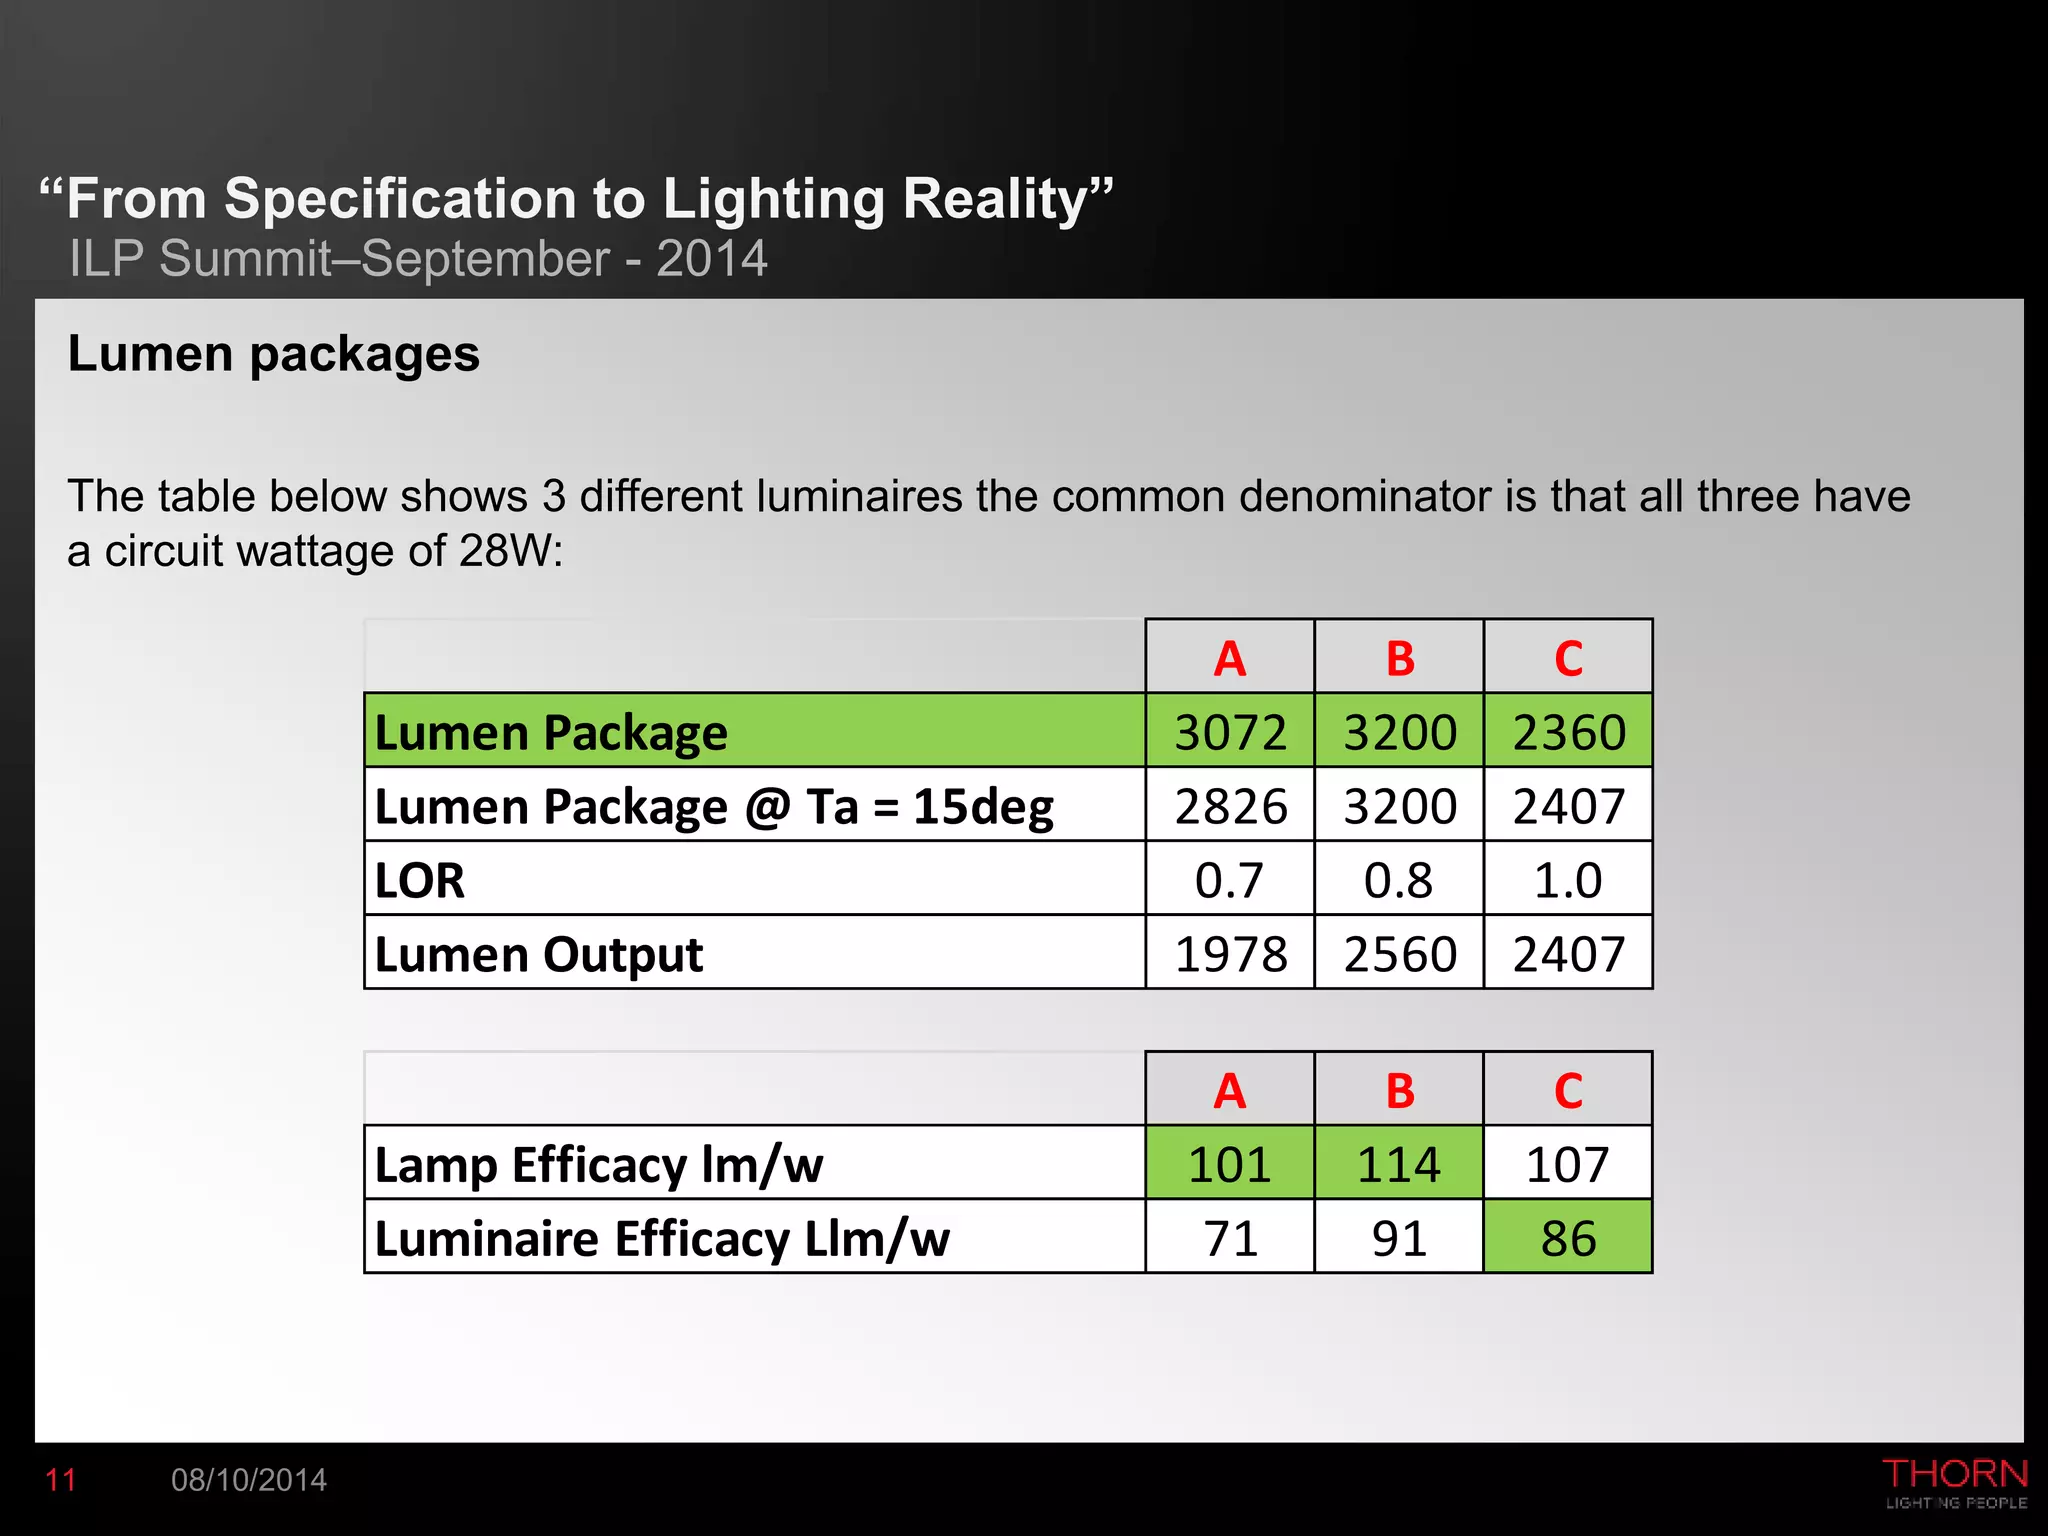
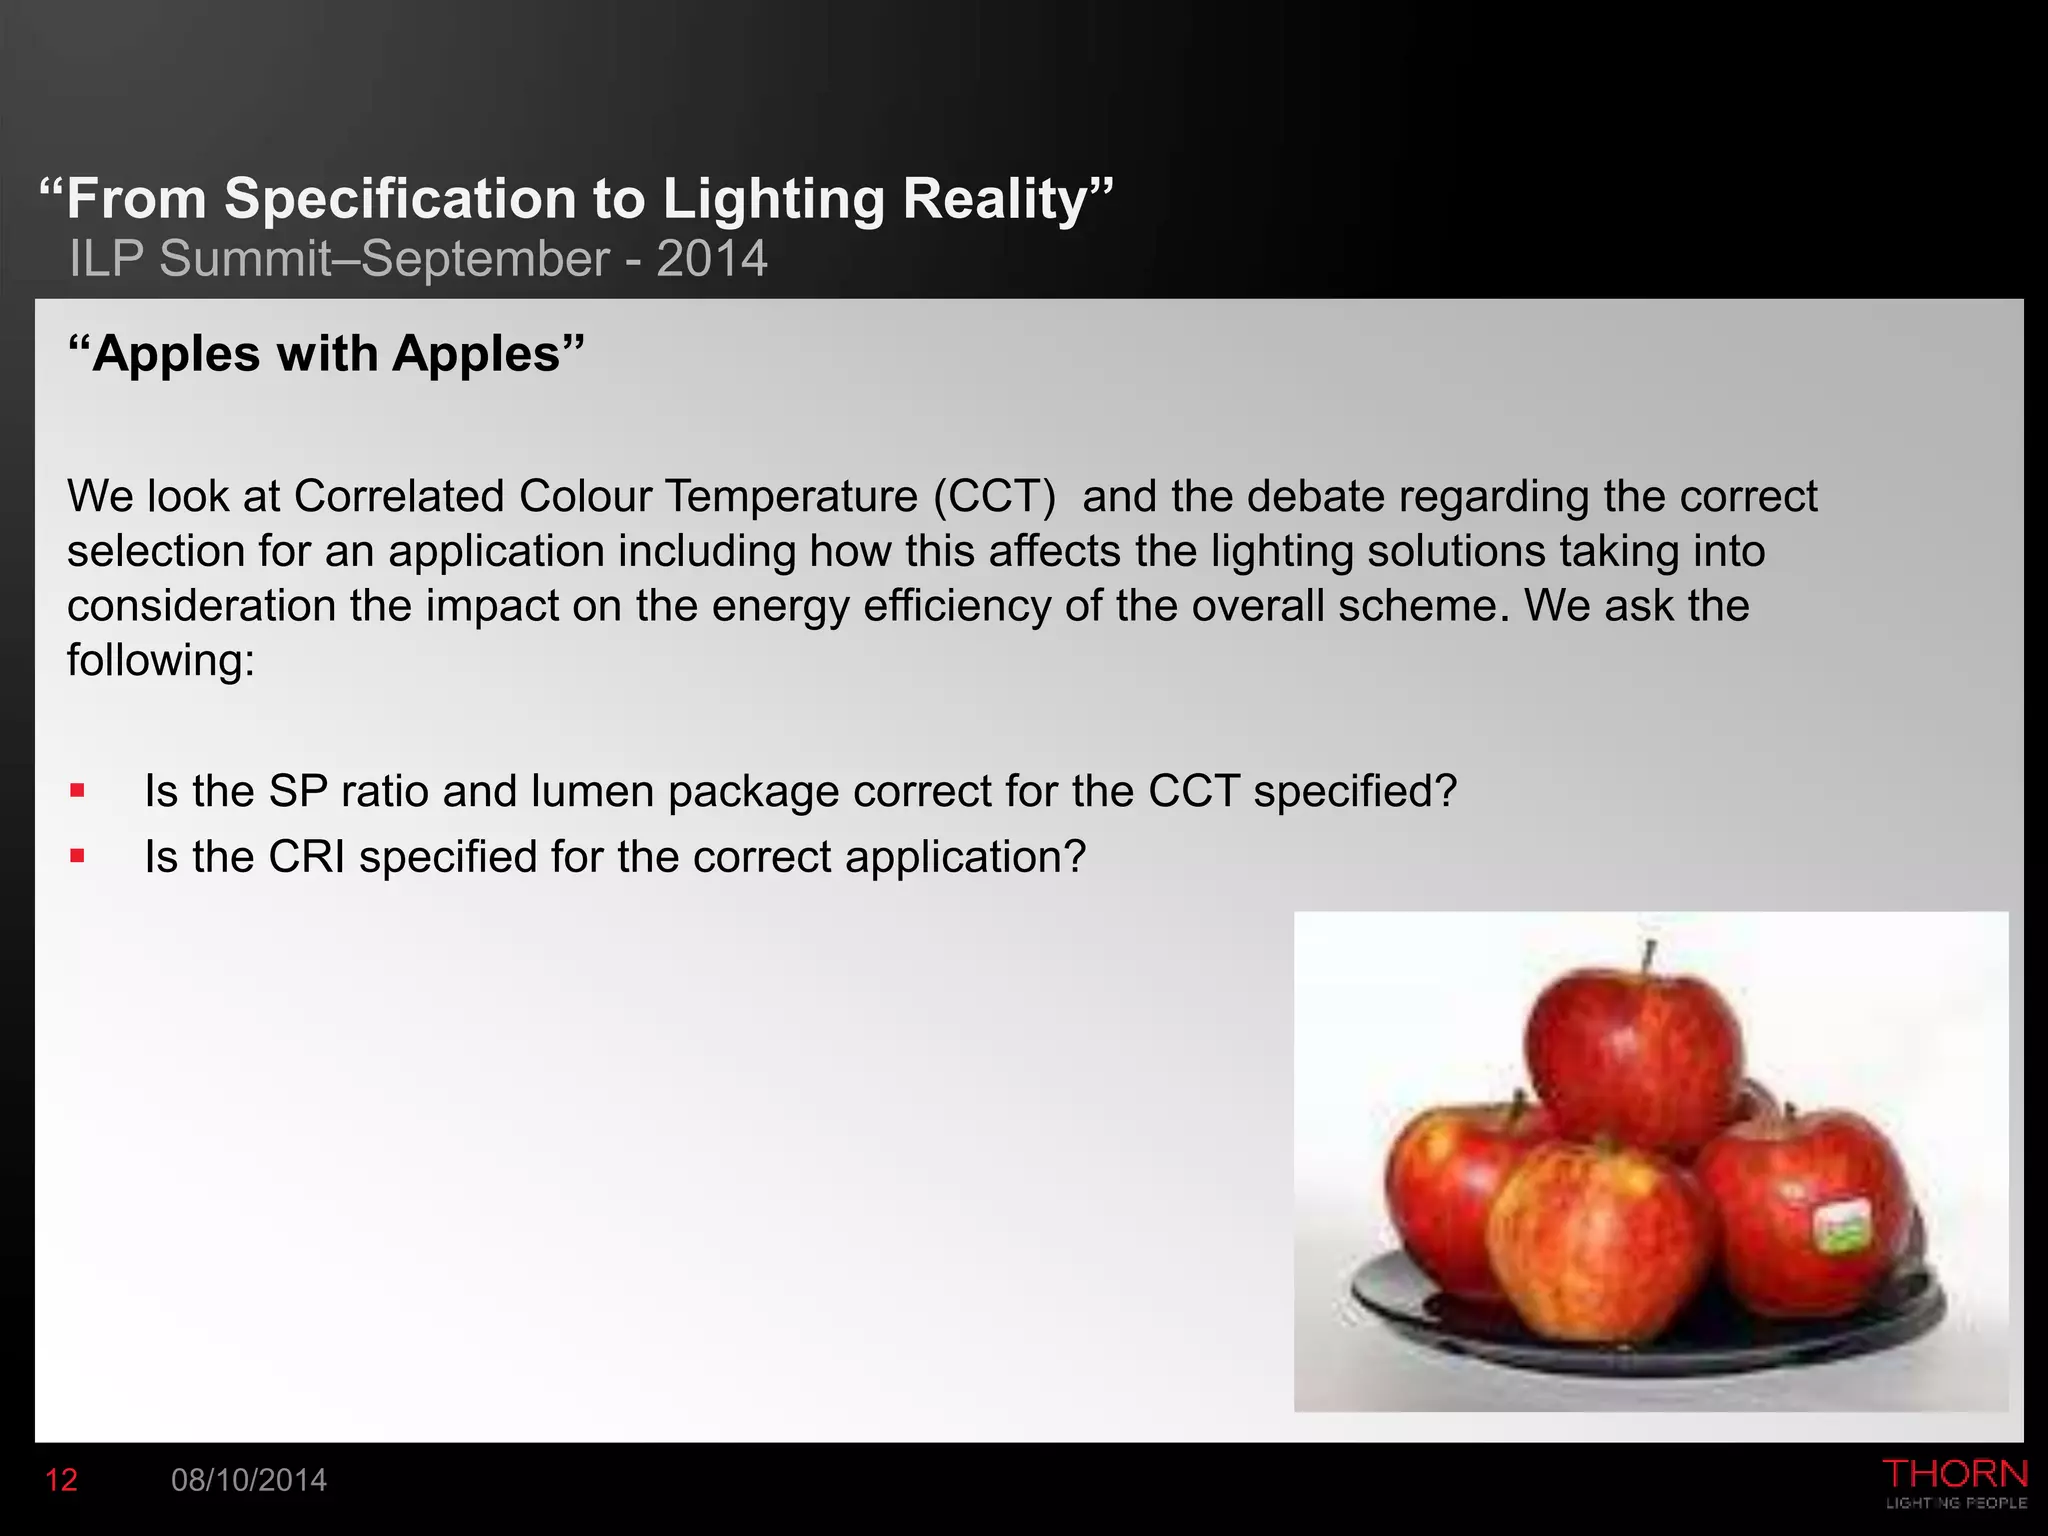
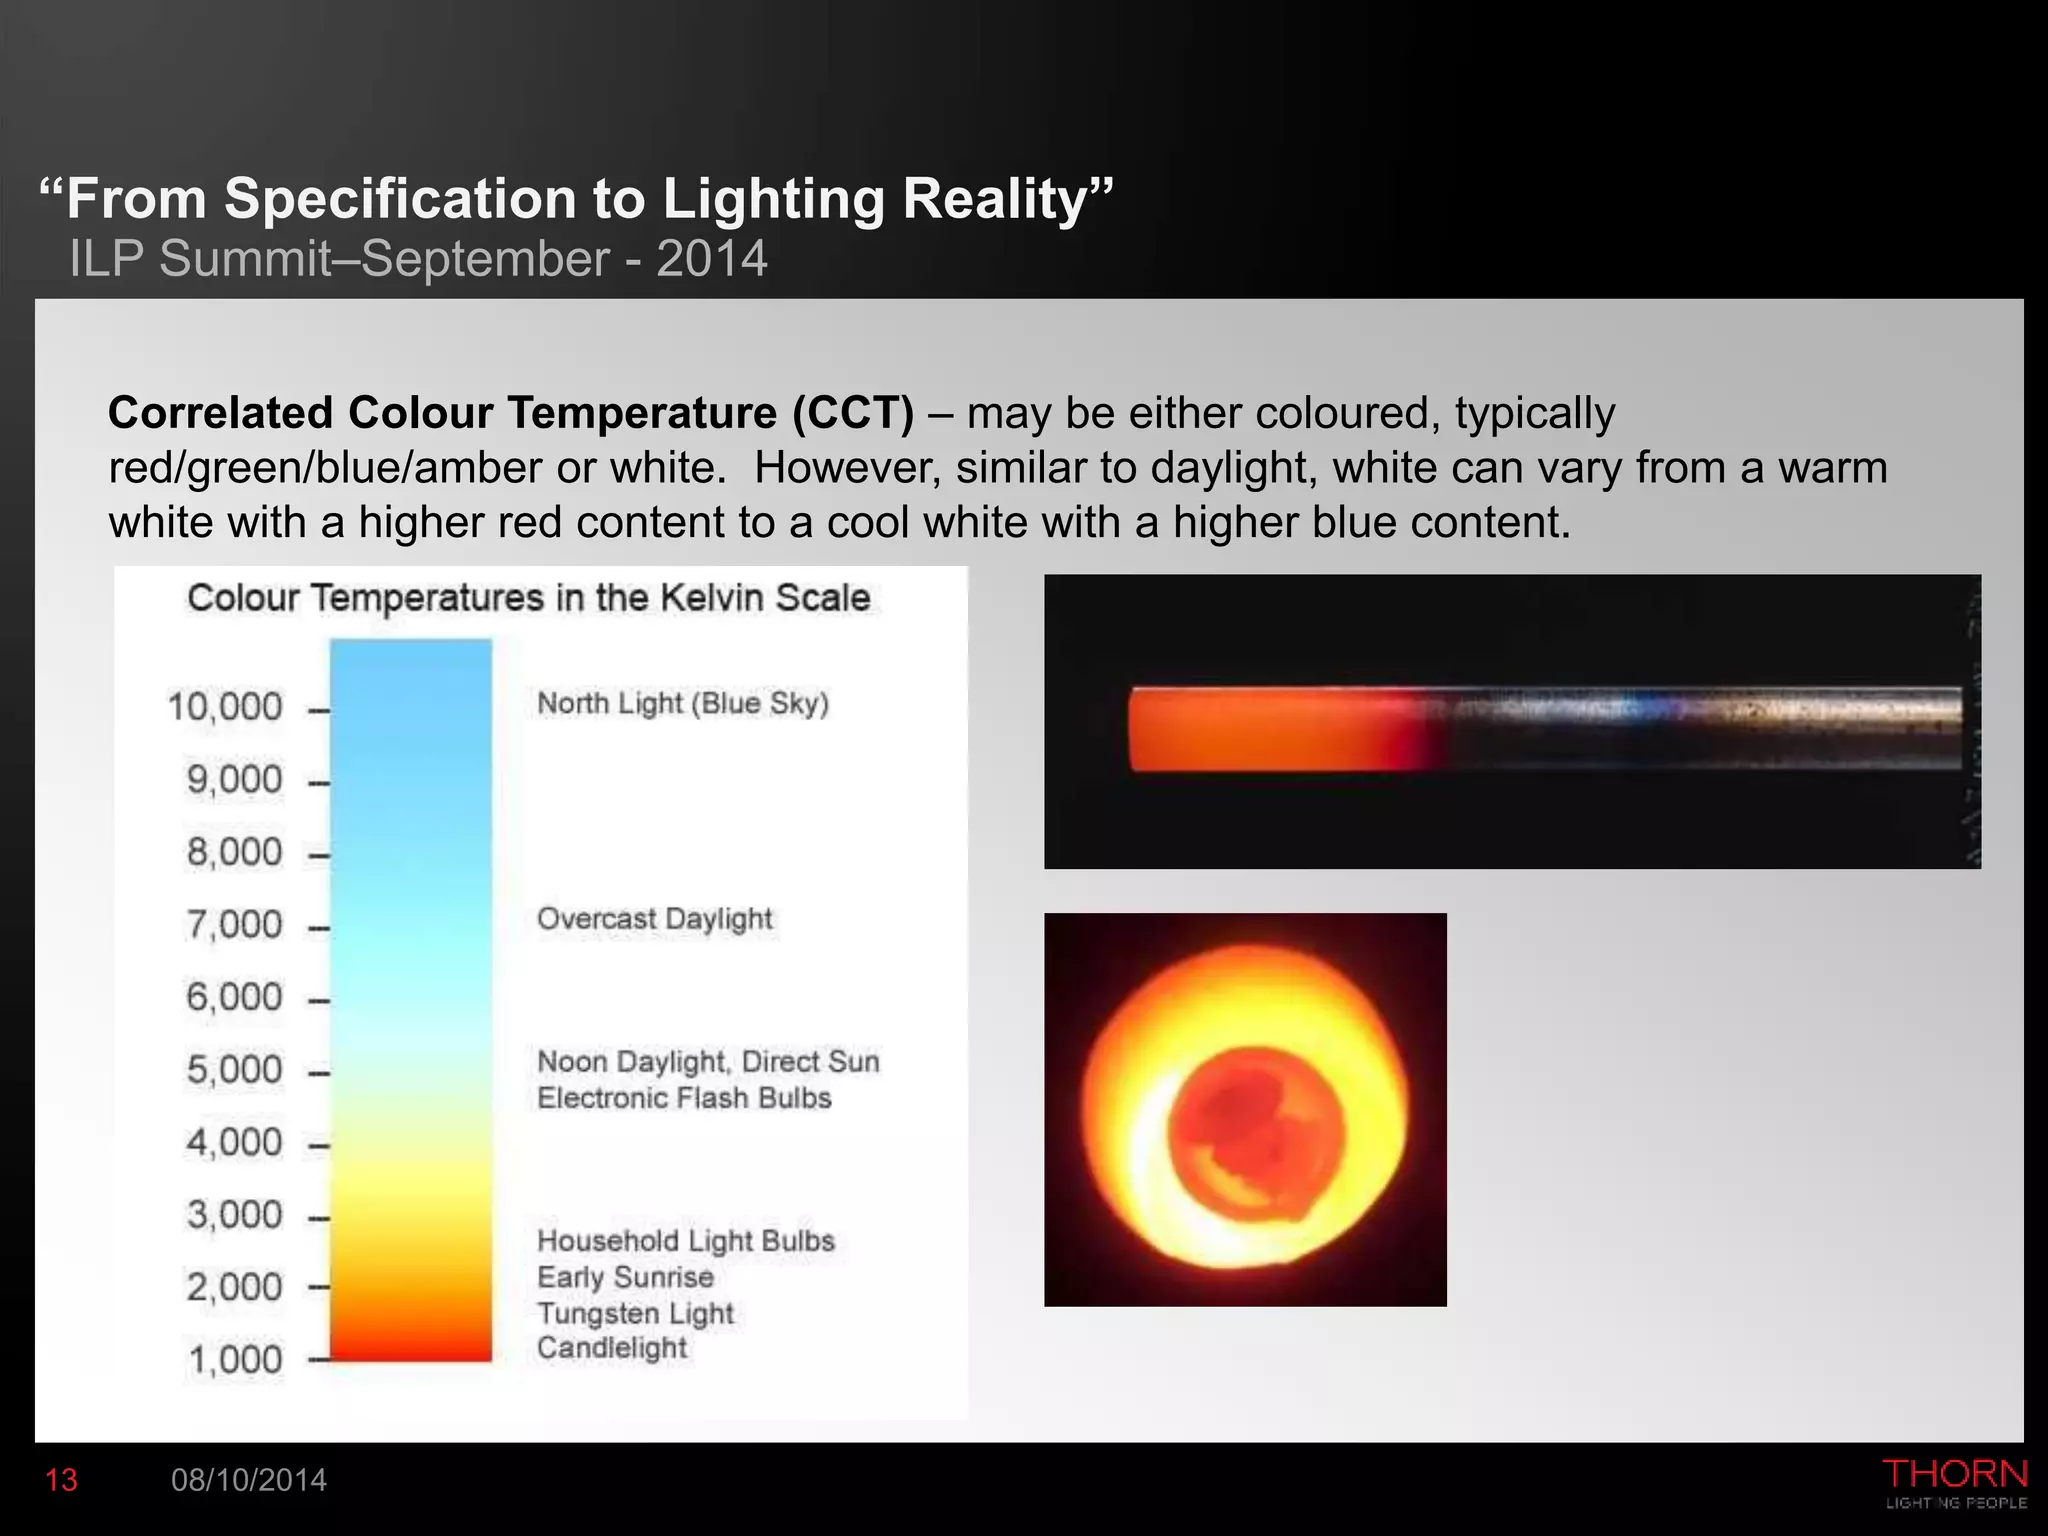
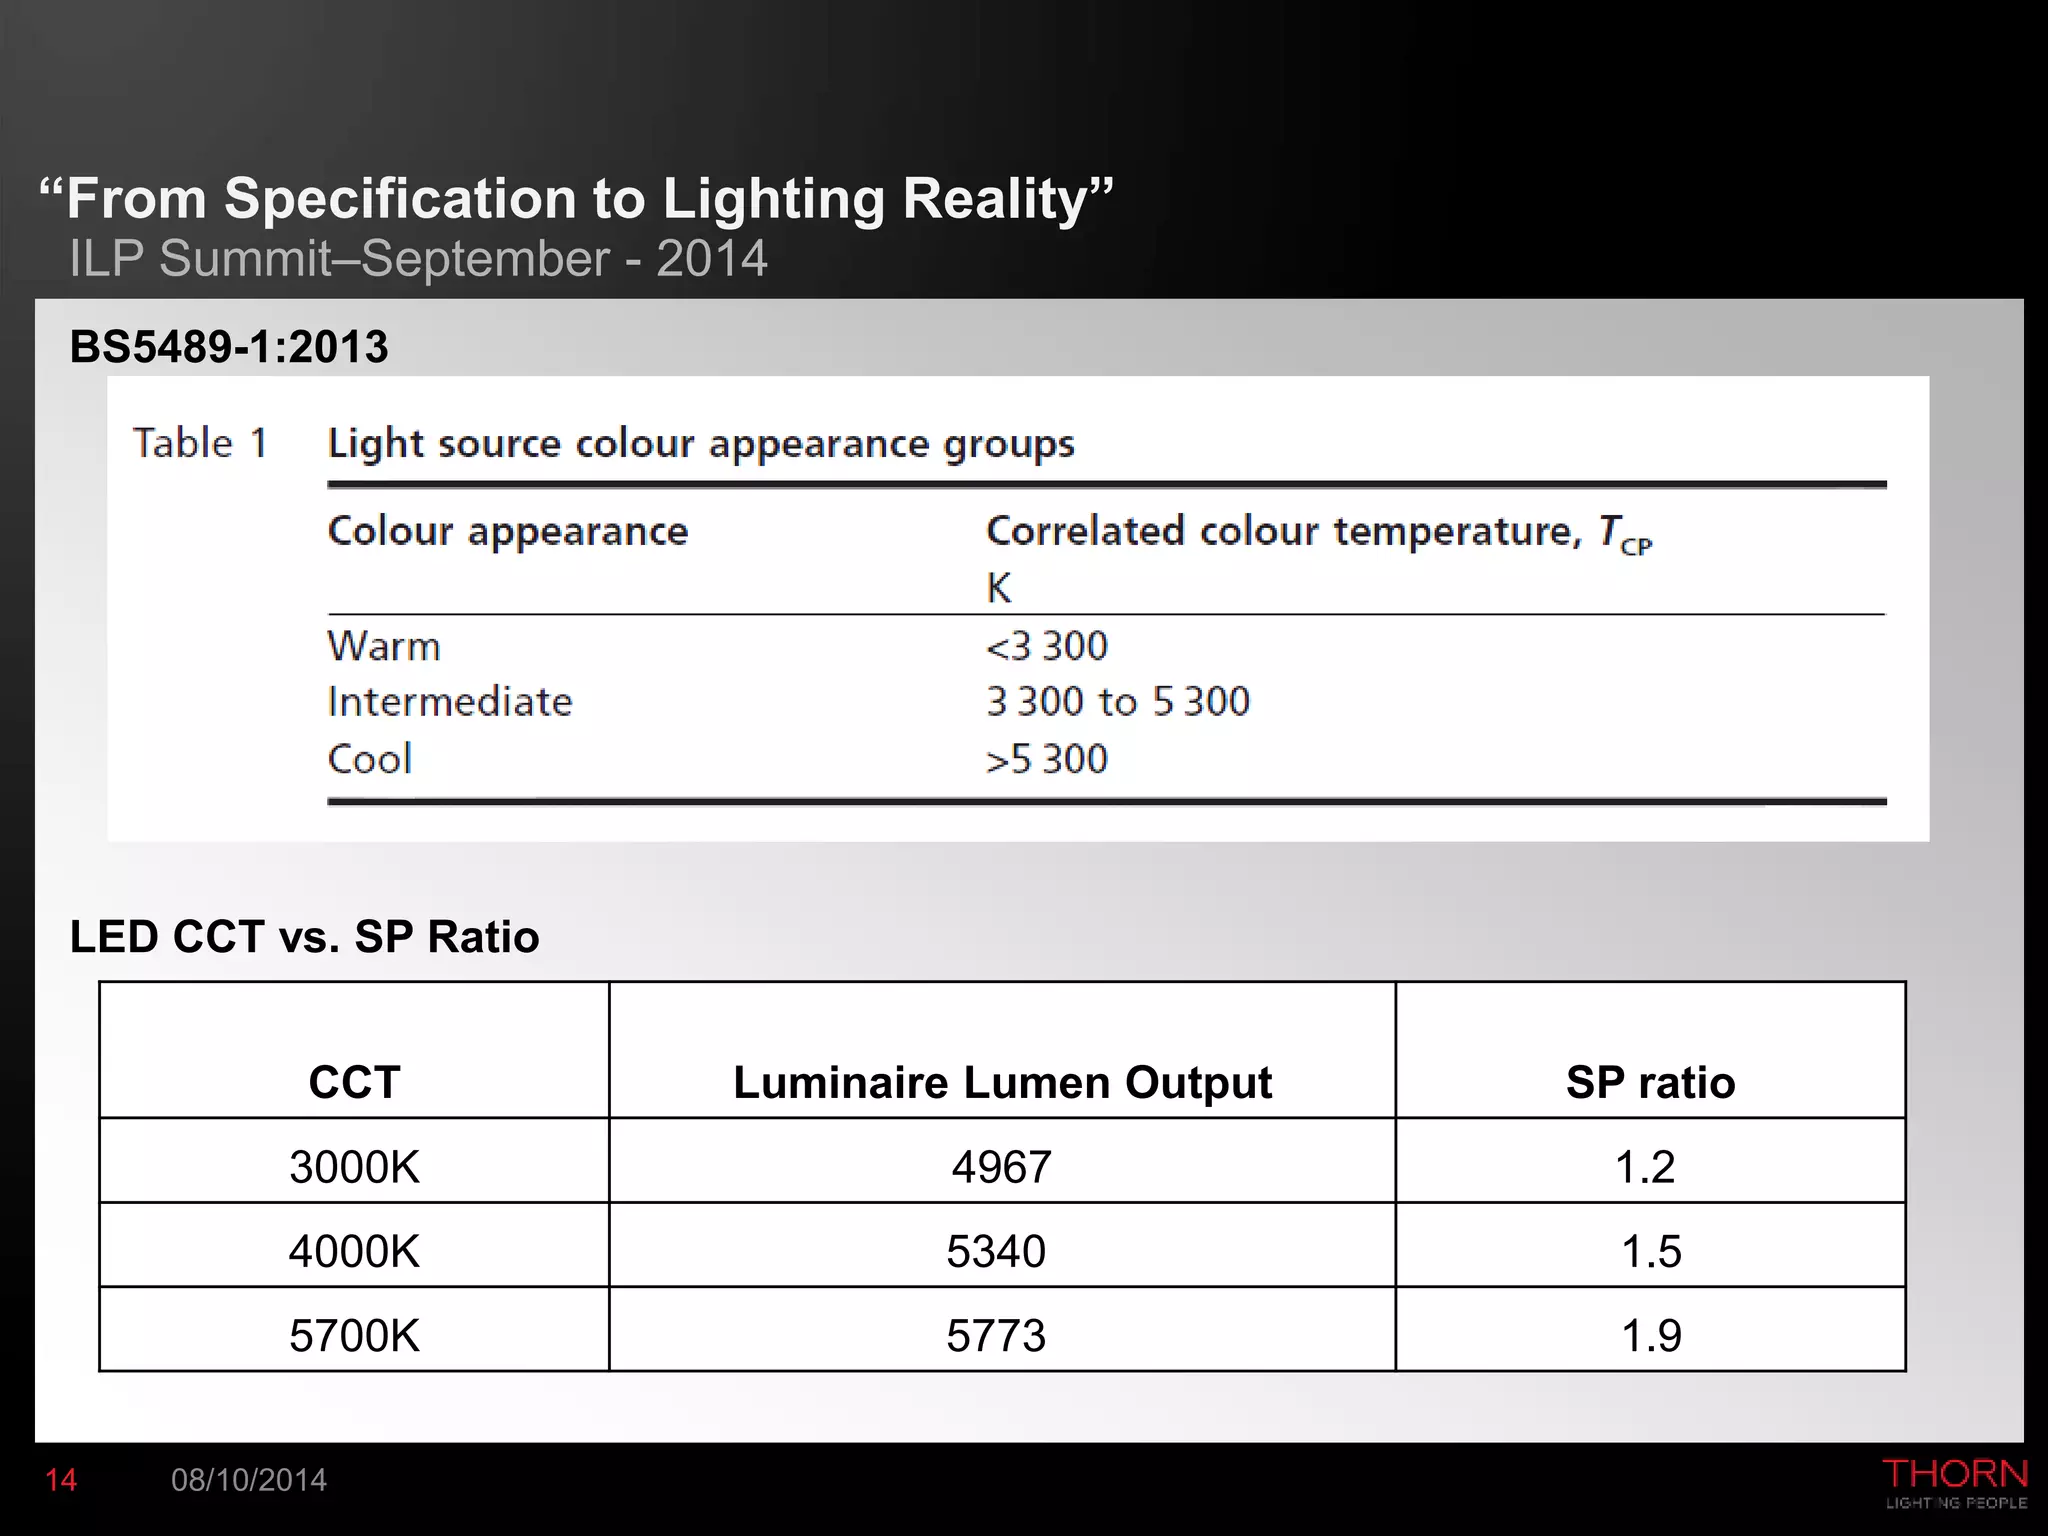
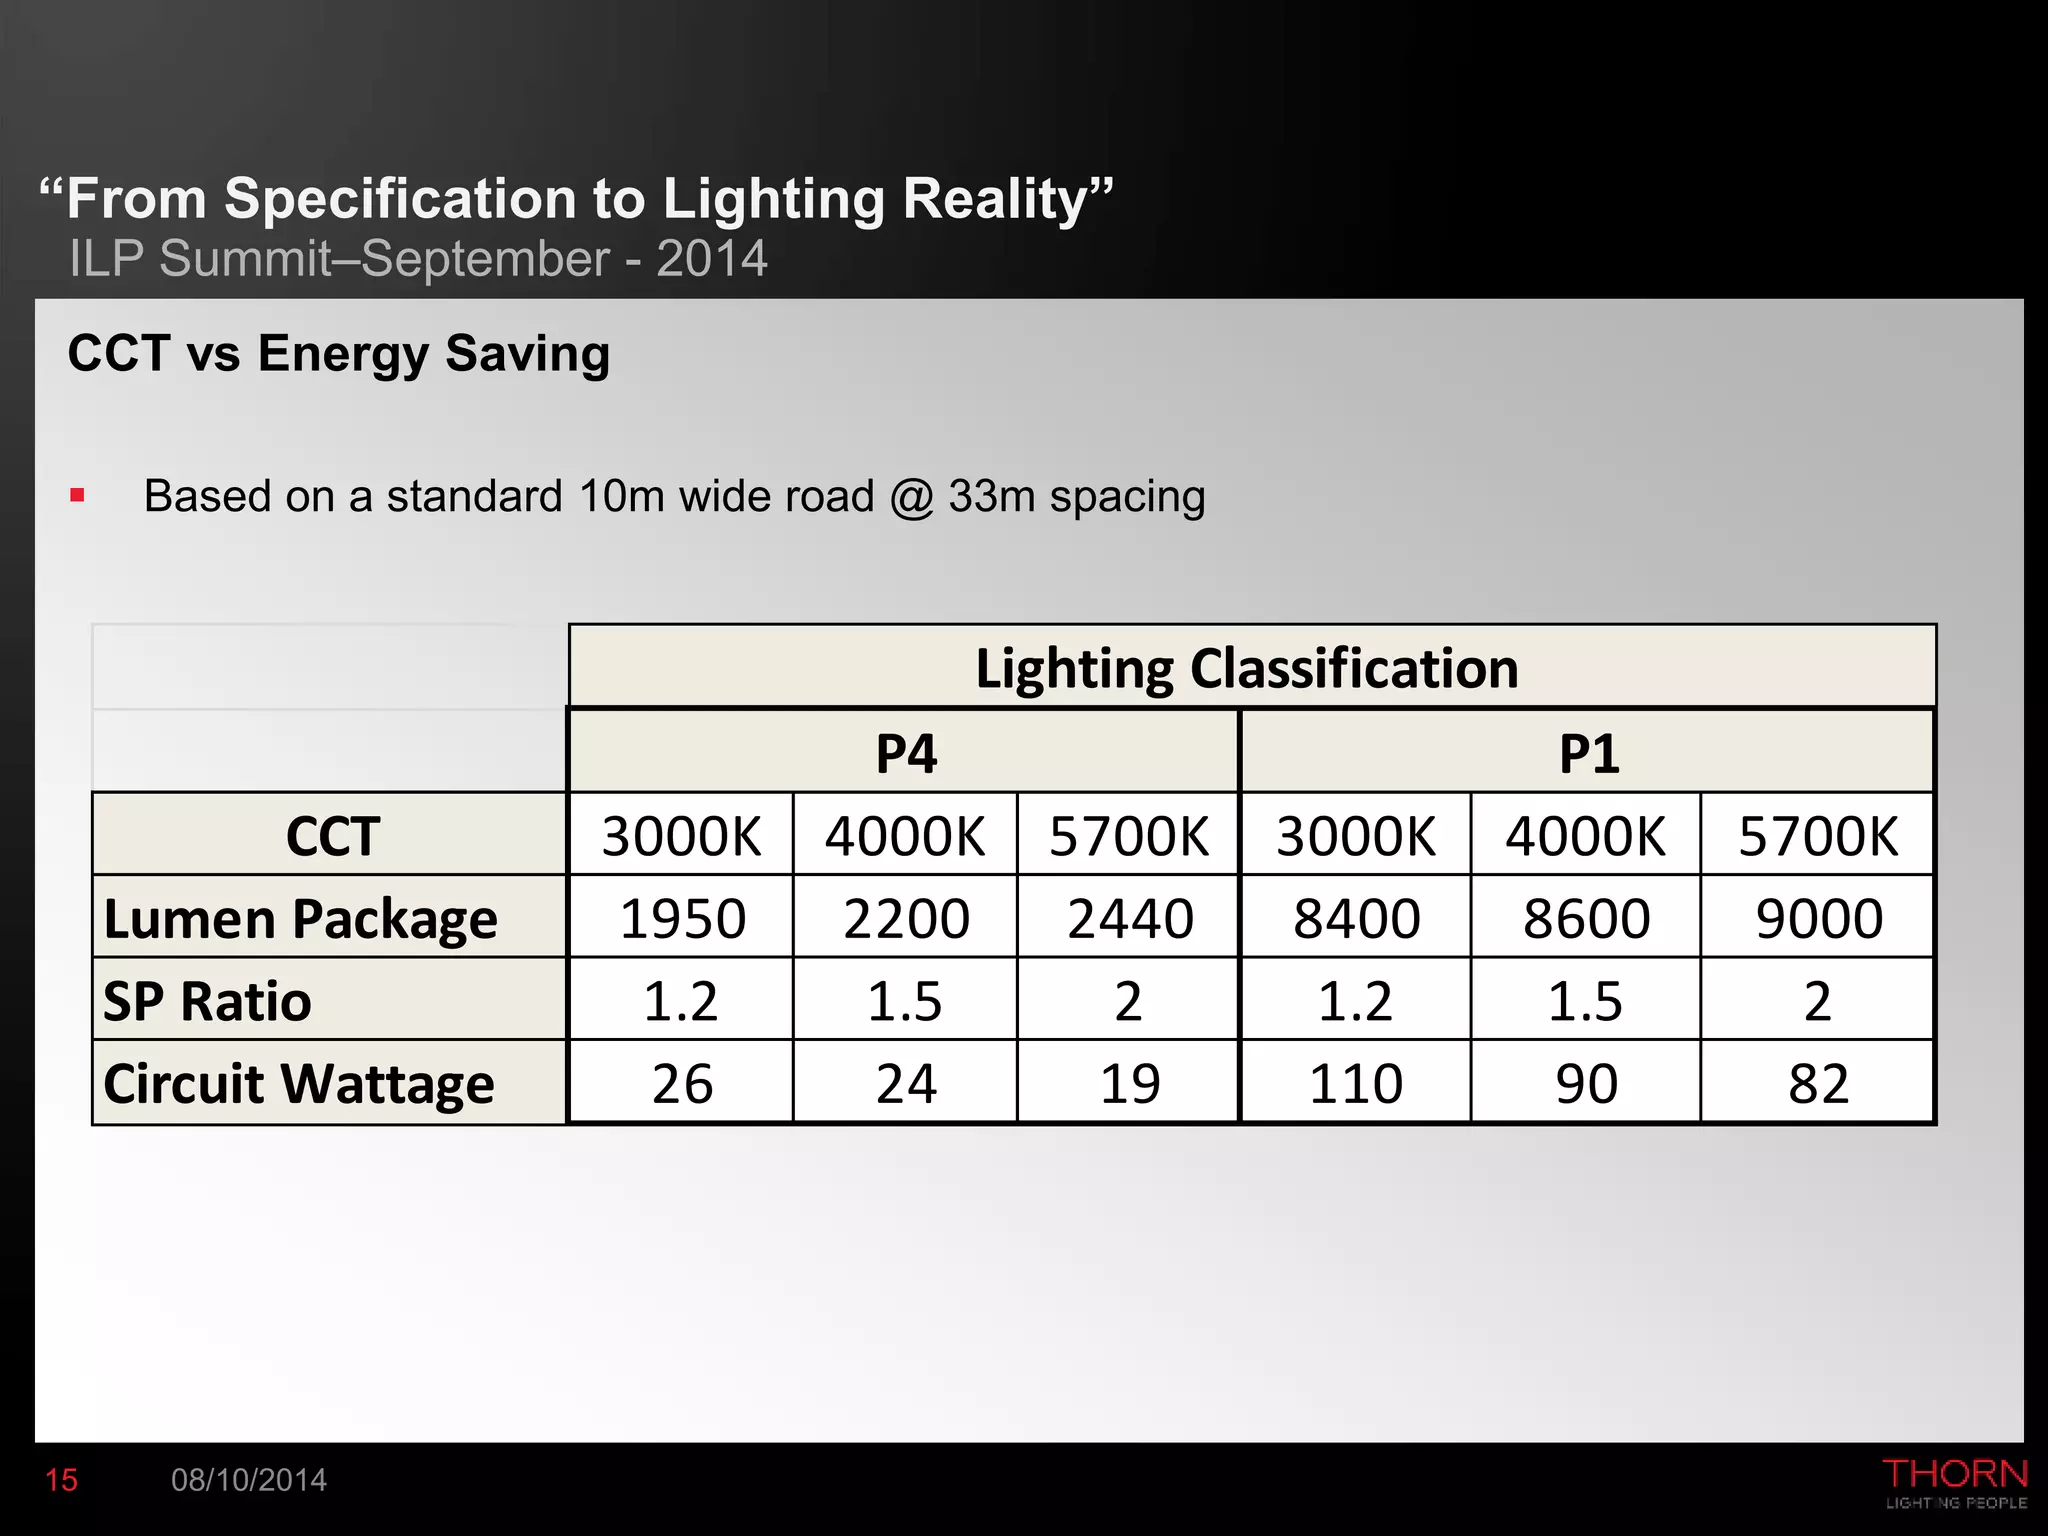
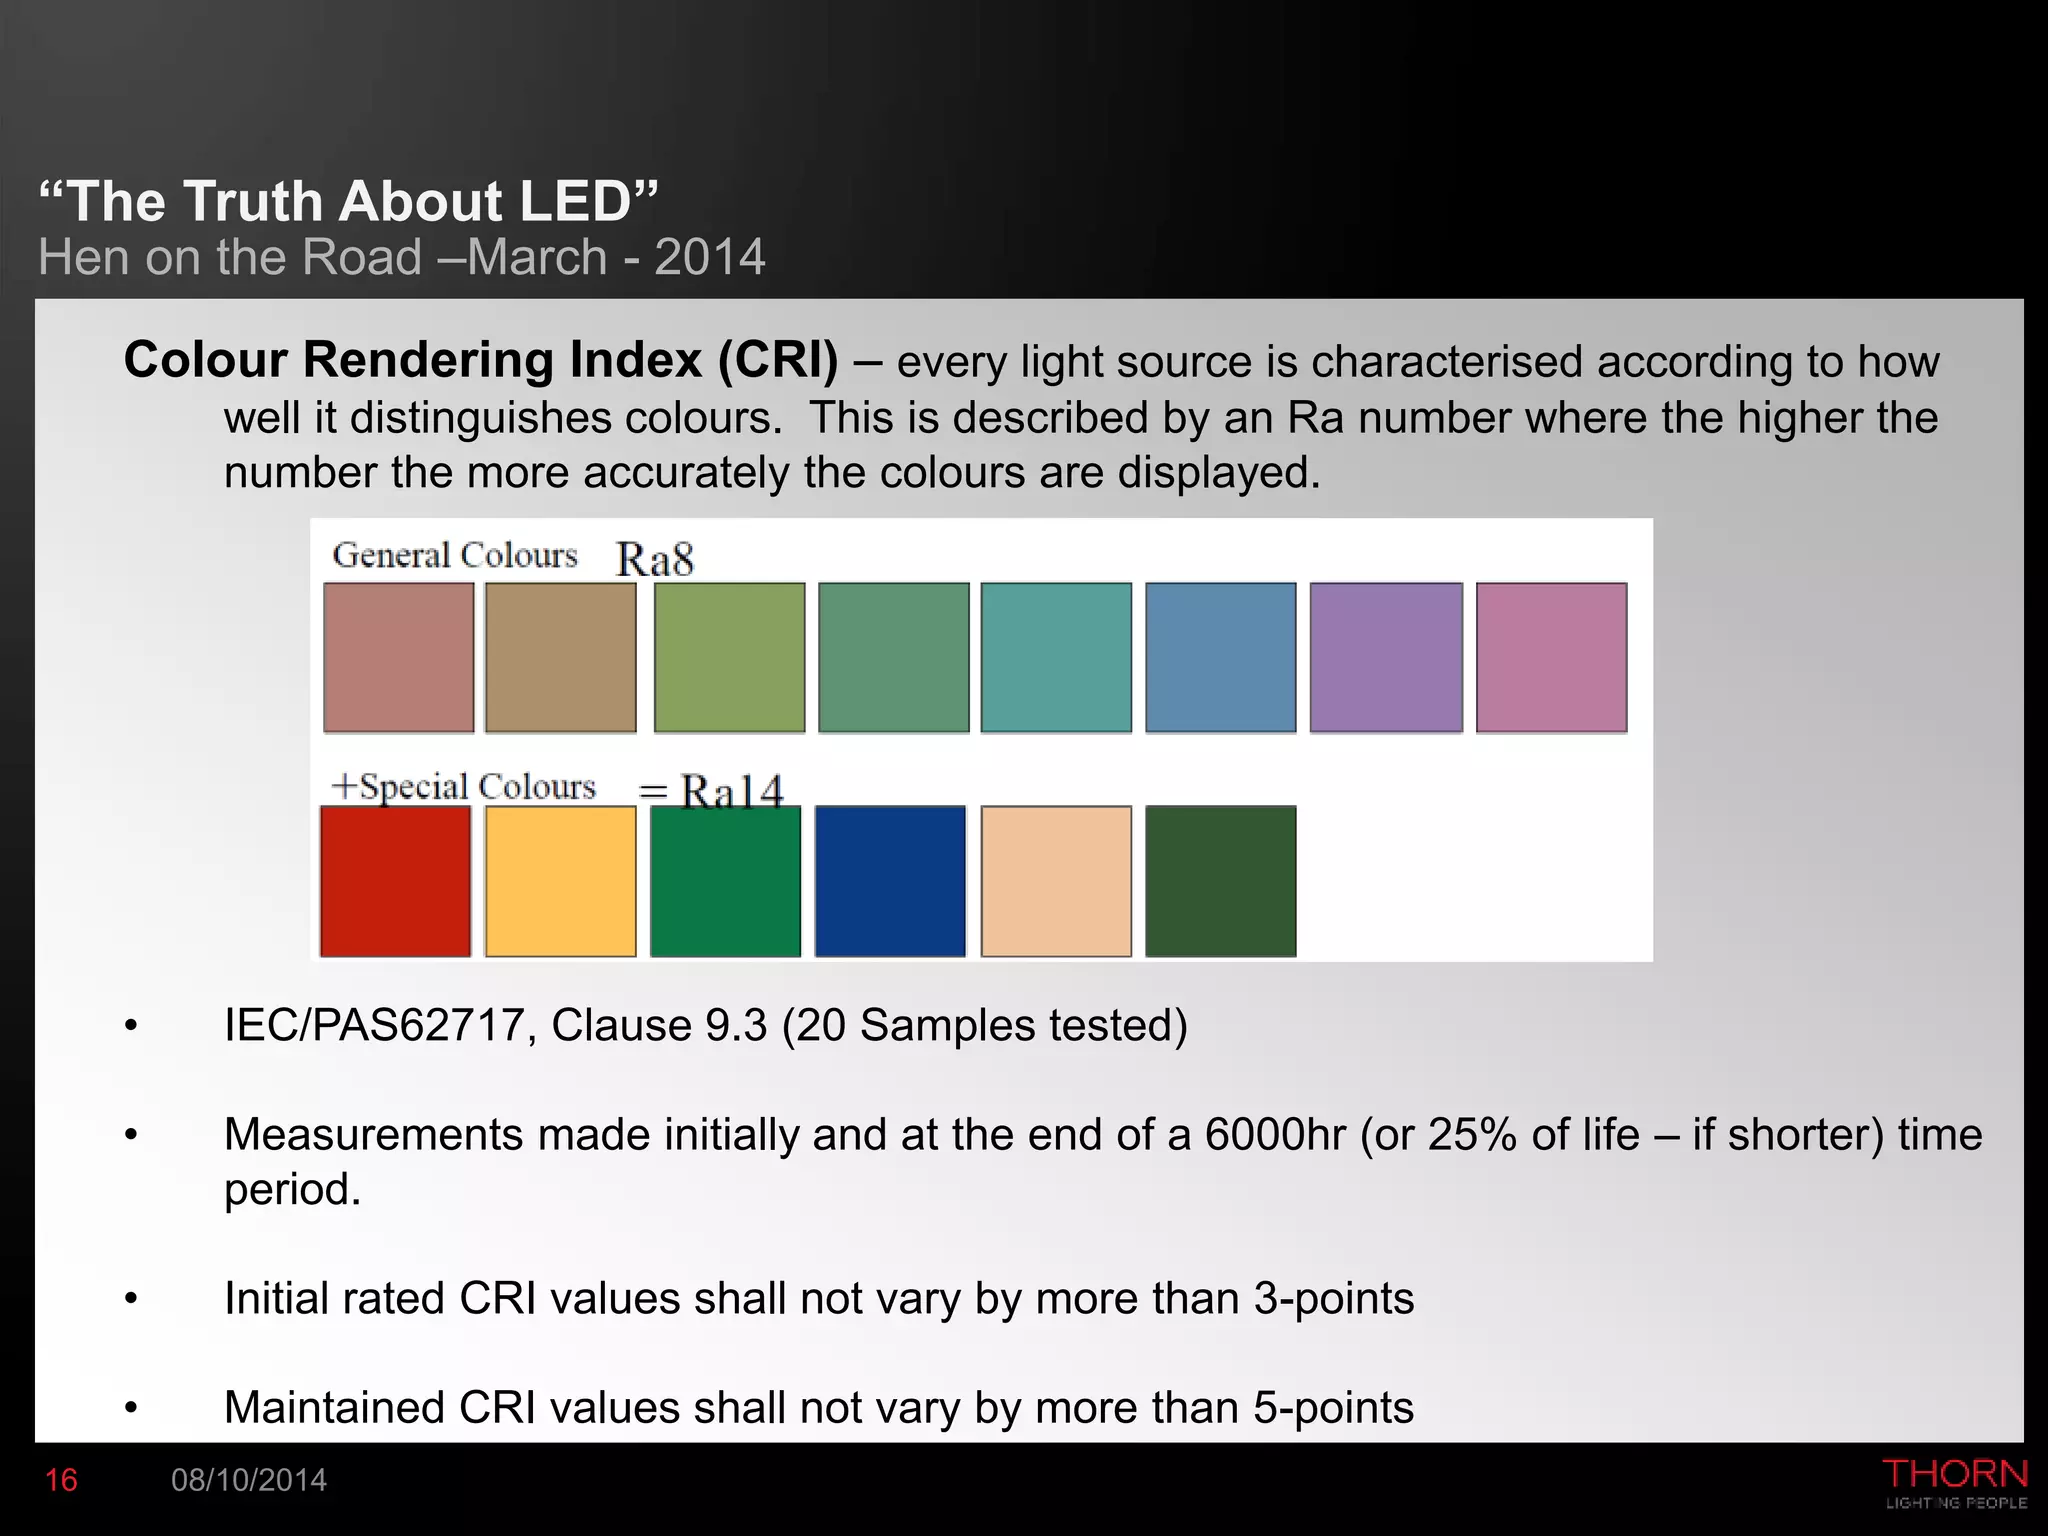
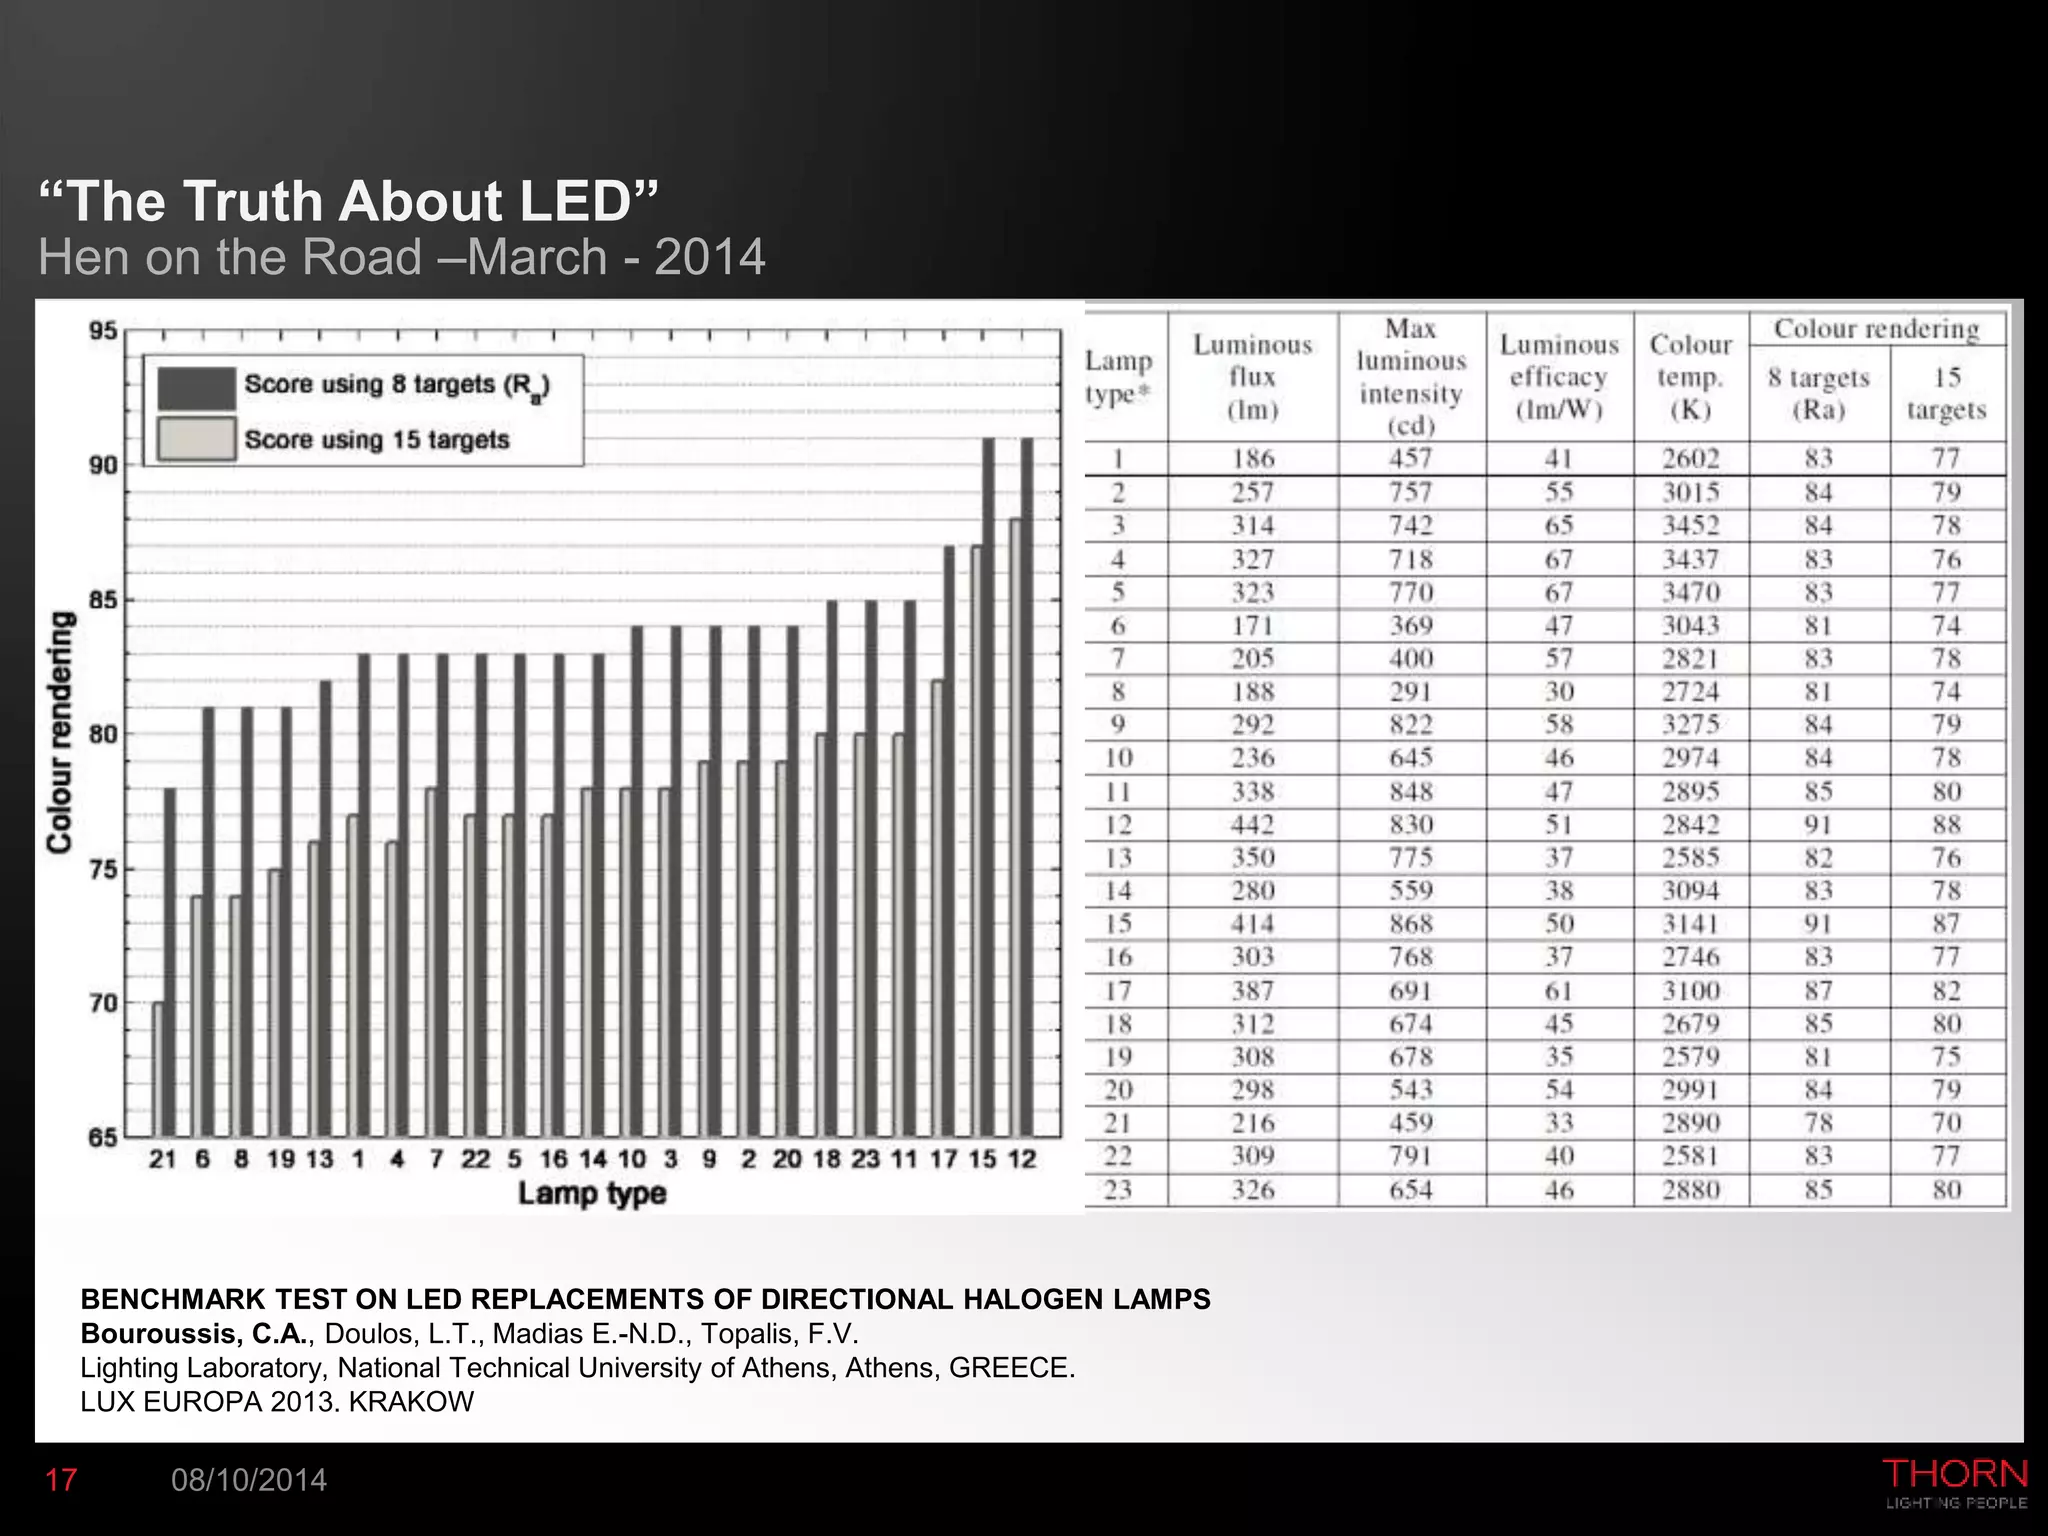
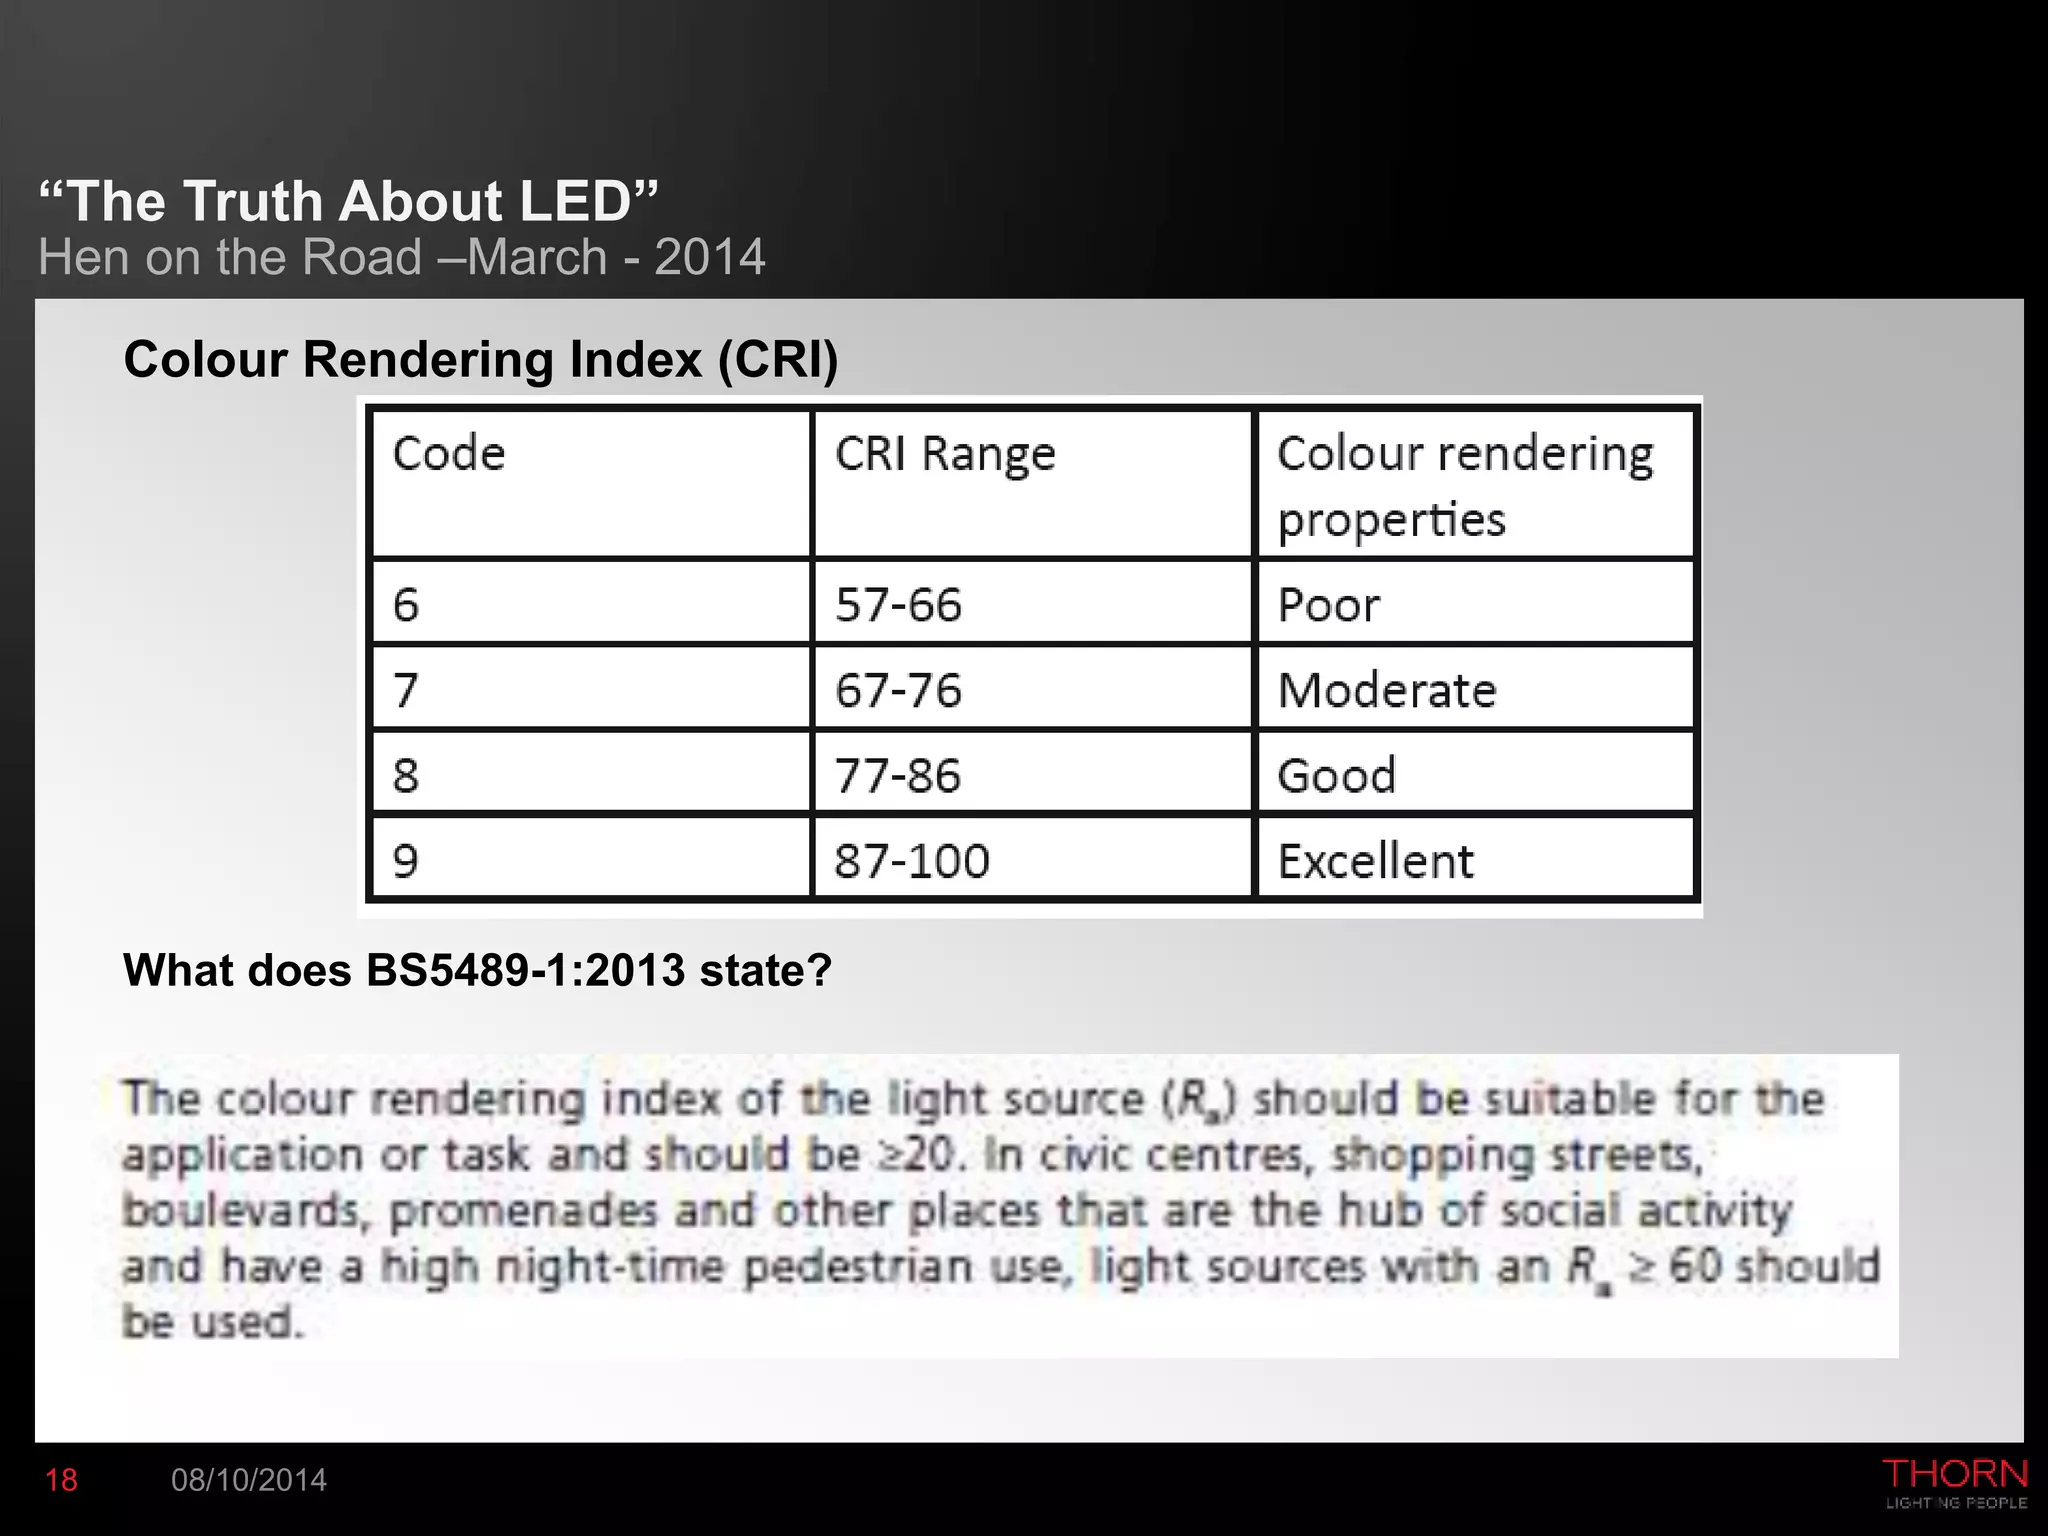
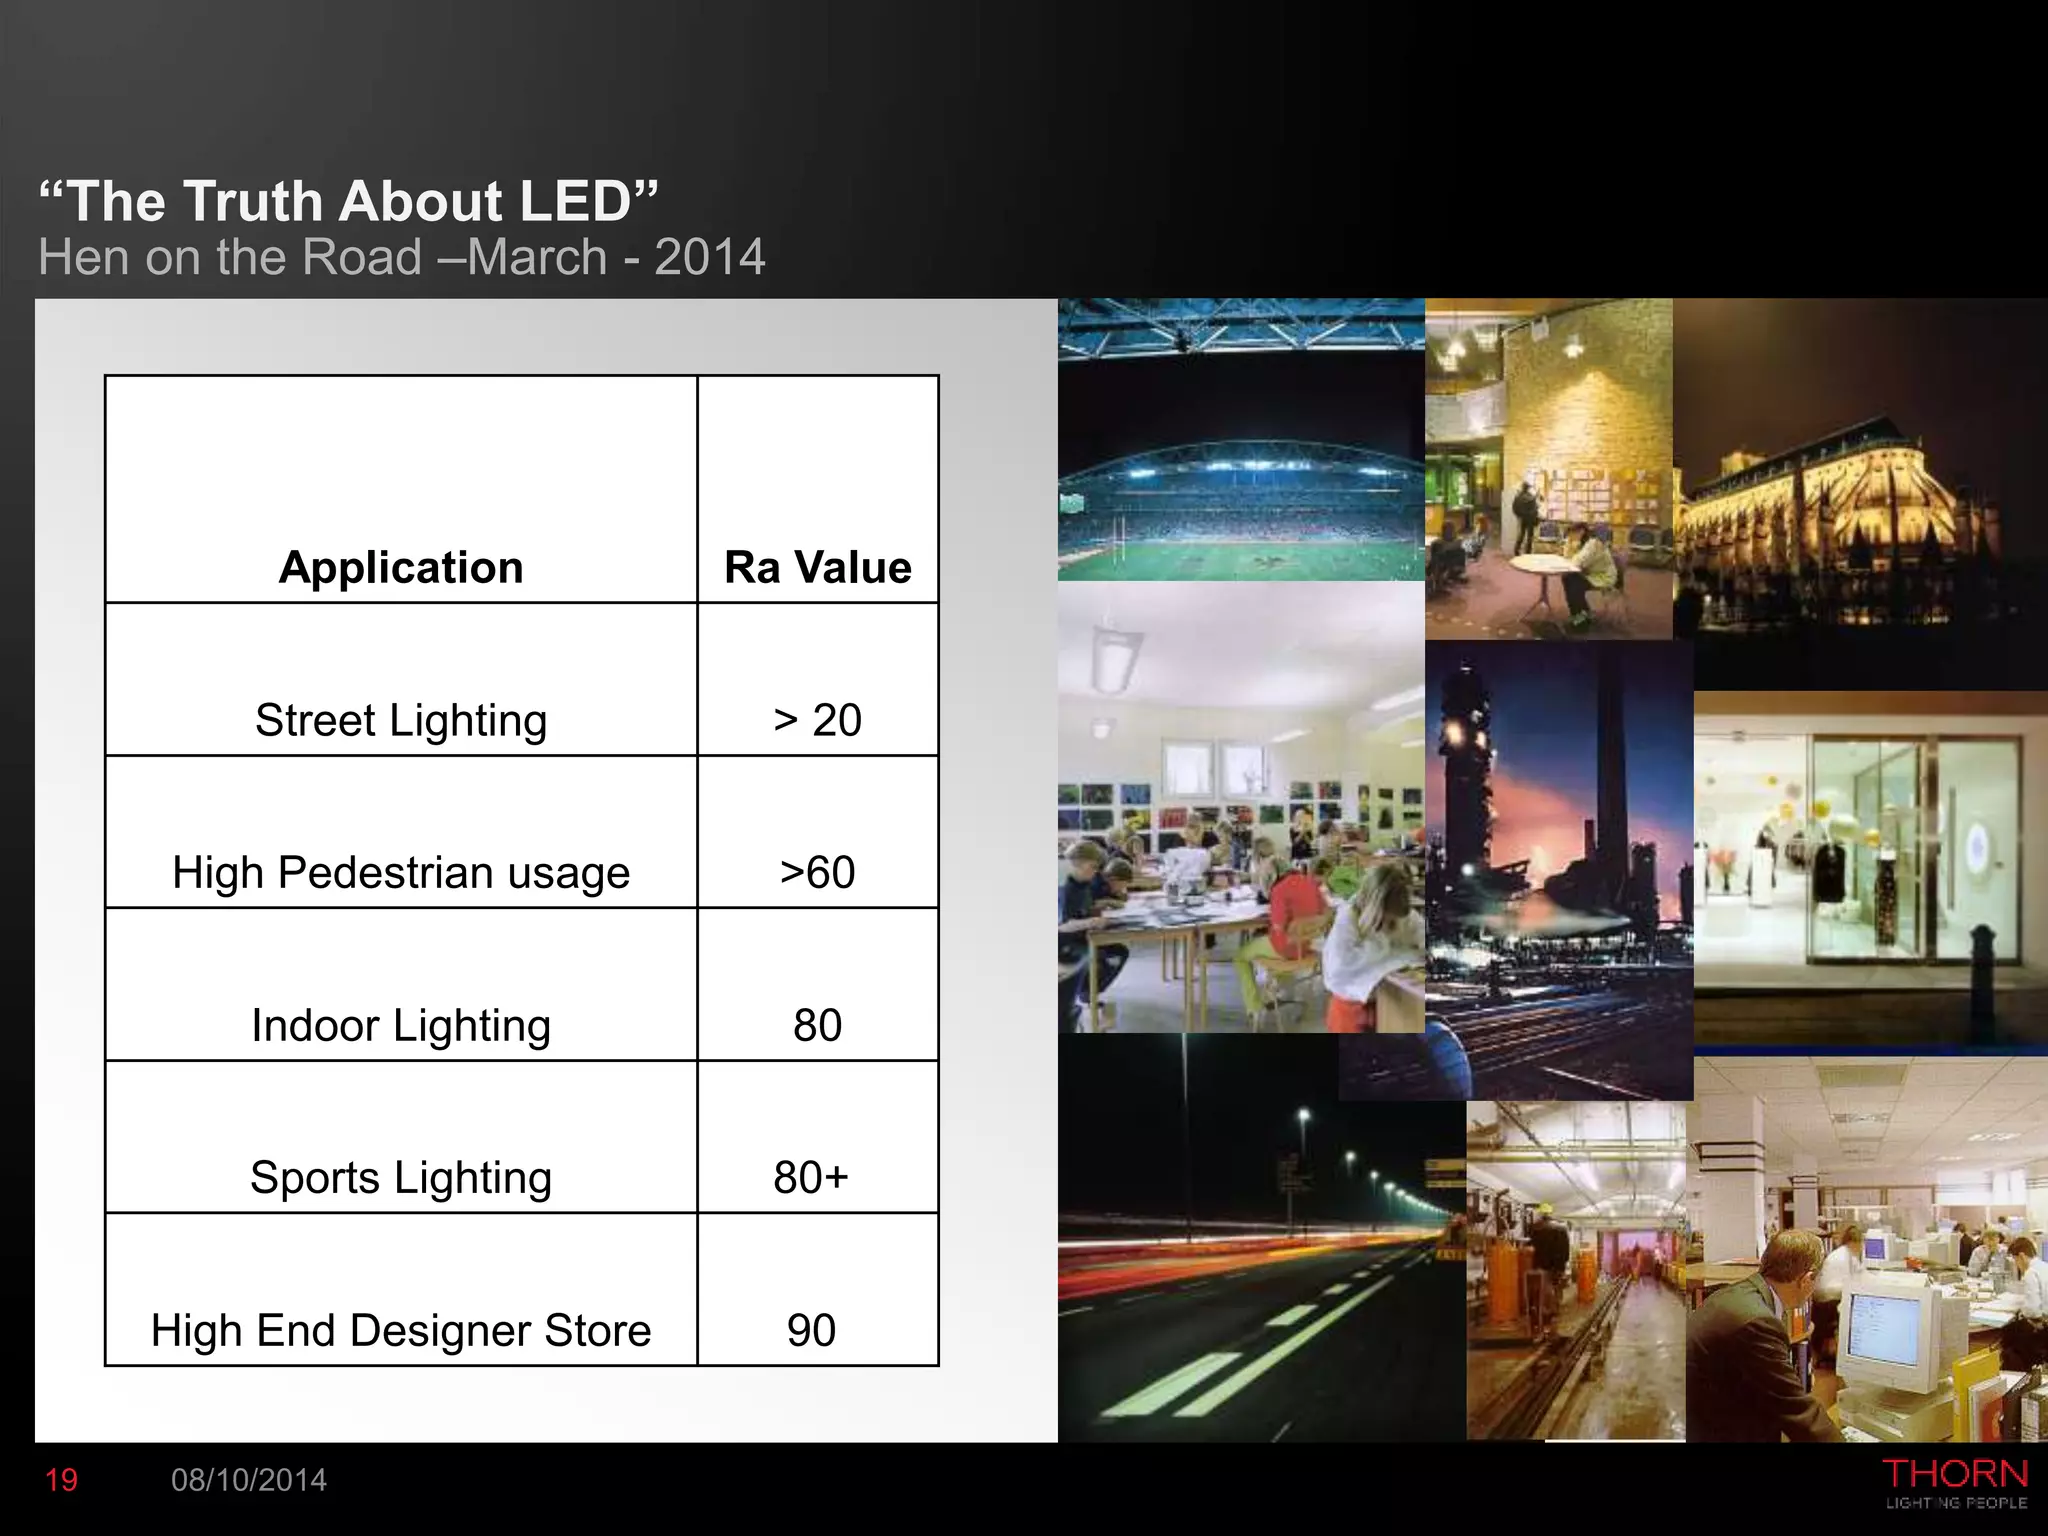
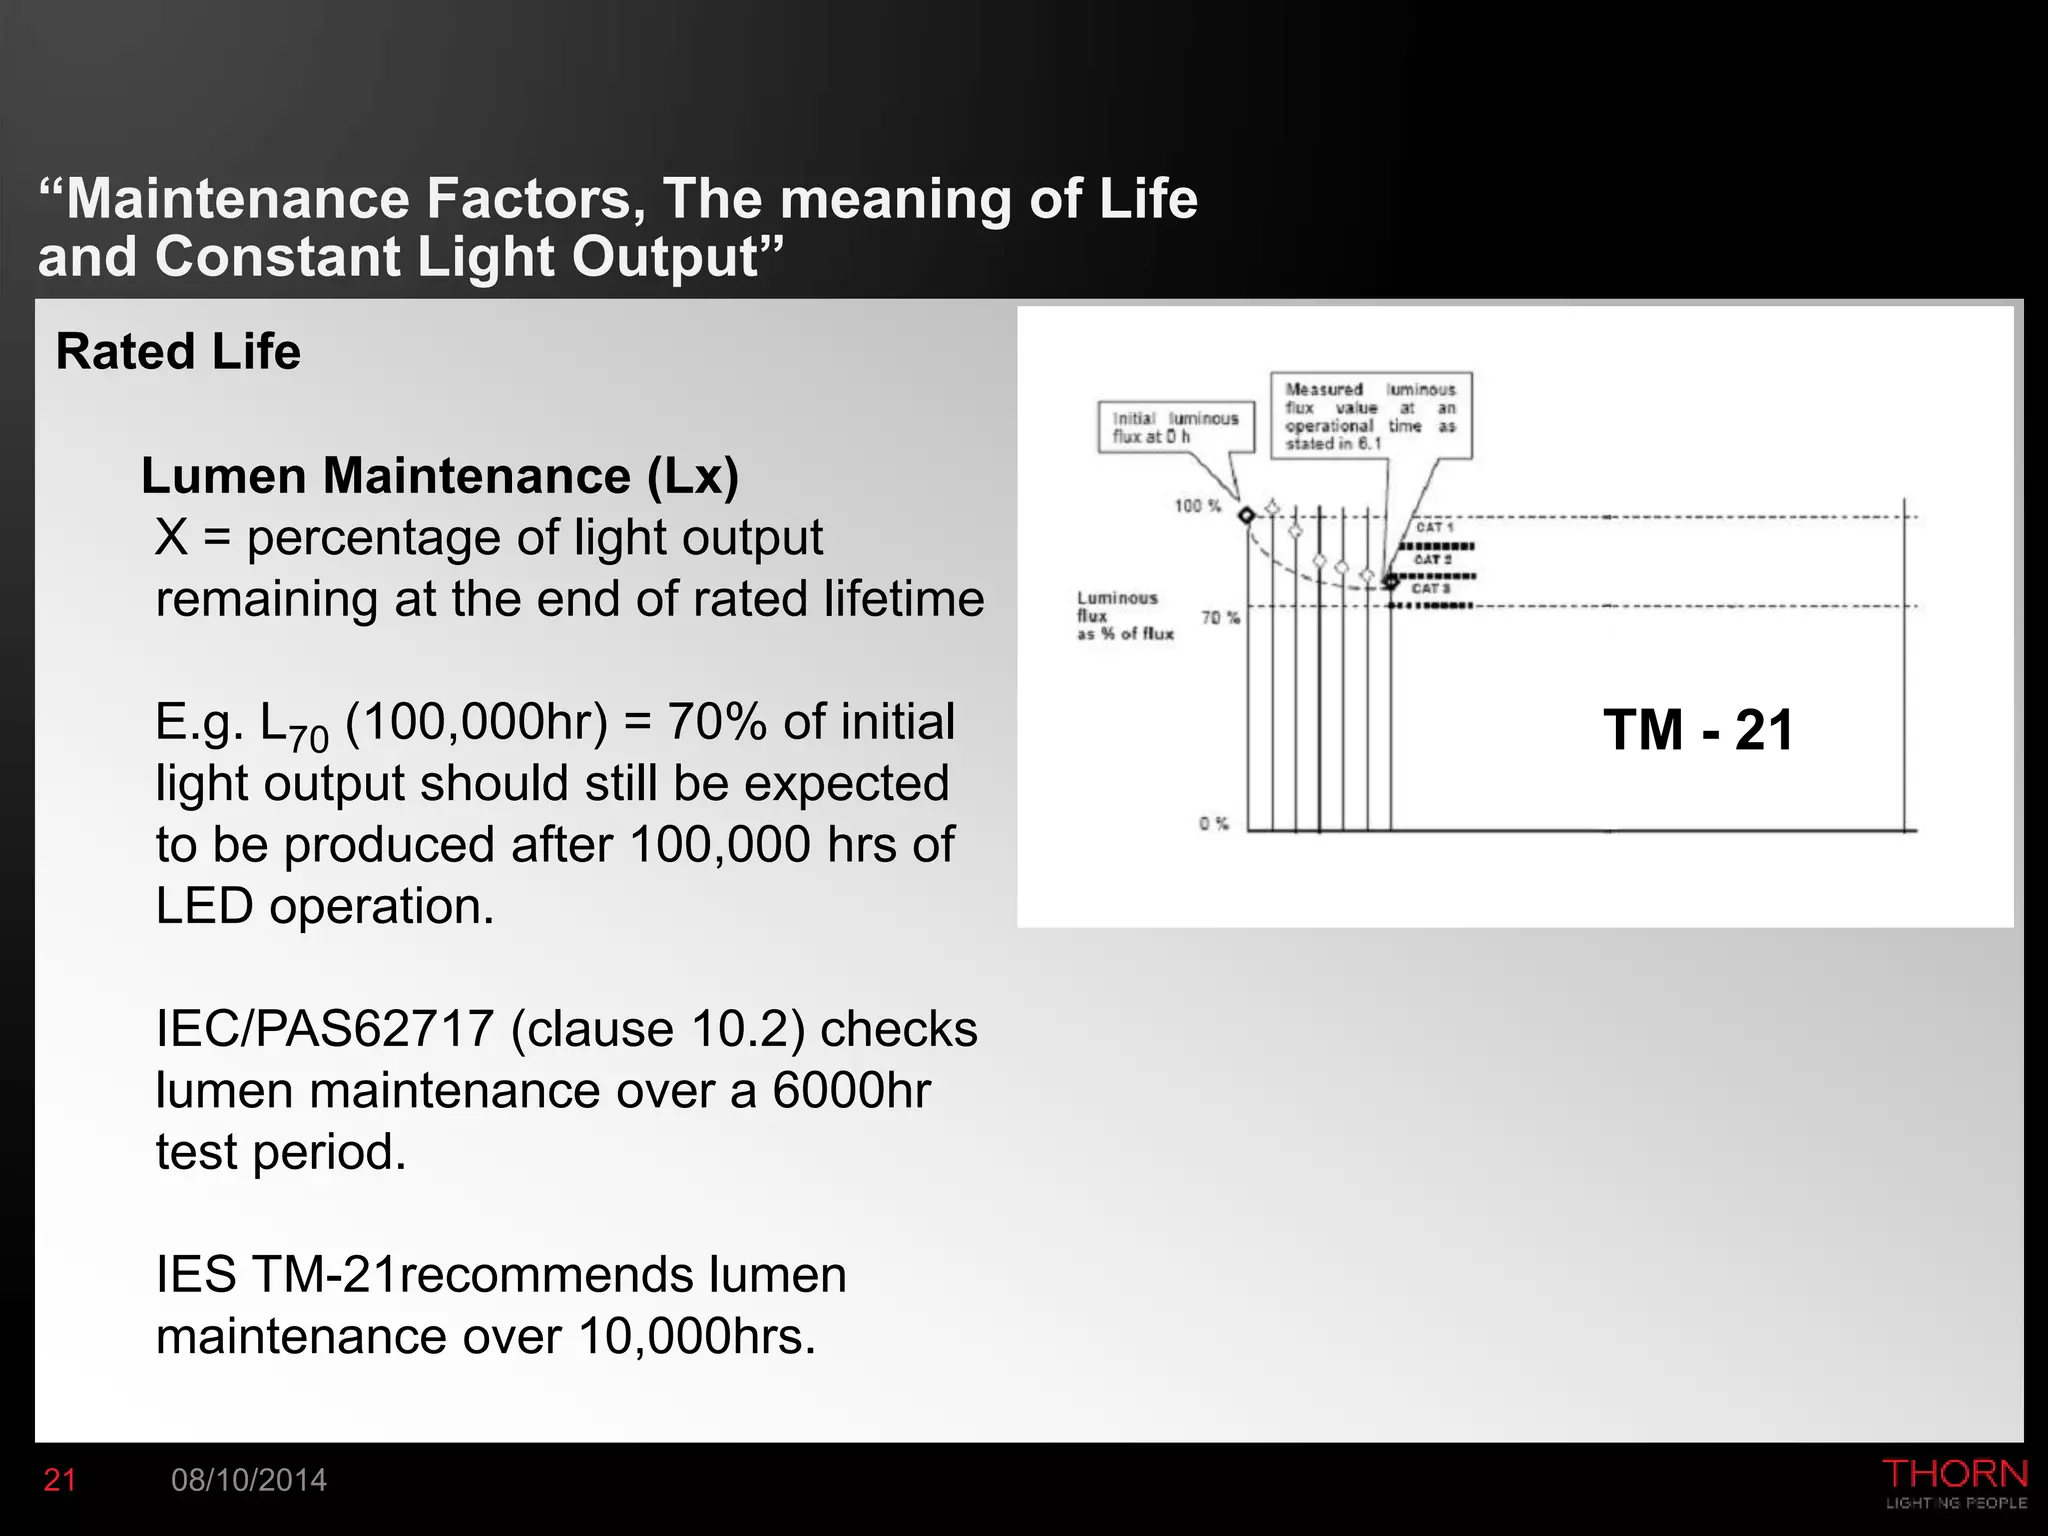
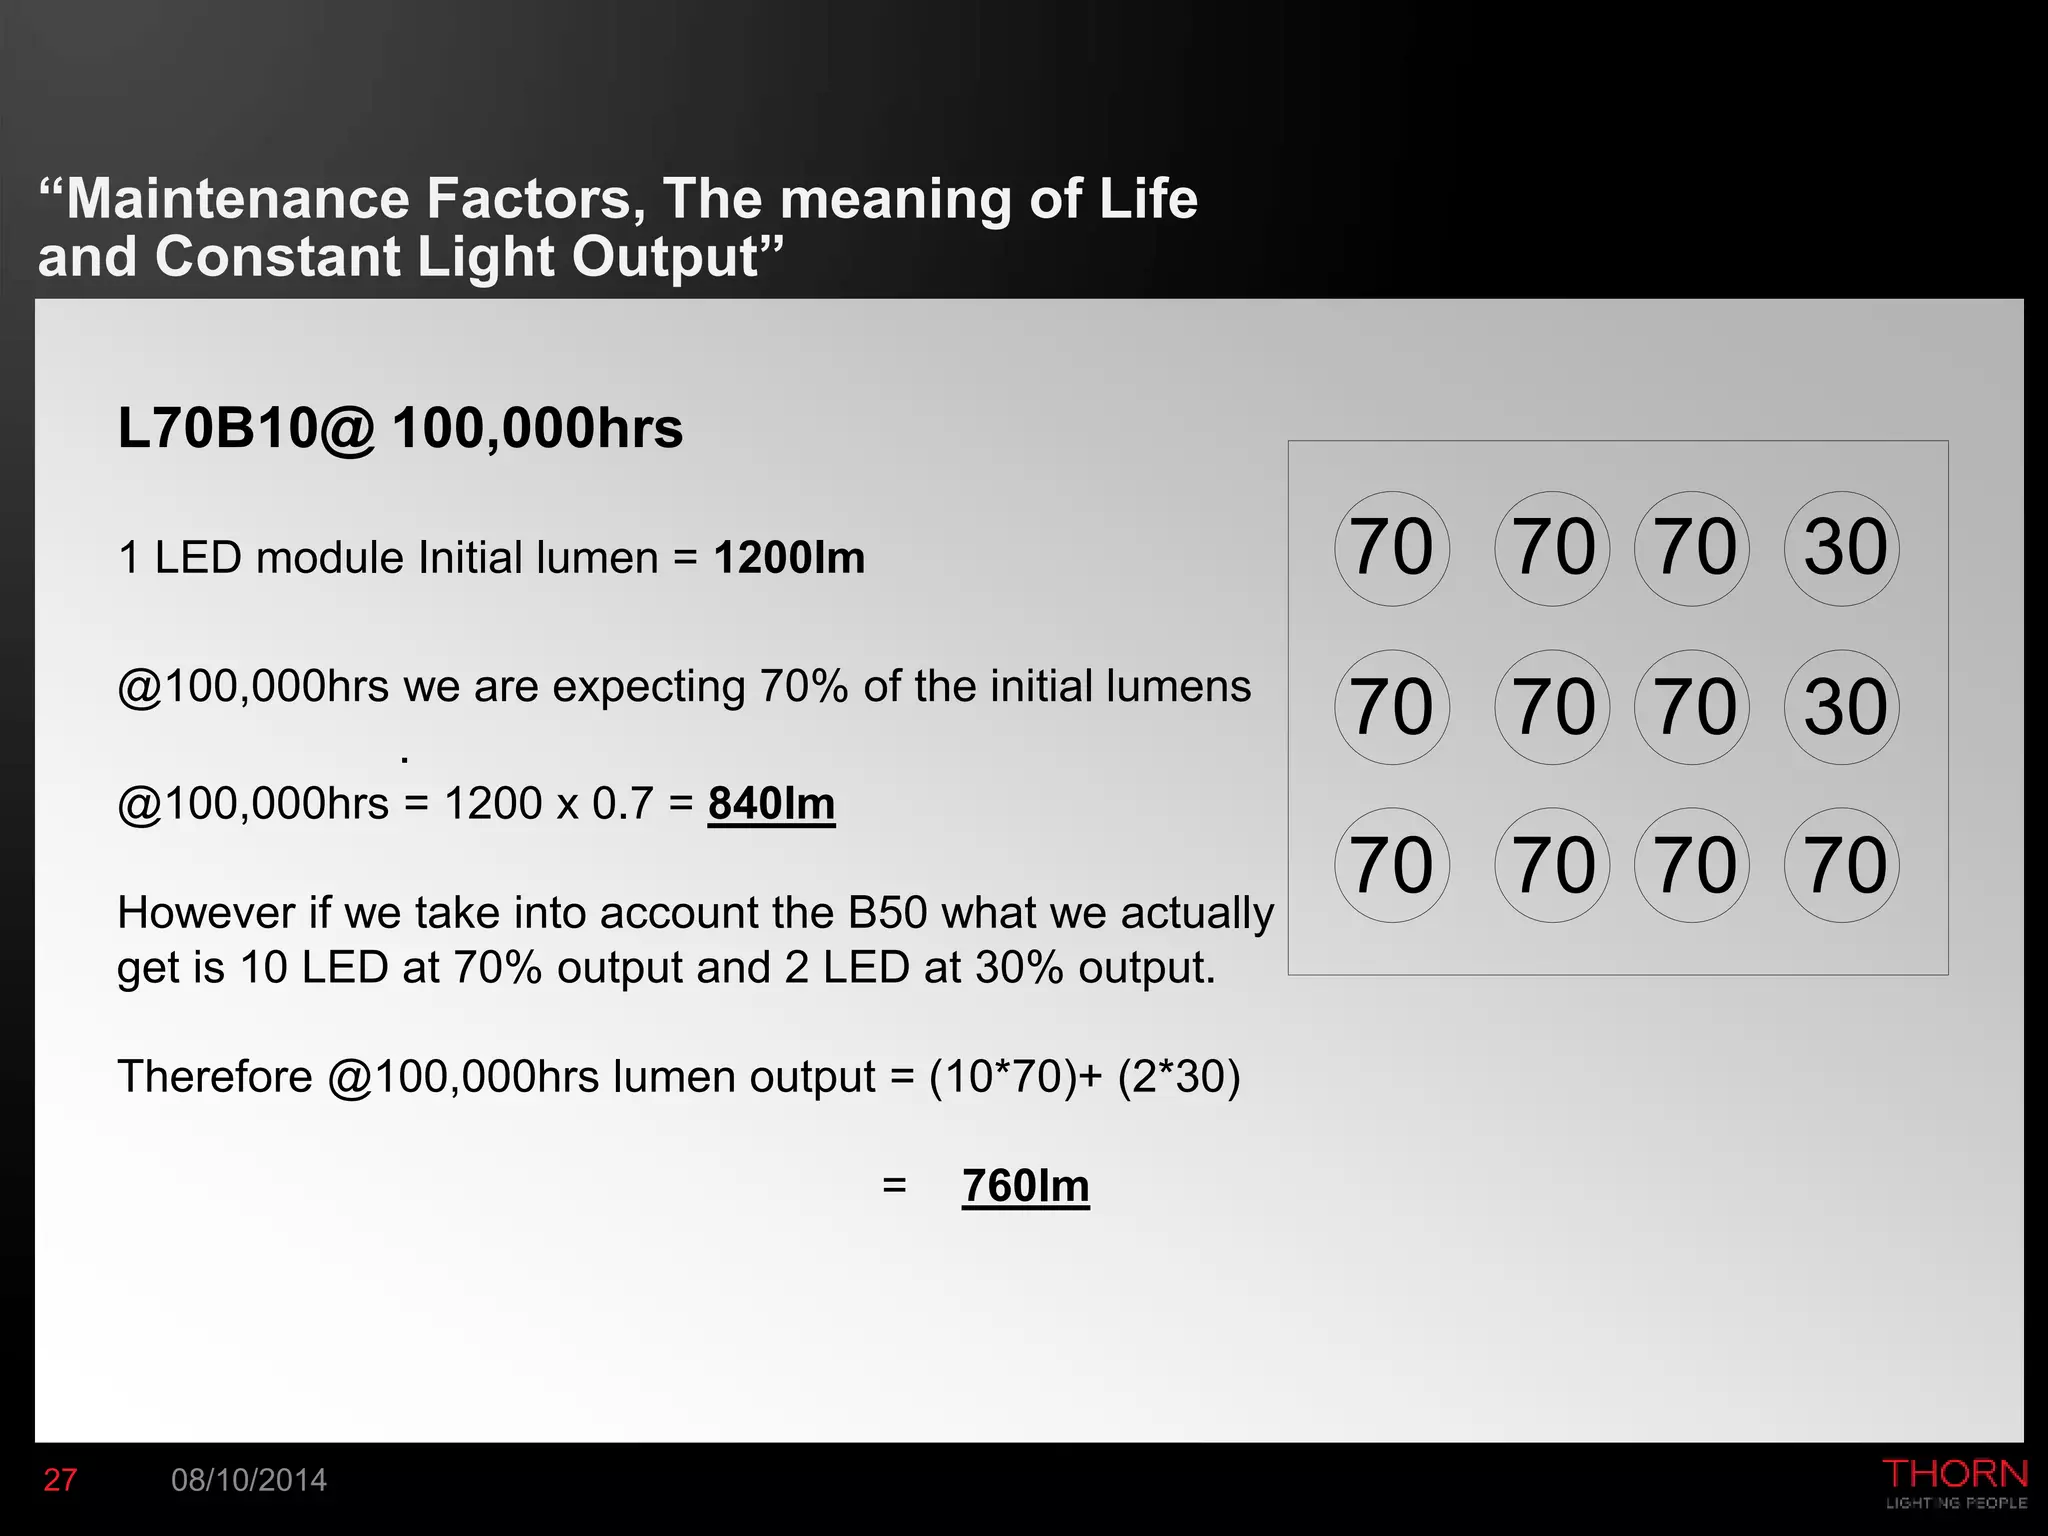
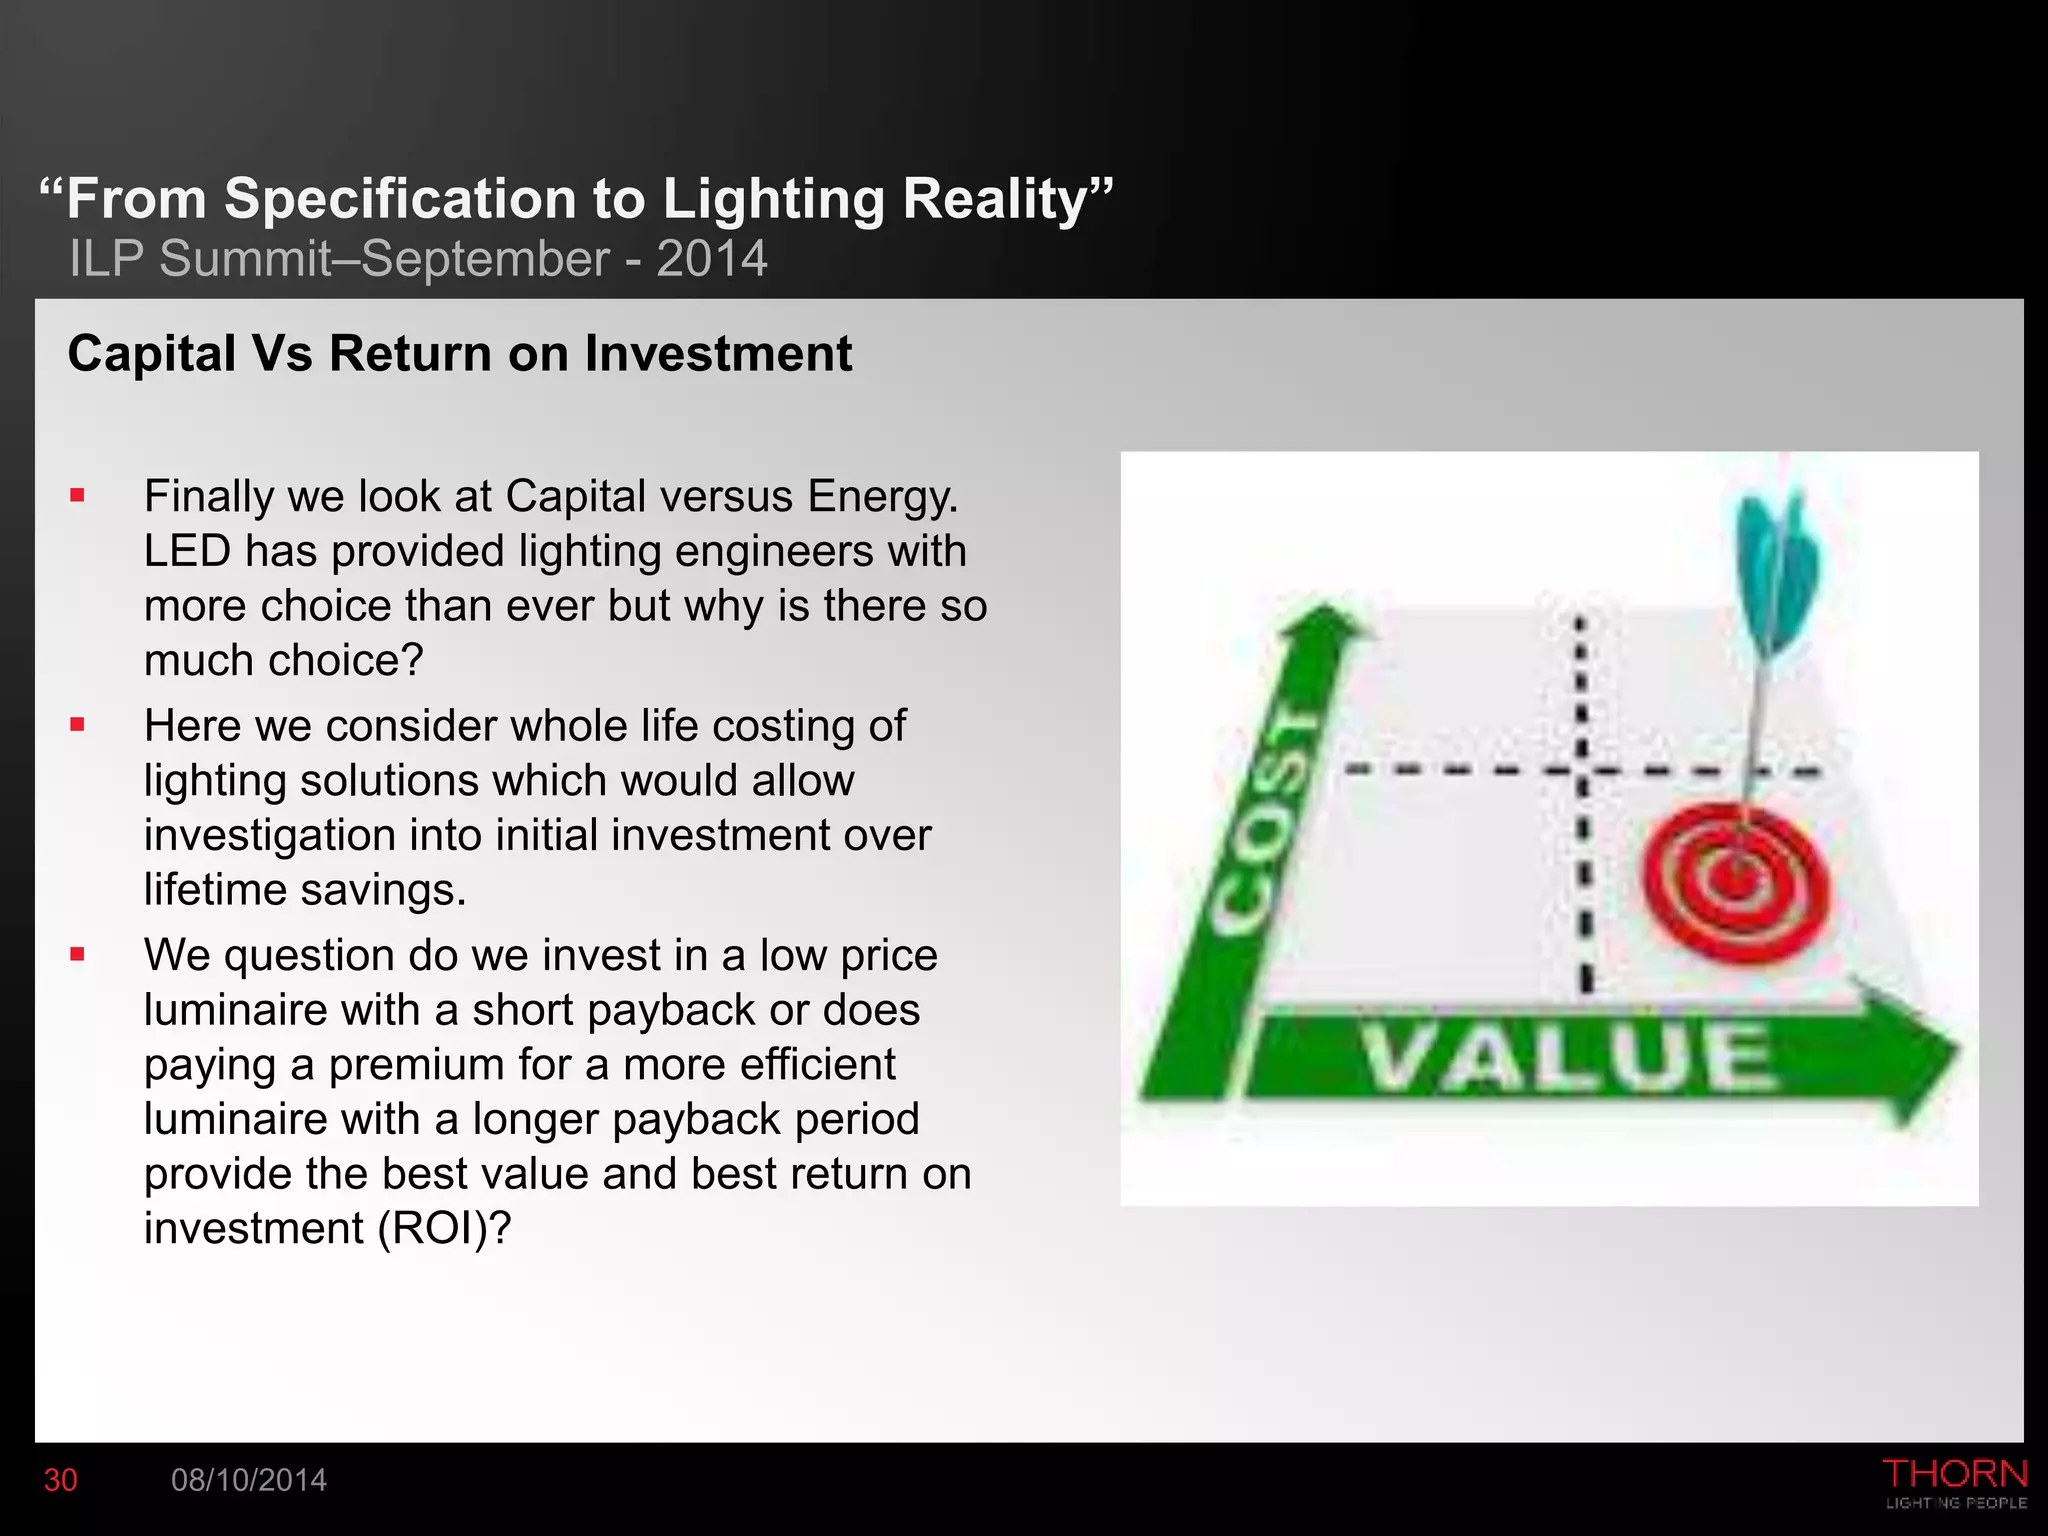
A look into how LED specifications determine our lighting solutions and in reality what this data means when carrying out our lighting designs. As more and more Local Authorities specify LED lighting solutions this presentation looks at how what we specify at tender stage affects the lighting solution provided in terms of energy efficiency and lighting design.
Talk by Emily Bolt, Zumtobel Group
3. “From Specification to Lighting Reality”
ILP Summit–September - 2014
“Apples with Apples”
A look at how LED lumen package data may be presented in different ways and examining
how an apples with apples comparison may be made. It addresses a number of key
aspects such as :
Is data presented for the LED chip only under flash test conditions?
Is the data presented at very low junction temperatures? Is that realistic?
What format of data is being presented? Is relative photometry being applied or is the
data based on absolute photometry?
3 08/10/2014
4. “From Specification to Lighting Reality”
ILP Summit–September - 2014
Junction Temperature Tj – Inside an LED chip is a junction between
two materials, one positively charged and one negatively charged. (pn
Junction) Light is emitted from this junction by the exchange of electrons
between the two materials and, as a side effect, heat is generated at the
junction. The junction temperature needs to be controlled to ensure that
the light output and LED lifetime fulfil the requirements of a given
application.
Ambient Temperature ta – When any testing is performed on a
product it is for a defined surround temperature. This is the ambient
temperature and defined as ta. The standard ta defined for testing is
25deg C although testing an another value is permissible as long as the
temperature is declared.
4 08/10/2014
5. “From Specification to Lighting Reality”
ILP Summit–September - 2014
So ….
Ta = 25° C or 15° C (for street lighting)
Change in lumen output is approx 2% but extended life.
Tj = 60° C – 85° C (@Ta 25deg C)
5 08/10/2014
6. “From Specification to Lighting Reality”
ILP Summit–September - 2014
What is the LOR?
LOR = luminaire output
6 08/10/2014
lamp output
Luminaire Output = lamp output x LOR
e.g. lamp output of a 50W HST = 3400lms
3400 x 0.7 = 2380lms
7. “From Specification to Lighting Reality”
ILP Summit–September - 2014
We generally cannot measure LOR
for an LED luminaire therefore it is
recommended that Absolute
Photometric values are used.
Absolute Photometry results in a
7 08/10/2014
LOR = 1.0
8. “From Specification to Lighting Reality”
ILP Summit–September - 2014
Efficacy – How efficiently a light source converts electricity into light.
Lamp Efficacy
Lm/W = lamp lumens
circuit watts
Luminaire Efficacy
LLm/W = lamp lumens x LOR
circuit watt
For LED we should always use the Luminaire Efficacy i.e. LOR = 1.0
8 08/10/2014
11. “From Specification to Lighting Reality”
ILP Summit–September - 2014
Lumen packages
The table below shows 3 different luminaires the common denominator is that all three have
a circuit wattage of 28W:
11 08/10/2014
A B C
Lumen Package 3072 3200 2360
Lumen Package @ Ta = 15deg 2826 3200 2407
LOR 0.7 0.8 1.0
Lumen Output 1978 2560 2407
A B C
Lamp Efficacy lm/w 101 114 107
Luminaire Efficacy Llm/w 71 91 86
12. “From Specification to Lighting Reality”
ILP Summit–September - 2014
“Apples with Apples”
We look at Correlated Colour Temperature (CCT) and the debate regarding the correct
selection for an application including how this affects the lighting solutions taking into
consideration the impact on the energy efficiency of the overall scheme. We ask the
following:
Is the SP ratio and lumen package correct for the CCT specified?
Is the CRI specified for the correct application?
12 08/10/2014
13. “From Specification to Lighting Reality”
ILP Summit–September - 2014
Correlated Colour Temperature (CCT) – may be either coloured, typically
red/green/blue/amber or white. However, similar to daylight, white can vary from a warm
white with a higher red content to a cool white with a higher blue content.
13 08/10/2014
14. “From Specification to Lighting Reality”
ILP Summit–September - 2014
BS5489-1:2013
LED CCT vs. SP Ratio
CCT Luminaire Lumen Output SP ratio
3000K 4967 1.2
4000K 5340 1.5
5700K 5773 1.9
14 08/10/2014
15. “From Specification to Lighting Reality”
ILP Summit–September - 2014
CCT vs Energy Saving
Based on a standard 10m wide road @ 33m spacing
Lighting Classification
CCT 3000K 4000K 5700K 3000K 4000K 5700K
Lumen Package 1950 2200 2440 8400 8600 9000
SP Ratio 1.2 1.5 2 1.2 1.5 2
Circuit Wattage 26 24 19 110 90 82
15 08/10/2014
P4 P1
16. “The Truth About LED”
Hen on the Road –March - 2014
Colour Rendering Index (CRI) – every light source is characterised according to how
well it distinguishes colours. This is described by an Ra number where the higher the
number the more accurately the colours are displayed.
• IEC/PAS62717, Clause 9.3 (20 Samples tested)
• Measurements made initially and at the end of a 6000hr (or 25% of life – if shorter) time
period.
• Initial rated CRI values shall not vary by more than 3-points
• Maintained CRI values shall not vary by more than 5-points
16 08/10/2014
17. “The Truth About LED”
Hen on the Road –March - 2014
BENCHMARK TEST ON LED REPLACEMENTS OF DIRECTIONAL HALOGEN LAMPS
Bouroussis, C.A., Doulos, L.T., Madias E.-N.D., Topalis, F.V.
Lighting Laboratory, National Technical University of Athens, Athens, GREECE.
LUX EUROPA 2013. KRAKOW
17 08/10/2014
18. “The Truth About LED”
Hen on the Road –March - 2014
Colour Rendering Index (CRI)
What does BS5489-1:2013 state?
18 08/10/2014
19. “The Truth About LED”
Hen on the Road –March - 2014
Application Ra Value
Street Lighting > 20
High Pedestrian usage >60
Indoor Lighting 80
Sports Lighting 80+
High End Designer Store 90
19 08/10/2014
20. “Maintenance Factors, The meaning of Life
and Constant Light Output”
“The meaning of Life”
We also look at The Meaning of Life,
exploring lifetime claims made for LED,
how we measure lifetime in terms of lumen
depreciation and, importantly, parametric
failures (By). We examine how these
affect overall lifetime figures and
maintenance factor helping engineers to
make informed decisions on LED
specifications and how this will affect the
lighting solution on the ground
20 08/10/2014
21. “Maintenance Factors, The meaning of Life
and Constant Light Output”
Rated Life
Lumen Maintenance (Lx)
X = percentage of light output
remaining at the end of rated lifetime
E.g. L70 (100,000hr) = 70% of initial
light output should still be expected
to be produced after 100,000 hrs of
LED operation.
IEC/PAS62717 (clause 10.2) checks
lumen maintenance over a 6000hr
test period.
IES TM-21recommends lumen
maintenance over 10,000hrs.
21 08/10/2014
TM - 21
22. “Maintenance Factors, The meaning of Life
and Constant Light Output”
Failure Fraction (Fy) –expresses the combined effects of all components of the
LED module including mechanical failures, as far as light output is concerned. The
effect of the LED could either be less light than claimed or no light at all.
Y = percentage of LED Lamps/Modules no longer ‘operational’ at the end of their
declared life (complete failure or low light output)
E.g. F10 100,000hrs = 10% of LED’s can be expected to have failed by the end of their
rate 100,000hr life.
A mixed Fy is not useful in professional lighting design!
22 08/10/2014
23. “Maintenance Factors, The meaning of Life
and Constant Light Output”
Parametric failure By - failure of an
operating LED product to produce luminous
flux higher than or equal the luminous flux
relating to the lumen maintenance factor.
For the purpose of this standard the LED
product is an LED module.
For example if we claim L90@100,000hrs,
the By figure relates to the percentage of
LED no longer meeting 90% lumen output.
23 08/10/2014
90
90
90
90
90
90
89
80
60
85
70
90
24. “Maintenance Factors, The meaning of Life
and Constant Light Output”
Median Useful Life (of LED Modules) Lx – is the length of time during which 50%
(B50) of the LED modules have parametrically failed to provide at least the percentage of
initial luminous flux stated.
L90@ 100,000hrs
is actually
L90B50@100,000hrs
24 08/10/2014
.
90
90
90
90
90
90
89
80
60
85
70
70
25. “Maintenance Factors, The meaning of Life
and Constant Light Output”
Gradual Light Output Degradation LxBy – gives the opportunity to qualify the time
for a declared gradual reduction in light output for a population other than 50% where
required.
Where By gives the possibility to declare an alternative percentage.
L70B10@ 100,000hrs
25 08/10/2014
.
70
70
70
70
70
70
70
60
70
65
70
70
26. “Maintenance Factors, The meaning of Life
and Constant Light Output”
L90B50@ 100,000hrs
1 LED module Initial lumen = 1200lm
@100,000hrs we are expecting 90% of the initial lumens
26 08/10/2014
.
@100,000hrs = 1200 x 0.9 = 1080lm
However if we take into account the B50 what we actually
get is 6 LED at 90% output and 6 LED at 50% output.
Therefore @100,000hrs lumen output = (6*90)+ (6*50)
= 840lm
90
90
90
90
90
90
50
50
50
50
50
50
27. “Maintenance Factors, The meaning of Life
and Constant Light Output”
L70B10@ 100,000hrs
1 LED module Initial lumen = 1200lm
@100,000hrs we are expecting 70% of the initial lumens
27 08/10/2014
.
@100,000hrs = 1200 x 0.7 = 840lm
However if we take into account the B50 what we actually
get is 10 LED at 70% output and 2 LED at 30% output.
Therefore @100,000hrs lumen output = (10*70)+ (2*30)
= 760lm
70
70
70
70
70
70
70
70
70
30
30
70
28. “Maintenance Factors, The meaning of Life
and Constant Light Output”
Abrupt failure - failure of a LED product to operate or produce luminous flux
Note 1 to entry For the purpose of this standard the LED product is an LED module.
Note 2 to entry The term “complete failure” is commonly used for the same purpose.
Time to Abrupt Failure Cy - length of time which y% of a population of initially operating
LED modules of the same type fail to produce any luminous flux.
E.g. C10 (100,000hrs) means @ 100,000hrs 10% of the LED modules can be expected to
have failed abruptly giving no light output.
28 08/10/2014
30. “From Specification to Lighting Reality”
ILP Summit–September - 2014
Capital Vs Return on Investment
Finally we look at Capital versus Energy.
LED has provided lighting engineers with
more choice than ever but why is there so
much choice?
Here we consider whole life costing of
lighting solutions which would allow
investigation into initial investment over
lifetime savings.
We question do we invest in a low price
luminaire with a short payback or does
paying a premium for a more efficient
luminaire with a longer payback period
provide the best value and best return on
investment (ROI)?
30 08/10/2014
32. “From Specification to Lighting Reality”
ILP Summit–September - 2014
Summary
Make sure data is presented for the correct Ta
Check the how the Luminous Flux is presented, absolute or relative photometry.
Efficacy is expressed in Luminaire lumens LLm/w
CCT, check the lumen output and SP ratio are correct
Is the Ra value correct for the application
Check lifetime claims, lighting designers are interested in LxB10 figure
Failure rate F10 should be accounted for in whole life costs
Editor's Notes
We have three sets of data here and the common denominator is that all three draw 28W of power.
The lumen package in green is what is published on the data sheet for each luminaire so we can compare apples with apples.
Luminaire A is shown at a very low junction temperature, luminaire B is shown at an ambient of 15deg and C an ambient of 25deg.
We can roughly convert these all to the same ambient temperature so you can see the lumen package of A has decreased, B has remained the same and C has increased.
We the need to look to see if relative or absolute photometry has been used, if its relative photometry then an LOR of less than one will have been applied.
So if we multiply the LOR by the lumen package we can see the lumen output we are getting on the ground can in some cases be significantly less than what is quoted on the data sheet.
So when writing a specification it is important not to quote lumen packages but set design criteria as all three of these lumen packages will give you a very similar lighting solution.
We looked at efficacy earlier, the table here shows in green what is published on the data sheet for each luminaire in terms of efficacy, luminaires A and B publish lamp efficacy and C publishes luminaire efficacy.
We can see that the lamp efficacy is considerable higher than the luminaire efficacy!
We are now going to explore Correlated Colour Temperature and how the selection of CCT can effect your lighting solutions taking into account the energy efficiency of the overall scheme.
We look at using the correct SP ratio and lumen package for the CCT specified and specifying the correct CRI for application.
We have two common colour metrics, colour temperature and colour rendering. Colour temperature is an indicator of the colour of light from a light source. Imagine heating up a metal bar. It will start a dull red, and as it gets hotter become red, orange, yellow, a yellow white becoming a blue white.
A low colour temperature will give you a warm white with more in the amber section of the spectrum and a high colour temperature will give a cool white with more blue properties.
BS4589-1:2013 provides guidance on the CCT and there appearance with warm white being less than 3300k, NW ranging between 3300k and 5300k, and CW in excess of 5300k
It is important to note that lumen output varies with CCT there can be at least a 7% difference between the lumen output between NW and CW. SP ratio is dependant on the spectrum output but to simplify this we can link it to CCT.
When specifying a CCT make sure the data you are using is based upon the correct CCT so if you are using NW then the lumen package quoted is for NW and the SP ratio is adjusted for this.
It is especially important when designing a scheme a lot of the pm data in lighting reality is for CW with and SP of almost 2 but if you specify NW then you loose at least 7% output and the SP ratio decreases to more like 1.5.
Here we look at the energy savings provided through CCT
As you can see we have looked at this over two lighting classifications P4 and P1
For P4 Between Warm White and neutral white a there is an 8% energy saving, and between neutral white and cool white there is an 20% saving
Colour Rendering Index CRI - every light source is characterized according to how well it distinguishes colour, it is measured by the Ra number , the higher the number the more accurately colours are shown.
A light source is tested against its ability to correctly show a set of 14 test colours, the Ra being derived by the closeness of the colour rendering. Note the top 8 colours are the main test for colour rendering. A further 6 were added but most standards still refer only to the 8 colours,”
R8a is the pastel shades, and Ra14 is the saturated colours and skin tone
Initial Rated values shall not move more than 3 points and maintained values not more than 5, we have had some cases where our lab has tested and LED and there have been 13 points difference in what was stated, this is where quality, testing and certifcation come into play.
Most people quote Ra 8 however Ra 14 is more accurate, you can see here the difference in the CRI dependant on whether they have used Ra 8 or 14
So, colour rendering is an important criterion when selecting light sources for lighting application solutions.
However with new LED technology coming in, with a narrow spectrum, the CRI index is not in all circumstances giving a fair representation of the colour appearance. New definitions and methods for measuring are currently under development in CIE. Which will change the CRI ranges to 70-79, 80-89, 90 and above.
When specifying and LED what CRI value do we need for Street lighting, the BS states that a Ra should be greater than 20, or where there is high night time pedestrian use, the Ra should be greater than 60.
Lets look at other applications and the relevant Ra index
It is important to know that as you increase the Ra value with LED you decrease the efficiency, for example if you increase the Ra from 70 to 90 the you can reduce your lumen output by up to 30%, so it is important when looking at street lighting energy saving projects with LED’s to quote the correct Ra, as if you quoted 90 then your energy saving would be reduced.
Here we are going to investigate the meaning of life in terms of lumen deprecation and more importantly our parametric failures (By).
We will examine how these affect the overall lifetime figures and maintenance factor.
The information discussed today is taken from the draft IEC62717 – Proposed Module Metrics
Lumen Maintenance = to the percentage of light output reaming at the end of the rated life i.e L70@100,00hrs relates to losing 30% of your total light at the end of life., this is based on tests to 6000 or 10,000hs which can be the extrapolated upto 6 times.
Lifetime claims are always based upon the LED manufactures data, the technology is moving so fast that even if you started an accelerated test now to prove lifetime claims by the time it was completed the data would be in accurate.
This is nothing new for HID lamps we always took the L90 figure this would give us 12,000hrs and at the end of this period we would replace the lamp.
For LED’s due to the prolonged life it has become standard to take the L70 figure, as it was determined that at 70% was the percentage of light output where it the reduction in light became noticeable to the human eye. more and more we are being asked for L80 and L90
The failure fraction is made up of two parts and accounts for the decrease in light output or abrupt failure caused by the electrical or mechanical failure.
It is often quoted as fy and the recommended series of values is 10 and 50
However it a mixed failure rate FY is not useful to the professional lighting designer.
There are two specific parts that make up the failure rate
By is the parametric failure, it is the failure of an LED product to produce luminous flux higher than or equal to the lumen maintenance factor our LLMF.
In this example the module claims L90@100,000hrs but as you can see not all the LED are producing 90% lumen output.
So when looking at lifetime claims we look at the median useful life this is the length of time during which 50% of our LED modules have failed to provide at least the initial flux stated.
Foe example if you see a claim L90@100,000hrs what you really get is show here out of this 12LED module 50% of the LED are at less than 90% lumen out put here we have some at 89% down to 60% these are our parametric failures and go hand in hand with out Useful life claim.
So in this case L90 is really L90B50@100,00hrs and this is the case every time you see a lifetime claim at L90, L80 and L70 it is always with B50 this is the standard so does not hev to be stated, just like ambient temperature 25deg is the standard so you only have to quote the Ta when it differs from this say 15deg.
In the real world what are we interested in?
Lighting designer are interested in Parametric failure By, we want to know the life time based upon this failure
The standard is to use B50 which allows comparable data, but this may be considered too much risk for a lighting designer.
There for quoting the gradual light output degradation gives us the opportunity to declare the gradual reduction in light output so we see LxBy
We may consider L70B10= 100,000hrs this means 10% of the LED are below L70, here you can see we only have 2 LED below 70% light output.
Notice how the lifetime claim is the same but in reality this very different.
Lets take an example, I have used an extreme example to demonstrate the point so here the luminaire claims a lifetime of L90 @100,00hrs but now we know this really means L90B50.
If this module produces 1200lm at 100,000hrs we are expecting 90% 0f the initial lumen output so 1080lm.
In reality though 50% of the LED are only giving 50% lumen output so if we calculate the lumen output at end of life it is 840lm so the total lumen out put is only 70% of the intial lumens.
Lets look at another claim this luminaire claims a lifetime of L70B10 @100,00hrs.
If this module produces 1200lm at 100,000hrs we are expecting 70% 0f the initial lumen output so 840lm.
In reality though 10% of the LED are only giving 30% lumen output so if we calculate the lumen output at end of life it is 760lm so the total lumen out put is only 63% of the initial lumens.
Again this an extreeme case for demonstration purposes but it shows that an L90B50 claim is only giving 70% lumen output at end of life compared to an L70B10 which gives 63%.
This can ebe used to tire luminaires we are seeing some products now on the market that are L70B50 at 80,000, which is a lot lower liftime than an L70B10 @100,000hrs.
Abrupt failure is the failure of an LED to operate or produce luminous flux, we are interested in the time to abrupt failure so if you are looking at an 100,000hr litime claim at 100,000hrs what is your abrupot failure rate or Cy figure.
Foe example this could be 3% so you would have a C3 figure @100,000hrs
In the real world what are we interested in?
We buy an new luminaire, the designer is interested in BY Failures in lumen depreciation, this is accounted for in the MF as the LLMF
The accountant wants to know the abrupt /total failures , he needs to allow a sum of money to be allocated to replace the failed luminaires over life time.
This can be related to the LSF, which we always treated as 1 for spot replacements.
Check the warranty - what does the manufacture consider to be a failed luminaire