This document summarizes the results of a study that evaluated the efficiency of 78 state universities and colleges (SUCs) in the Philippines from 2006 to 2009 using data envelopment analysis (DEA). The study found that the majority of SUCs had efficiency scores of less than 1, indicating inefficiency. The DEA results also provided target input and output levels that could help SUCs achieve potential cost savings. Productivity improved slightly for about 62% of SUCs over the period analyzed. The findings suggest further research is needed to identify and address factors affecting the performance and operations of inefficient SUCs.

![7
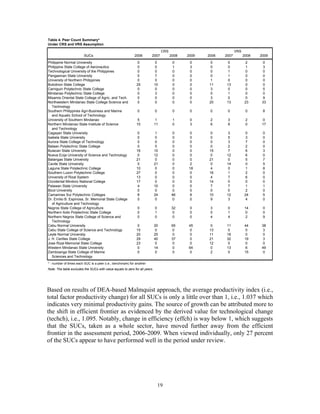
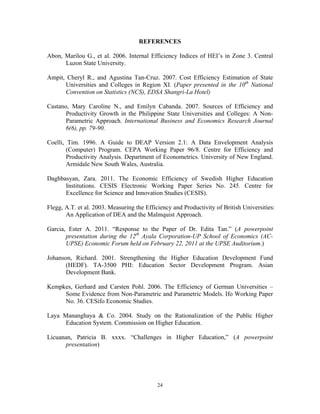
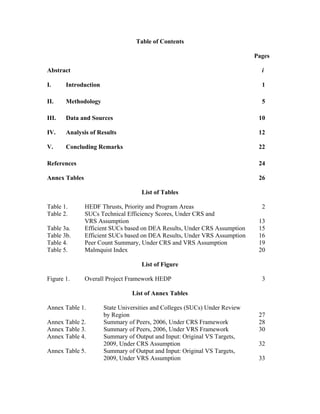
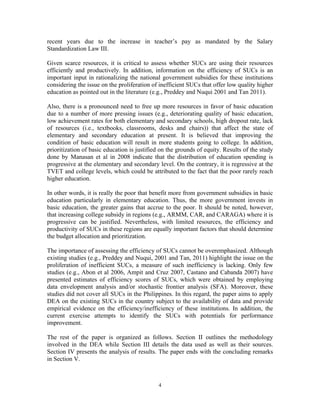
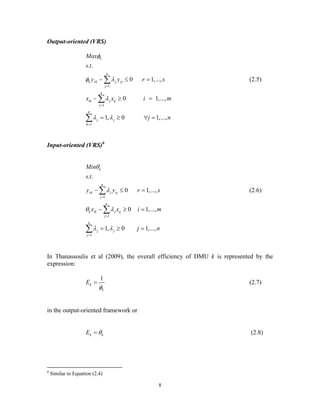
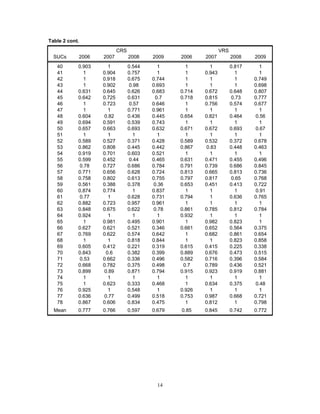
DMU’s efficiency score. The resulting efficiency score lies in the interval [0,1]. The
DMUs which have a value of 1 are said to be efficient. On the other hand, the DMUs
which take a value below 1 are considered inefficient.
Using the concept of duality in linear programming, the equivalent envelopment form of
the linear programming model expressed in Equation (2.3) is given below:
1
1
. .
0 ( 1,..., )
0 ( 1,..., )
0 ( 1,..., )
n
i ji jp
i
n
i ki kp
i
i
Min
s t
x x j j m
y y k k s
i i n
θ
λ θ
λ
λ
=
=
− ≤ ∀ =
− ≥ ∀ =
≥ ∀ =
∑
∑
(2.1)
Like Equation (2.3), Equation (2.4) is run n times, i.e., once for each DMU in the sample.
In practical terms, a DMU in question, say DMU p, is inefficient if there exists a
composite DMU (i.e., a linear combination of DMUs in the sample), which uses less
input than DMU p while maintaining at least the same levels of output. The units that
comprise such composite DMU are regarded as benchmarks or peers for improving the
inefficient DMU in question (Talluri 2000).
Graphically, the efficiency scores are based on the distance of the DMUs from the
frontier. The efficient units (i.e., units with efficiency score of 1) lie on the frontier while
the inefficient ones (i.e., units with efficiency score less than 1) lie below the frontier and
thus, are enveloped by it.
In general, a typical DEA model can be expressed as input-orientated model or output-
orientated model. Assuming constant returns to scale (CRS), the efficiency measures for
DMUs are the same regardless of the model orientation used. In contrast, these measures
vary depending on the orientation adopted under the VRS framework. Nevertheless, the
set of DMUs identified as inefficient under VRS will be the same regardless of the
orientation adopted (Thanassoulis et al 2009). Mathematically, the output-oriented model
and input-oriented model under the VRS framework is represented by Equation (2.5) and
Equation (2.6), respectively, as shown in below.](https://image.slidesharecdn.com/pidsdps1114-140407195040-phpapp01/85/Pidsdps1114-11-320.jpg)
![10
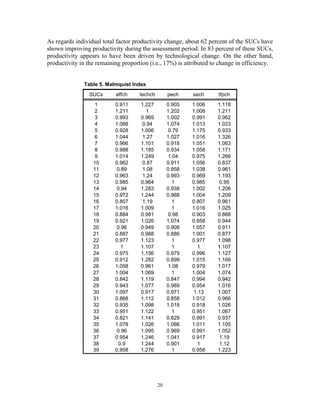
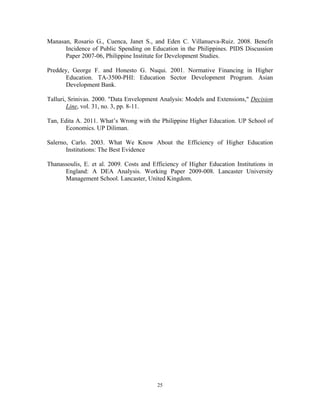
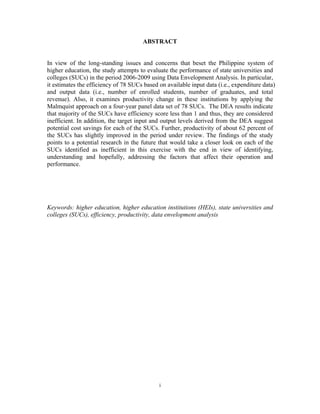
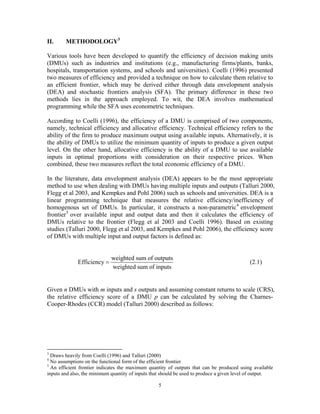
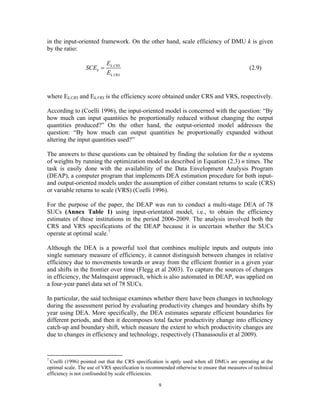
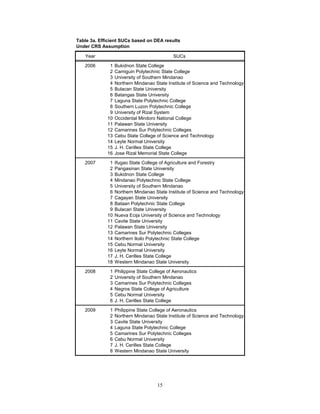
The input-oriented Malmquist productivity index M0 (Mohammadi and Ranaei 2011),
which measures the productivity change of a particular DMU0, 0 ∈ Q = [1,2,…,n], in
time t + 1 is given by:
1 1 1 1 1
0 0 0 0 0 0
0 1
0 0 0 0 0 0
( , ) ( , )
( , ) ( , )
t t t t t t
t t t t t t
D X Y D X Y
M
D X Y D X Y
+ + + + +
+
= • (2.10)
where
D0 – distance function
(Xt+1
, Yt+1
) – represents the production point of technology
(Xt
, Yt
) – relative production point of the productivity
t – period of benchmark technology
t+1 – the next period of technology
The first component of Equation (2.10) measures the change in technical efficiency while
the second one measures the technology frontier shift between time period t and t+1. If
the derived value of M0 is greater than 1, then there is productivity gain. If the value is
less than 1, it implies there is productivity loss. Lastly, if value is equal to 1, it means
there is no change in productivity from t to t+1.
As mentioned earlier, the Malmquist technique is also automated in the DEAP and thus,
the solution to Equation (2.10) can easily be obtained. The Malmquist DEAP results
include five Malmquist indices: (i) technical efficiency change (i.e., SUCs getting closer
to or further away from the efficient frontier) relative to a CRS technology; (ii)
technological change (i.e, shifts in the efficient frontier); (iii) pure technical efficiency
change relative to a VRS technology; (iv) scale efficiency change; and (v) TFP change.
III. DATA AND SOURCES
The choice of input and output data in a number of studies (Thanassoulis et al 2009,
Flegg et al 2003, Kempkes and Pohl 2006, Daghbasyan 2011, and Salerno 2003) that
evaluate the efficiency of higher education institutions (HEIs) such as universities and
colleges in different countries does not vary much because HEIs are in general assumed
to accomplish two major duties or provide two main services, namely, teaching and
research and development. Thanassoulis et al (2009) mentioned about the third mission
of HEIs, i.e, the provision of advice and other services to business, provision of a source
of independent comment on public issues, and storage and preservation of knowledge.
Nevertheless, due to lack of data or absence of a good measure or at least, proxy variable,
the said output is often ignored in assessment exercises.
Only three outputs are normally considered in the literature and they include
undergraduate teaching, postgraduate teaching, and research and development
(Thanassoulis et al 2009, Flegg et al 2003). Because universities and colleges are](https://image.slidesharecdn.com/pidsdps1114-140407195040-phpapp01/85/Pidsdps1114-14-320.jpg)

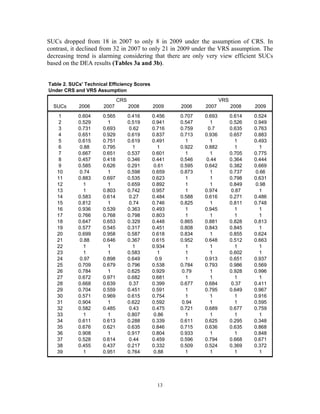
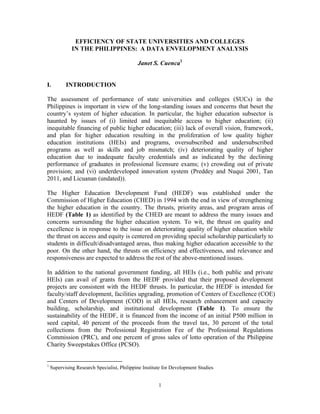
![18
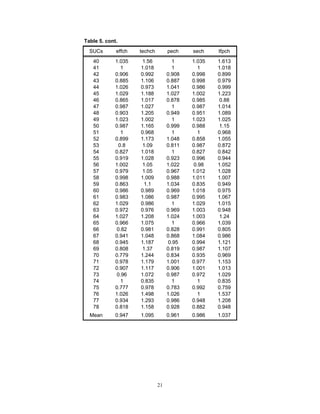
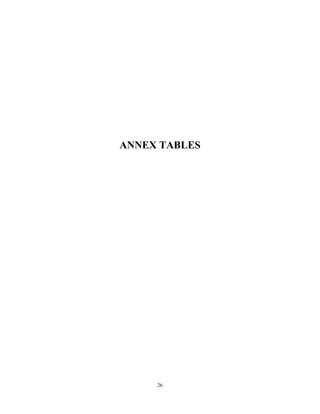
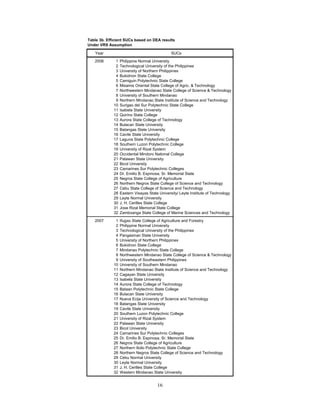
the level of the benchmark SUCs or identified peers. To elucidate, the SUCs could have
reduced consumption of all inputs by 32 percent under the CRS framework and 23
percent under the VRS framework, on the average, if they had been efficient in 2009.
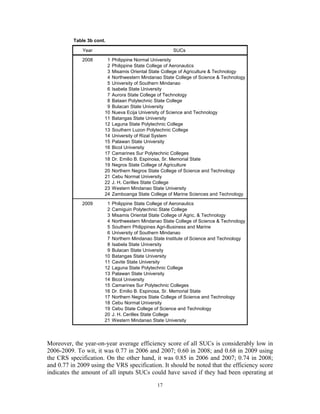
Further, it can be gleaned from Table 2 that a big proportion (i.e., 50 percent and 47
percent, on the average) of the SUCs is way below the year-on-year average efficiency
score. This implies bigger reduction in consumption of all inputs in these SUCs in the
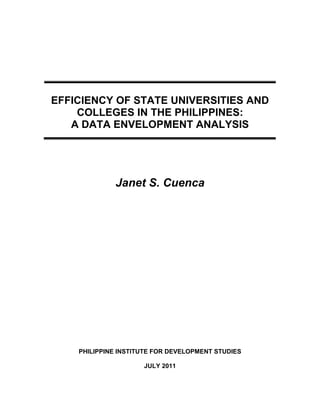
period under review. For example, consider SUC #38, under the CRS framework, which
obtained an efficiency score of 0.455 (i.e., lowest in 2006) and 0.217 (i.e., lowest in
2008). The reduction in consumption of all inputs of SUC #38 without changing the level
of output could go as high as 55 percent in 2006 and 78 percent in 2008 if it had been
operating at the level of its peers (i.e., SUCs #12, #43, #74, and #65 in 2006 and SUCs
#51, #74, and #64 in 2008) [Annex Table 2 and Annex Table 3].
The DEAP derived the target/projected values for outputs and inputs of all SUCs that
could have placed them to the efficient frontier. More specifically, the target inputs
indicate the minimum cost at which the SUCs could have operated to produce at least the
actual level of output during the study period. The summary of results is presented in
Annex Table 4 and Annex Table 5.
As discussed earlier [Equation (2.4)], the target inputs and outputs of any SUC in
question are estimated relative to the other SUCs, which serve as benchmark of
improvement or peers for the SUC in question. Table 4 displays the summary of peer
count, which indicates the number of times each firm is a peer for another. Expectedly,
the SUCs that serve as peer for another in any particular year/s are the efficient ones
listed in Table 3a and Table 3b. It is noteworthy that among the efficient SUCs
identified in the current exercise, University of Southeastern Philippines and Southern
Philippines Agri-Business and Marine and Aquatic School of Technology were also
found to be efficient by Ampit and Cruz (2007) in at least one year between 1997 and
2005.
Further, Cebu Normal University, Western Mindanao State University, and J.H. Jerilles
State College registered the most number of times they become a peer for another SUC in
both scenarios. On the other hand, Southern Luzon Polytechnic College, Camarines Sur
Polytechnic Colleges, Leyte Normal University, and Batangas State University also serve
as benchmark for another SUC a number of times but not as frequent as the ones
mentioned earlier.
With regard to changes in productivity in 2006-2009, Table 5 shows the results of the
Malmquist approach when applied on a panel data set of 78 SUCs. The said approach
assumes that the “technology” of production has changed significantly during the study
period. This is in contrast with the preceding assessments wherein the four years from
2006 up to 2009 is treated as a single cross-section and that “technology” of production
was assumed to be unchanged across the years.](https://image.slidesharecdn.com/pidsdps1114-140407195040-phpapp01/85/Pidsdps1114-22-320.jpg)