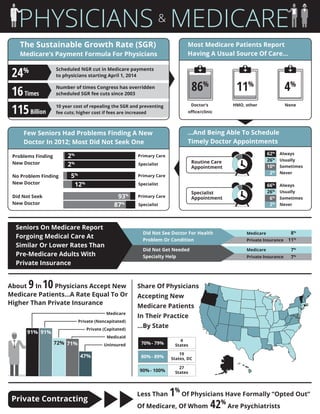
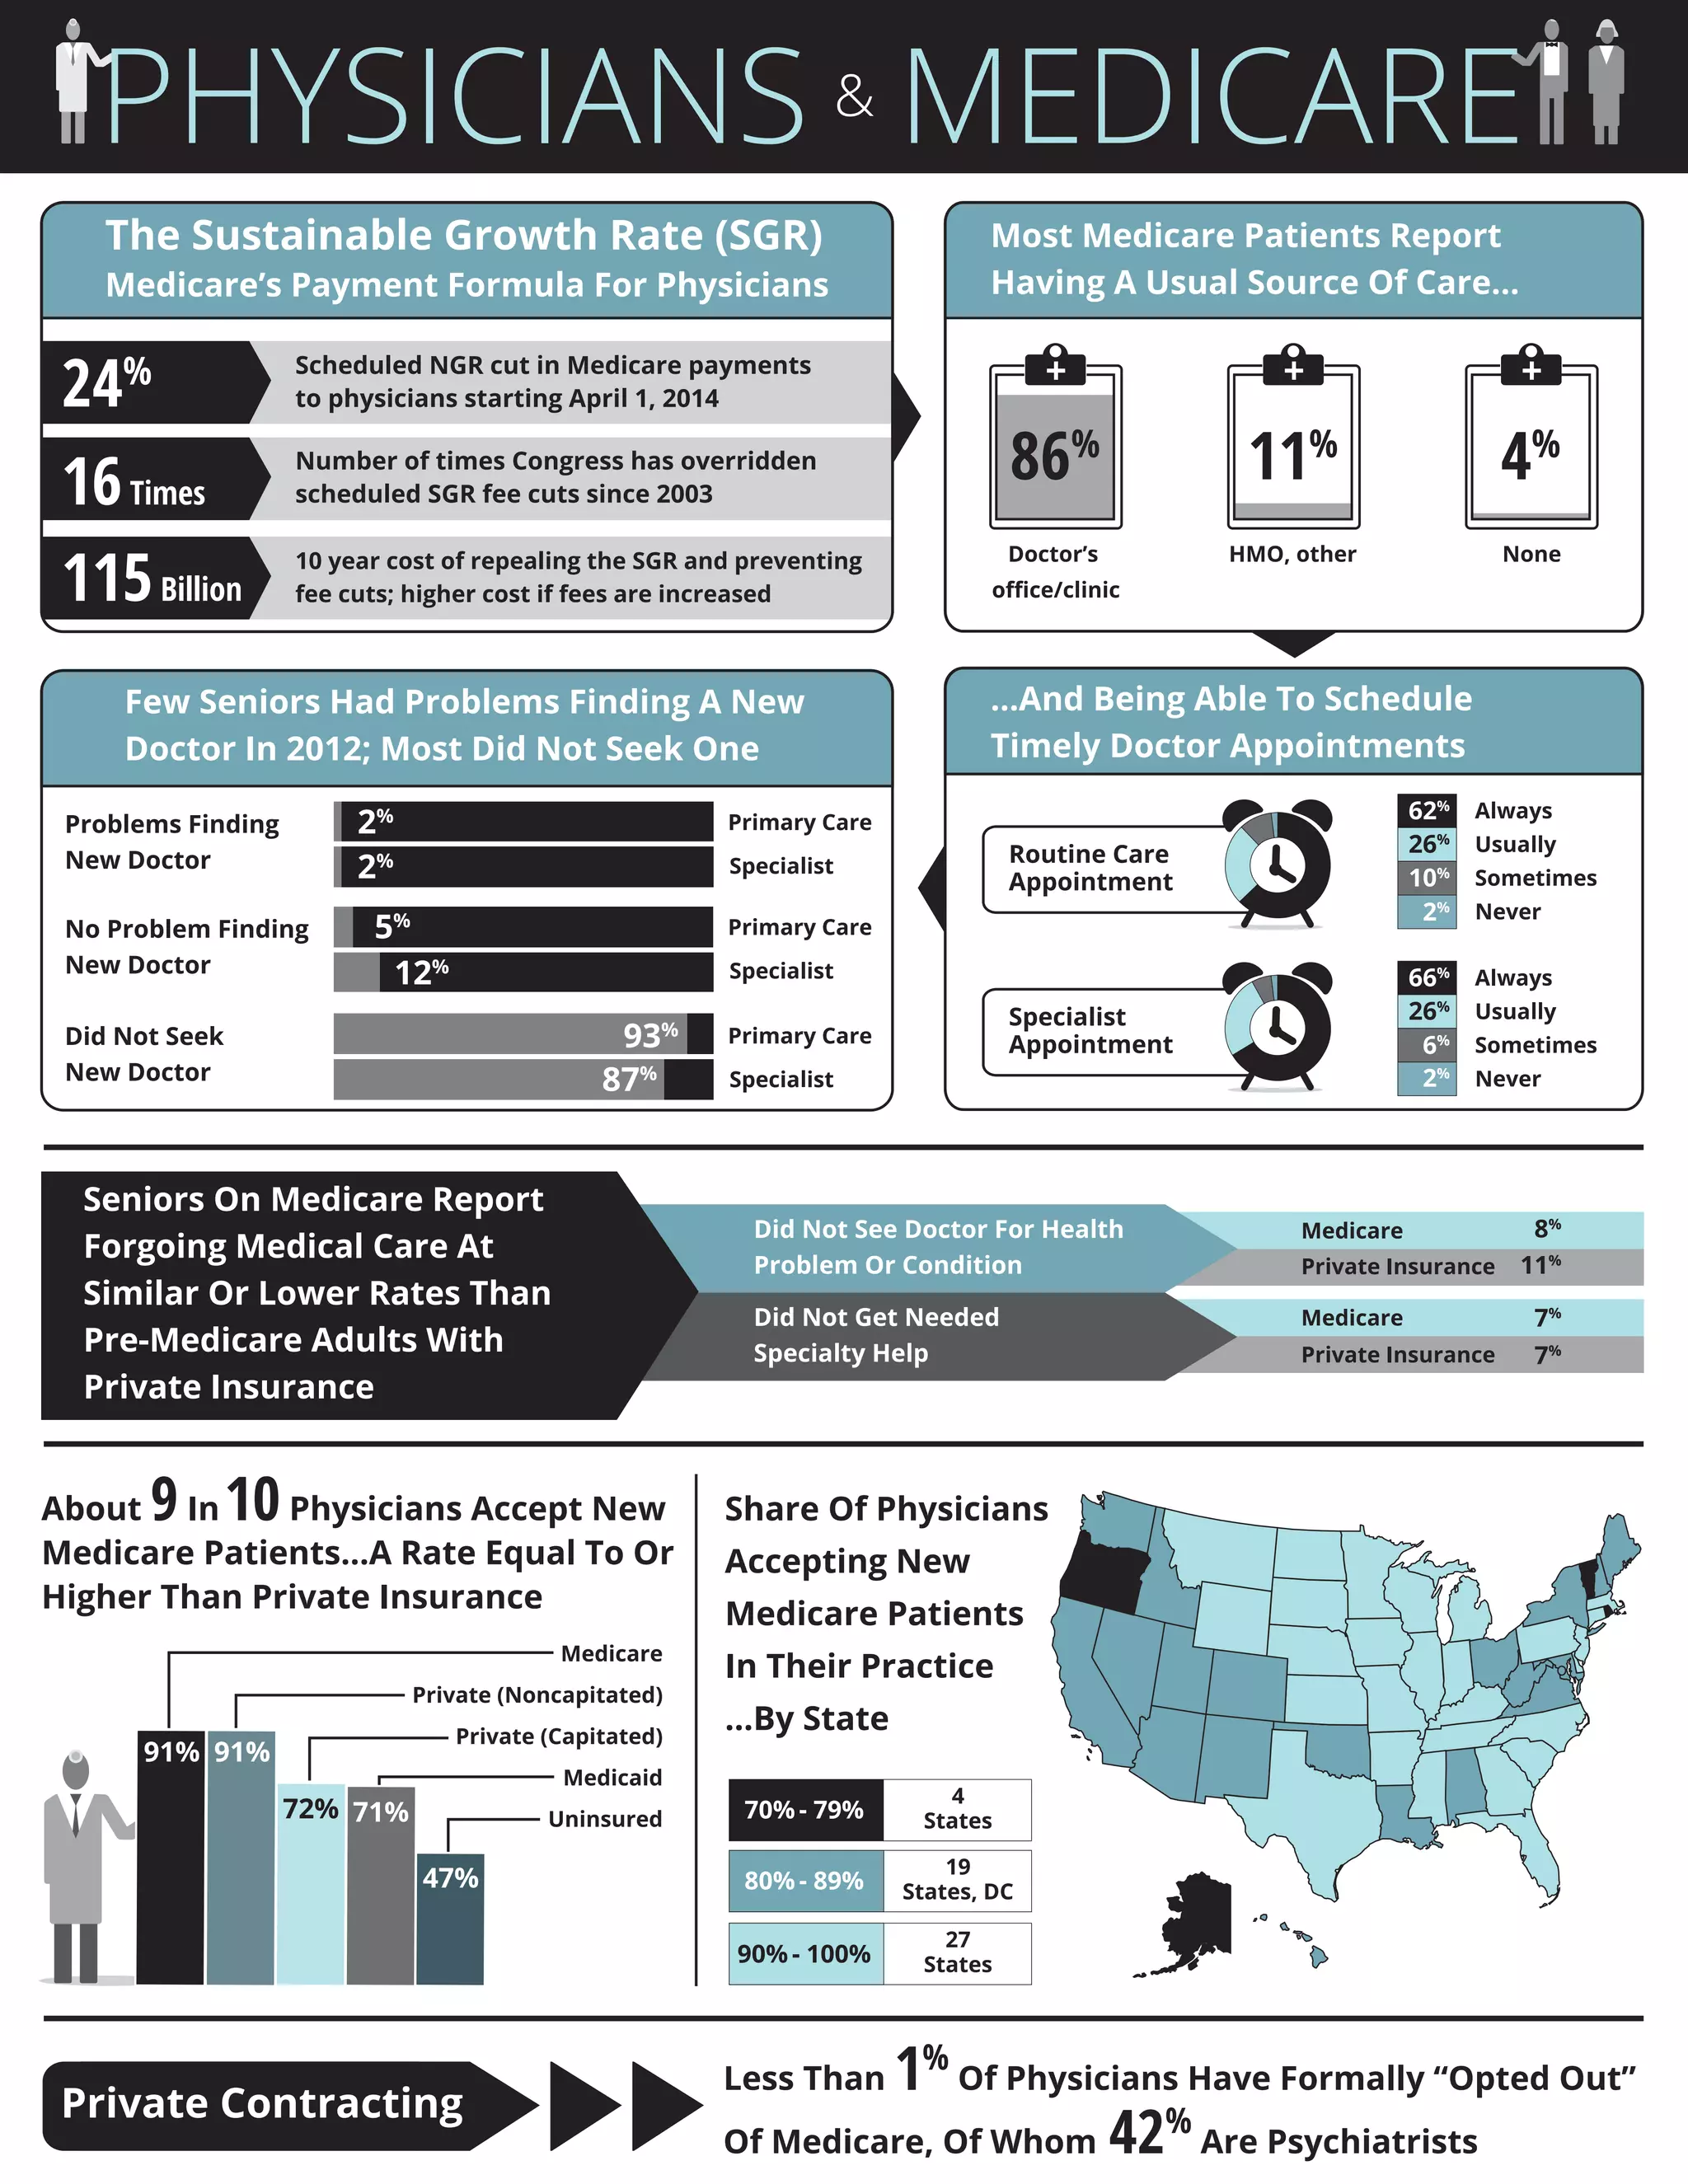
The Sustainable Growth Rate (SGR)
Medicare’s Payment Formula For Physicians
Most Medicare Patients Report
Having A Usual Source Of Care...
...And Being Able To Schedule
Timely Doctor Appointments
Problems Finding
New Doctor
No Problem Finding
New Doctor
Did Not Seek
New Doctor
Few Seniors Had Problems Finding A New
Doctor In 2012; Most Did Not Seek One
Less Than 1%
Of Physicians Have Formally “Opted Out”
Of Medicare, Of Whom 42%
Are Psychiatrists
Private Contracting
Share Of Physicians
Accepting New
Medicare Patients
In Their Practice
…By State
About 9In10Physicians Accept New
Medicare Patients…A Rate Equal To Or
Higher Than Private Insurance
16Times
115Billion
24% Scheduled NGR cut in Medicare payments
to physicians starting April 1, 2014
Number of times Congress has overridden
scheduled SGR fee cuts since 2003
10 year cost of repealing the SGR and preventing
fee cuts; higher cost if fees are increased
PHYSICIANS MEDICARE&
5%
12%
Primary Care
Specialist
2%
2%
Primary Care
Specialist
Primary Care
Specialist
93%
87%
NoneHMO, other
11%
4%
Doctor’s
office/clinic
86%
+ + +
Medicare
Private Insurance
Did Not See Doctor For Health
Problem Or Condition
8%
11%
Medicare
Private Insurance
Did Not Get Needed
Specialty Help
7%
7%
Routine Care
Appointment
Specialist
Appointment
Always
Usually
Sometimes
Never
Always
Usually
Sometimes
Never
62%
26%
10%
2%
66%
26%
6%
2%
Seniors On Medicare Report
Forgoing Medical Care At
Similar Or Lower Rates Than
Pre-Medicare Adults With
Private Insurance
Medicare
Private (Noncapitated)
Private (Capitated)
Medicaid
Uninsured
91% 91%
72% 71%
47%
4
States
19
States, DC
27
States
70% - 79%
80% - 89%
90% - 100%

Physicians & Medicare

  • 1.
    The Sustainable GrowthRate (SGR) Medicare’s Payment Formula For Physicians Most Medicare Patients Report Having A Usual Source Of Care... ...And Being Able To Schedule Timely Doctor Appointments Problems Finding New Doctor No Problem Finding New Doctor Did Not Seek New Doctor Few Seniors Had Problems Finding A New Doctor In 2012; Most Did Not Seek One Less Than 1% Of Physicians Have Formally “Opted Out” Of Medicare, Of Whom 42% Are Psychiatrists Private Contracting Share Of Physicians Accepting New Medicare Patients In Their Practice …By State About 9In10Physicians Accept New Medicare Patients…A Rate Equal To Or Higher Than Private Insurance 16Times 115Billion 24% Scheduled NGR cut in Medicare payments to physicians starting April 1, 2014 Number of times Congress has overridden scheduled SGR fee cuts since 2003 10 year cost of repealing the SGR and preventing fee cuts; higher cost if fees are increased PHYSICIANS MEDICARE& 5% 12% Primary Care Specialist 2% 2% Primary Care Specialist Primary Care Specialist 93% 87% NoneHMO, other 11% 4% Doctor’s office/clinic 86% + + + Medicare Private Insurance Did Not See Doctor For Health Problem Or Condition 8% 11% Medicare Private Insurance Did Not Get Needed Specialty Help 7% 7% Routine Care Appointment Specialist Appointment Always Usually Sometimes Never Always Usually Sometimes Never 62% 26% 10% 2% 66% 26% 6% 2% Seniors On Medicare Report Forgoing Medical Care At Similar Or Lower Rates Than Pre-Medicare Adults With Private Insurance Medicare Private (Noncapitated) Private (Capitated) Medicaid Uninsured 91% 91% 72% 71% 47% 4 States 19 States, DC 27 States 70% - 79% 80% - 89% 90% - 100%