Download to read offline

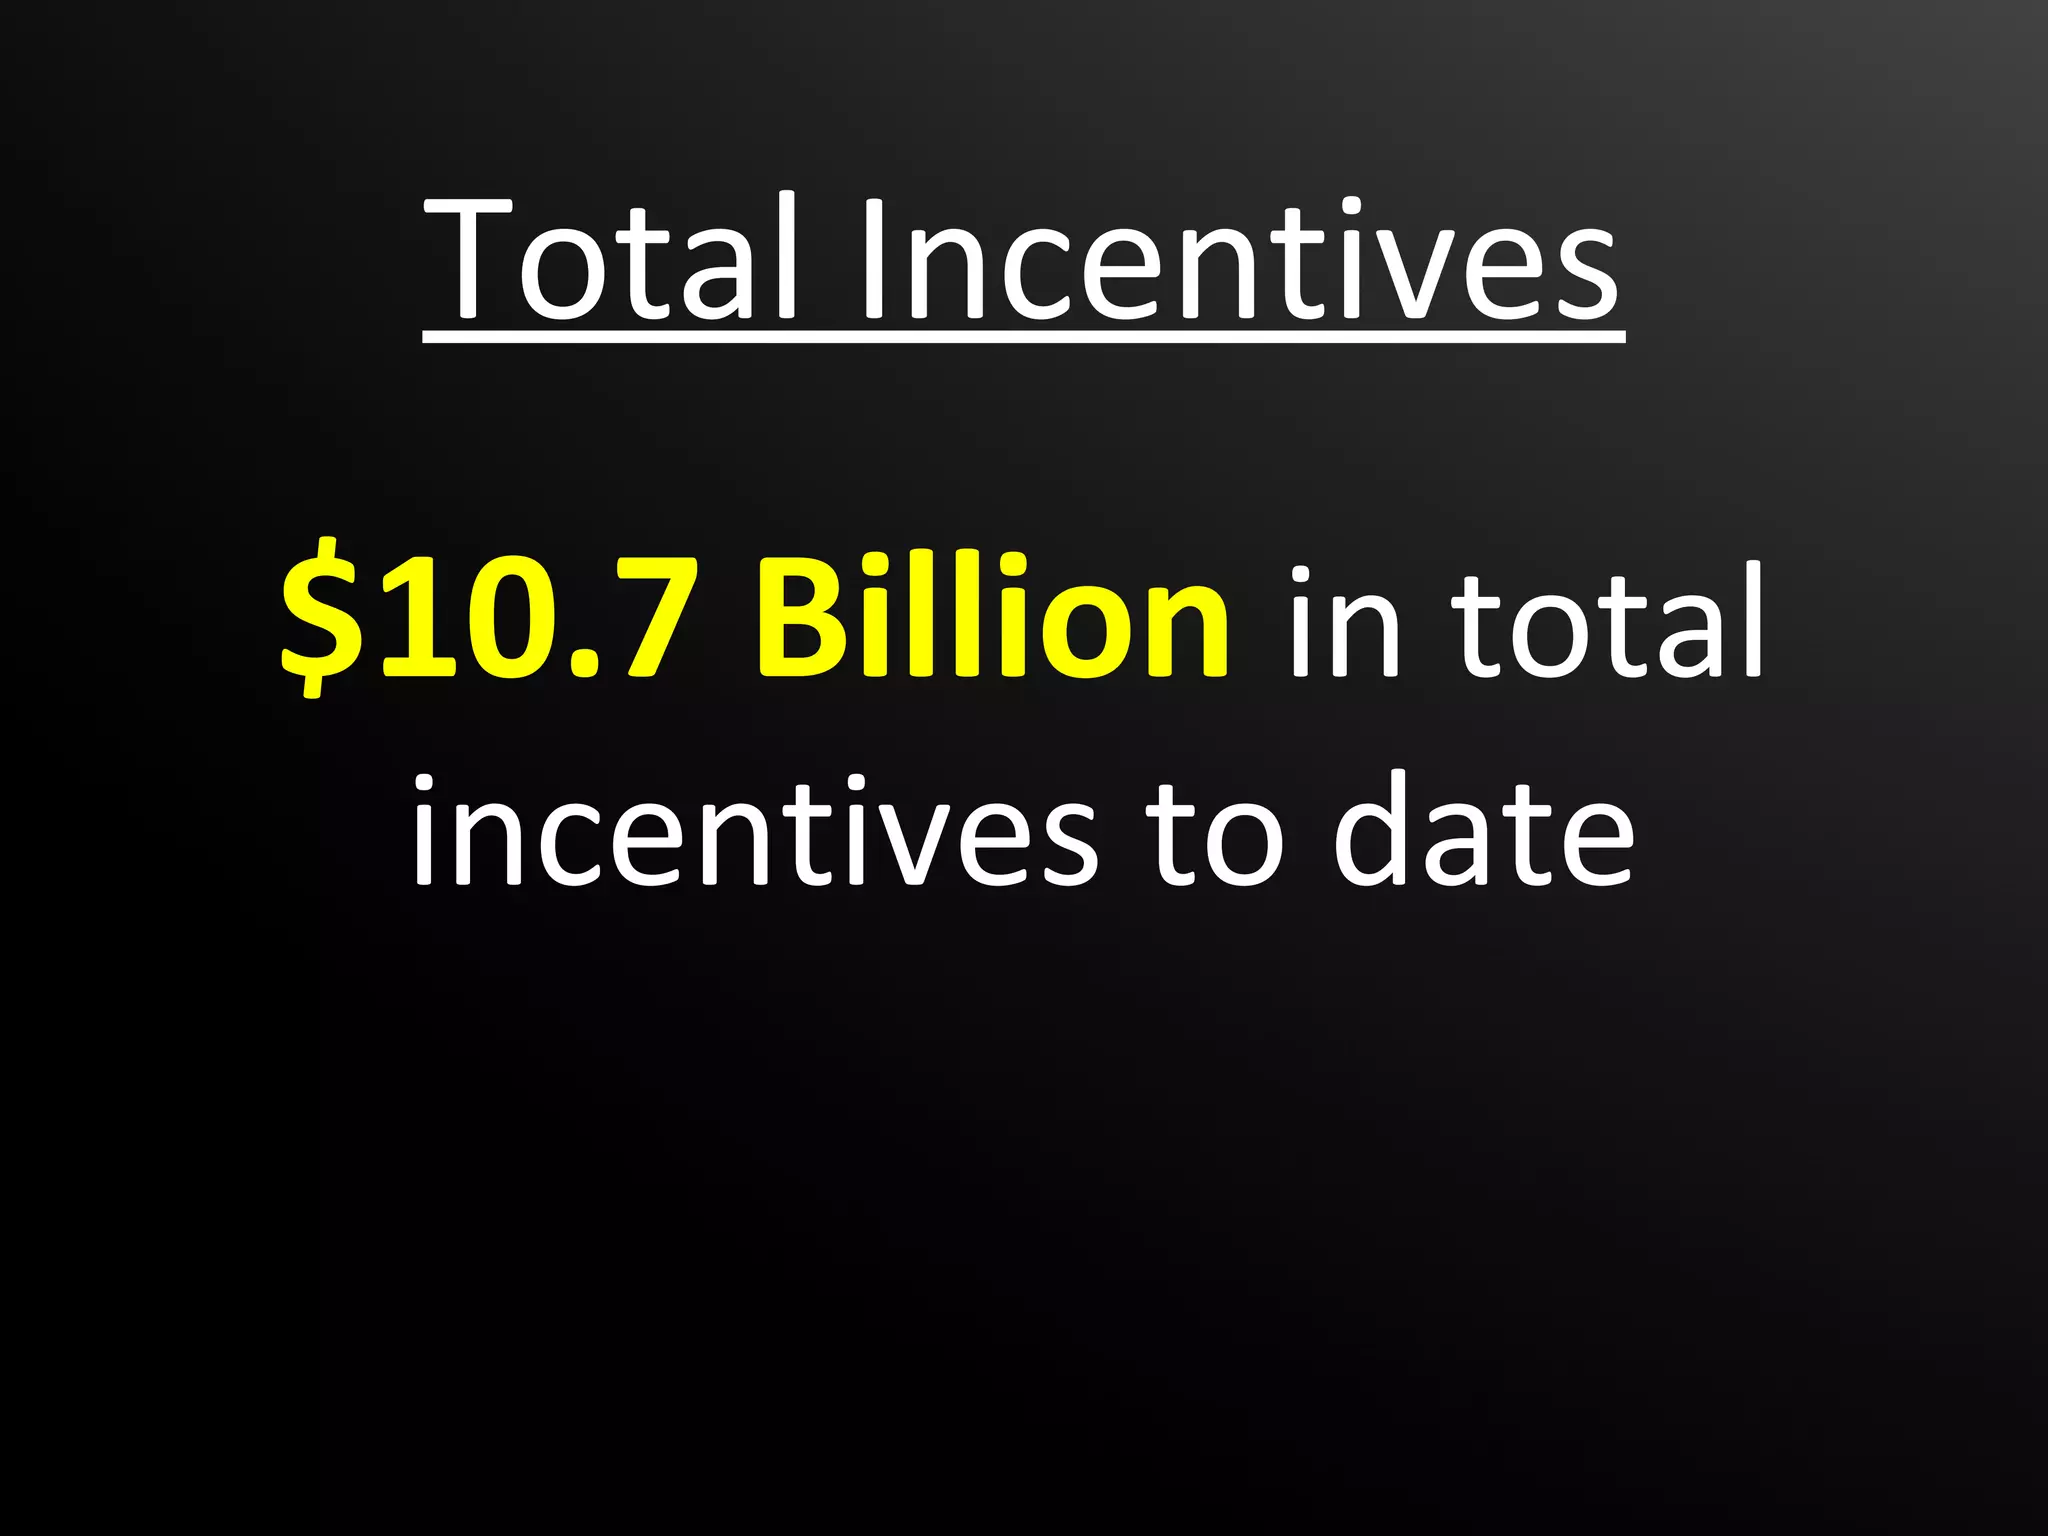
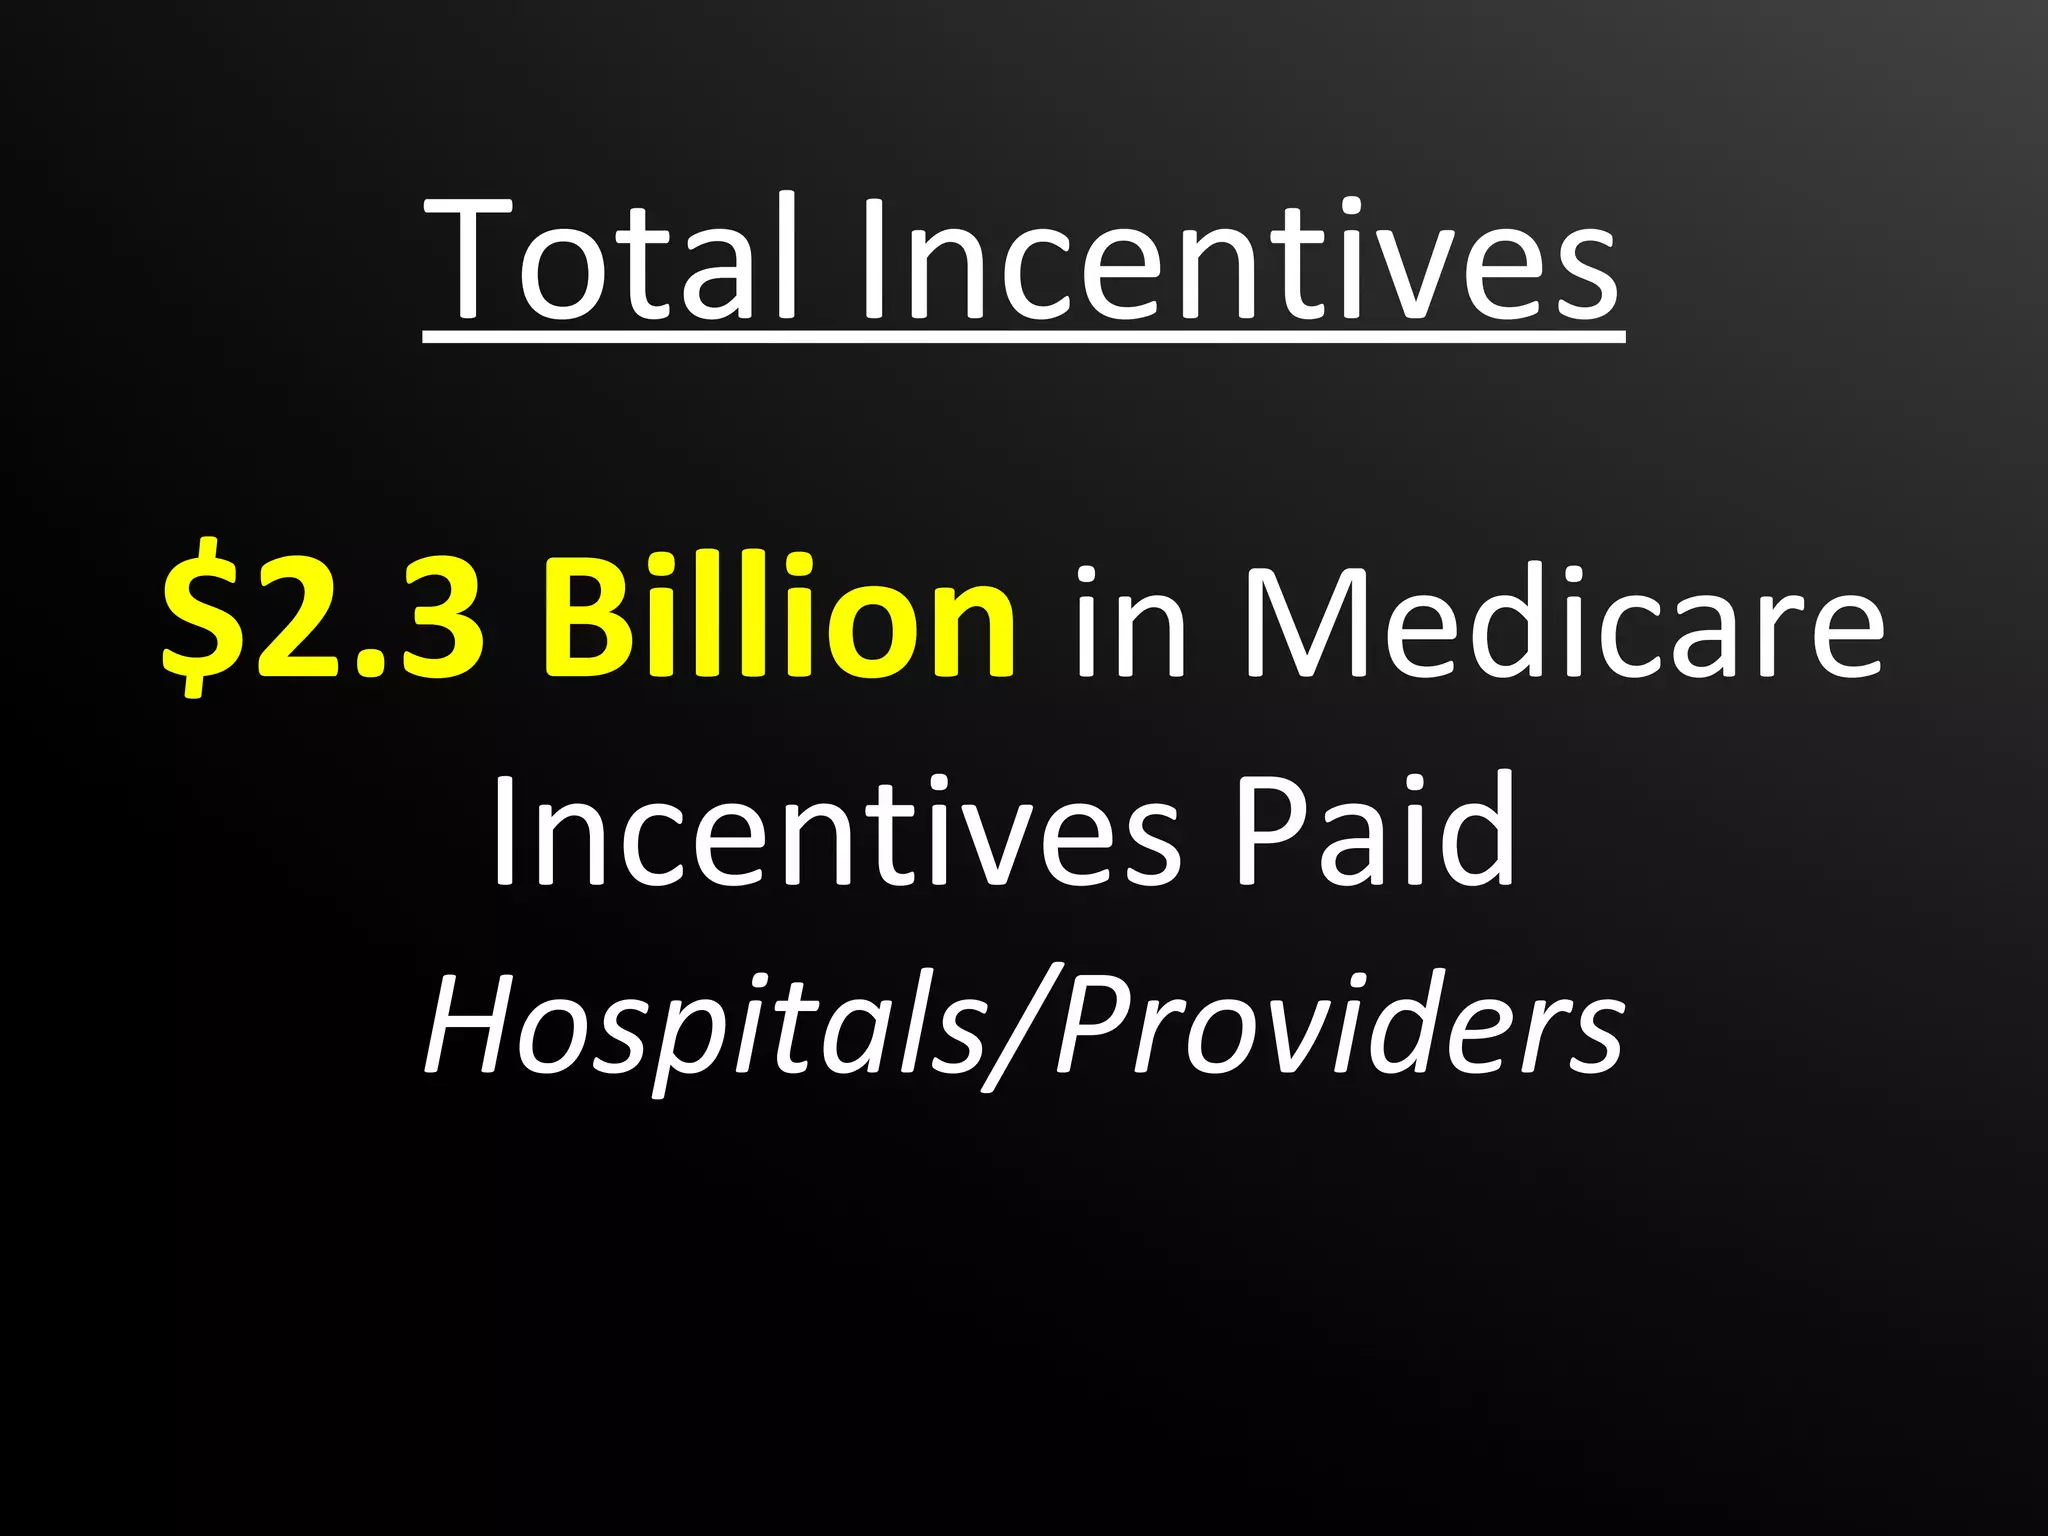
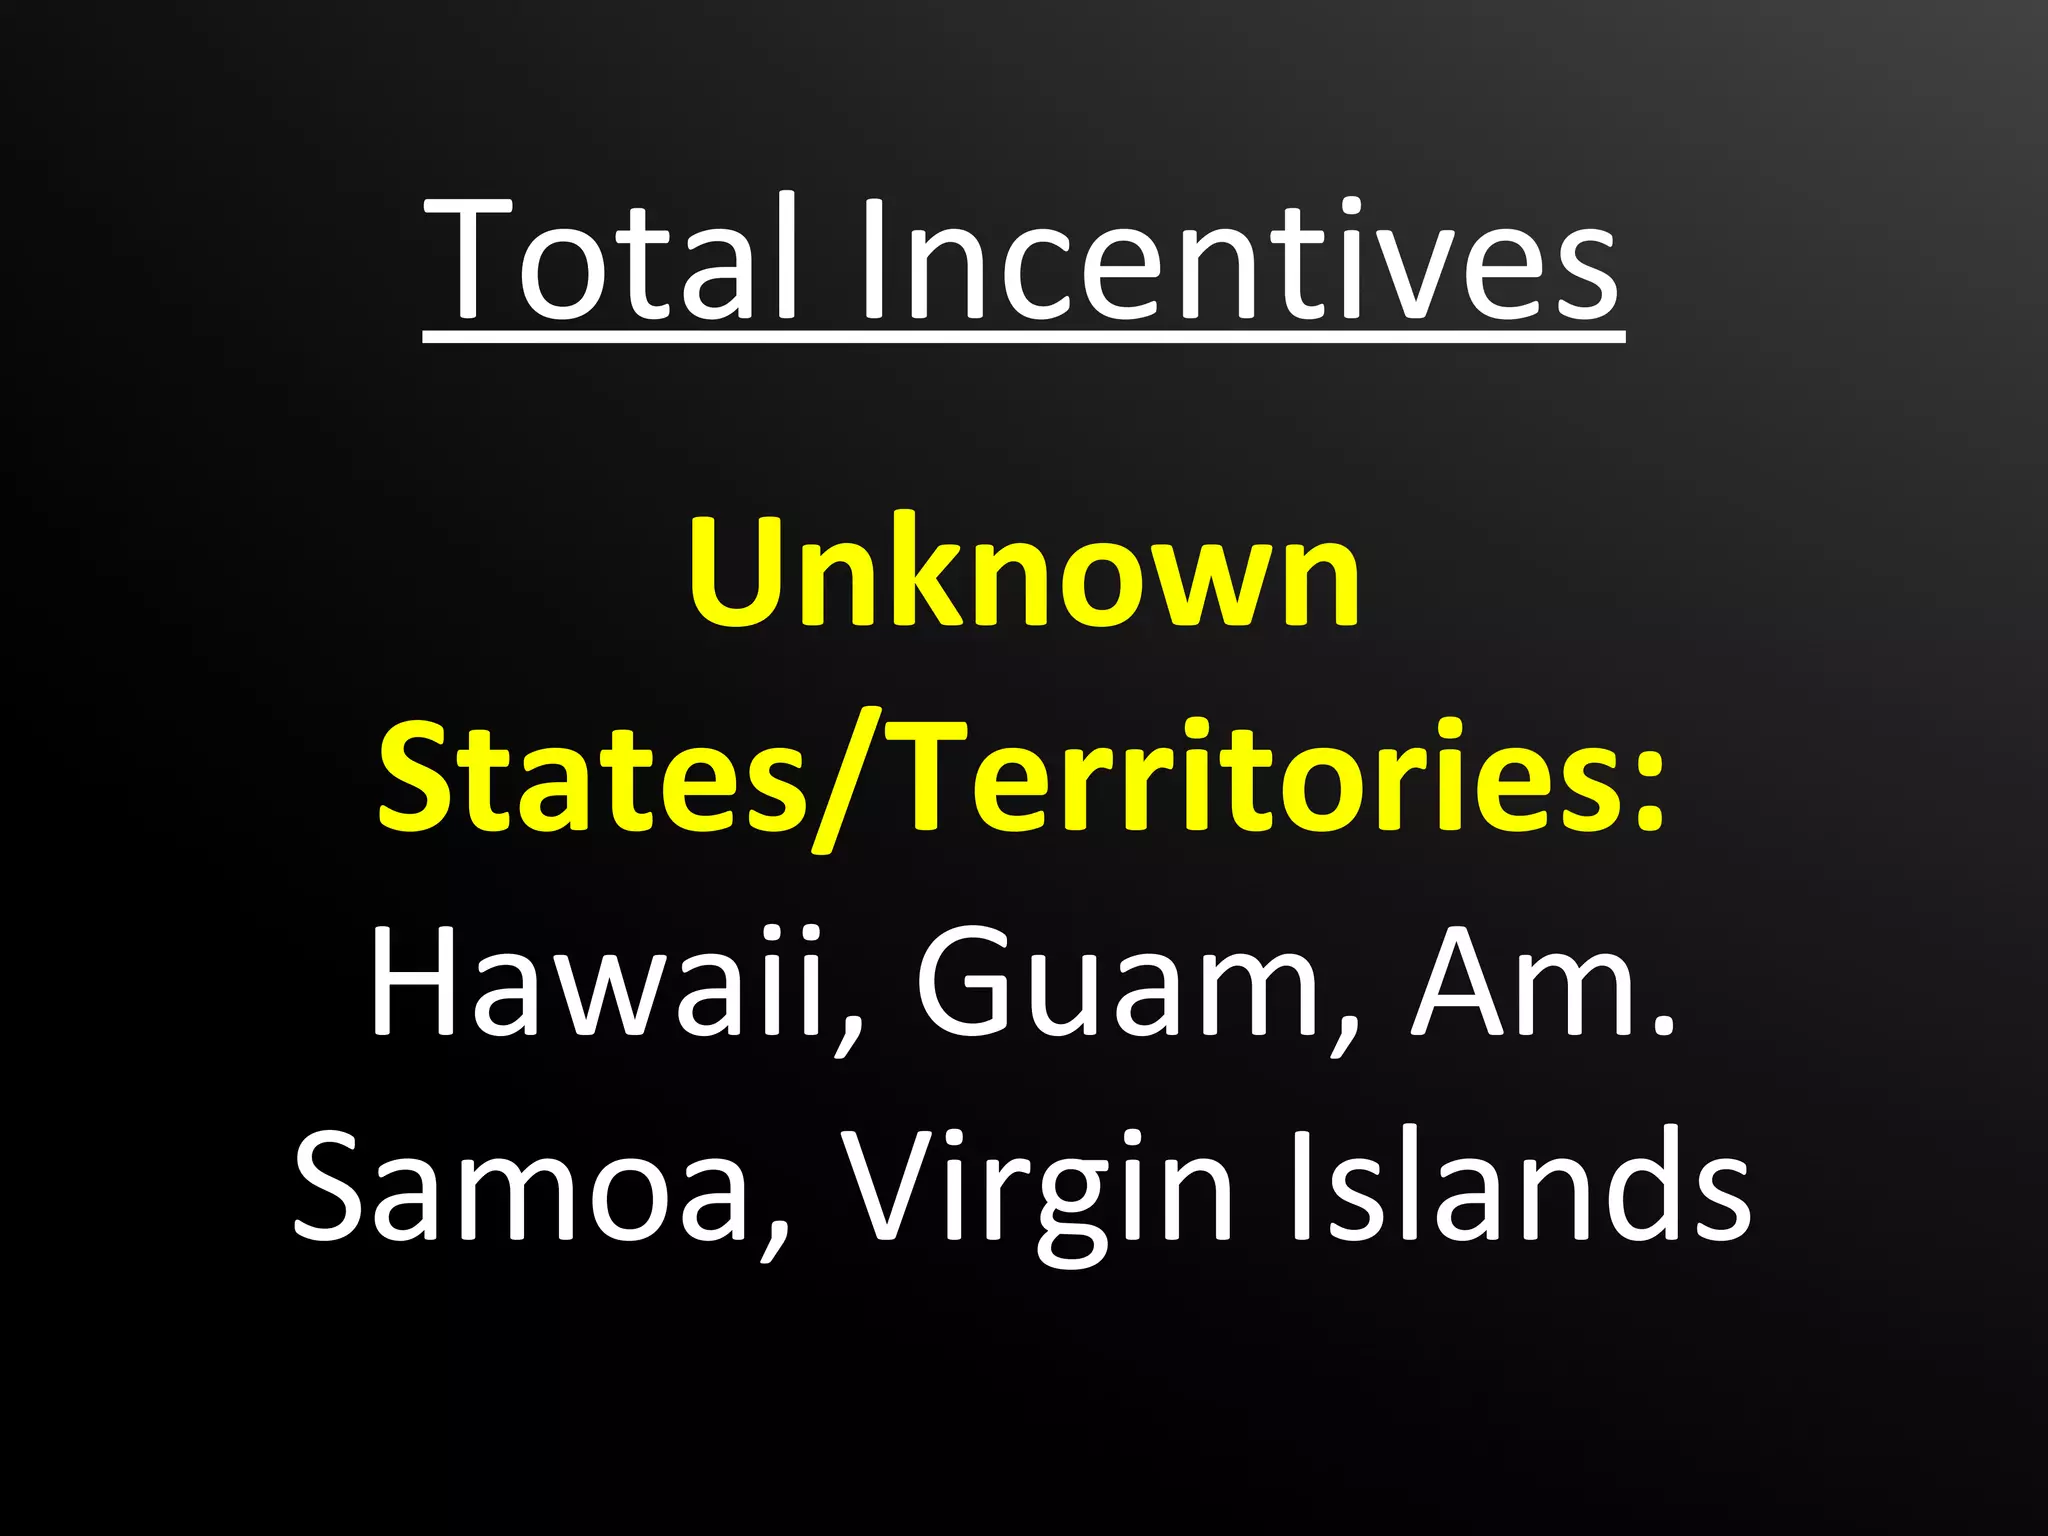


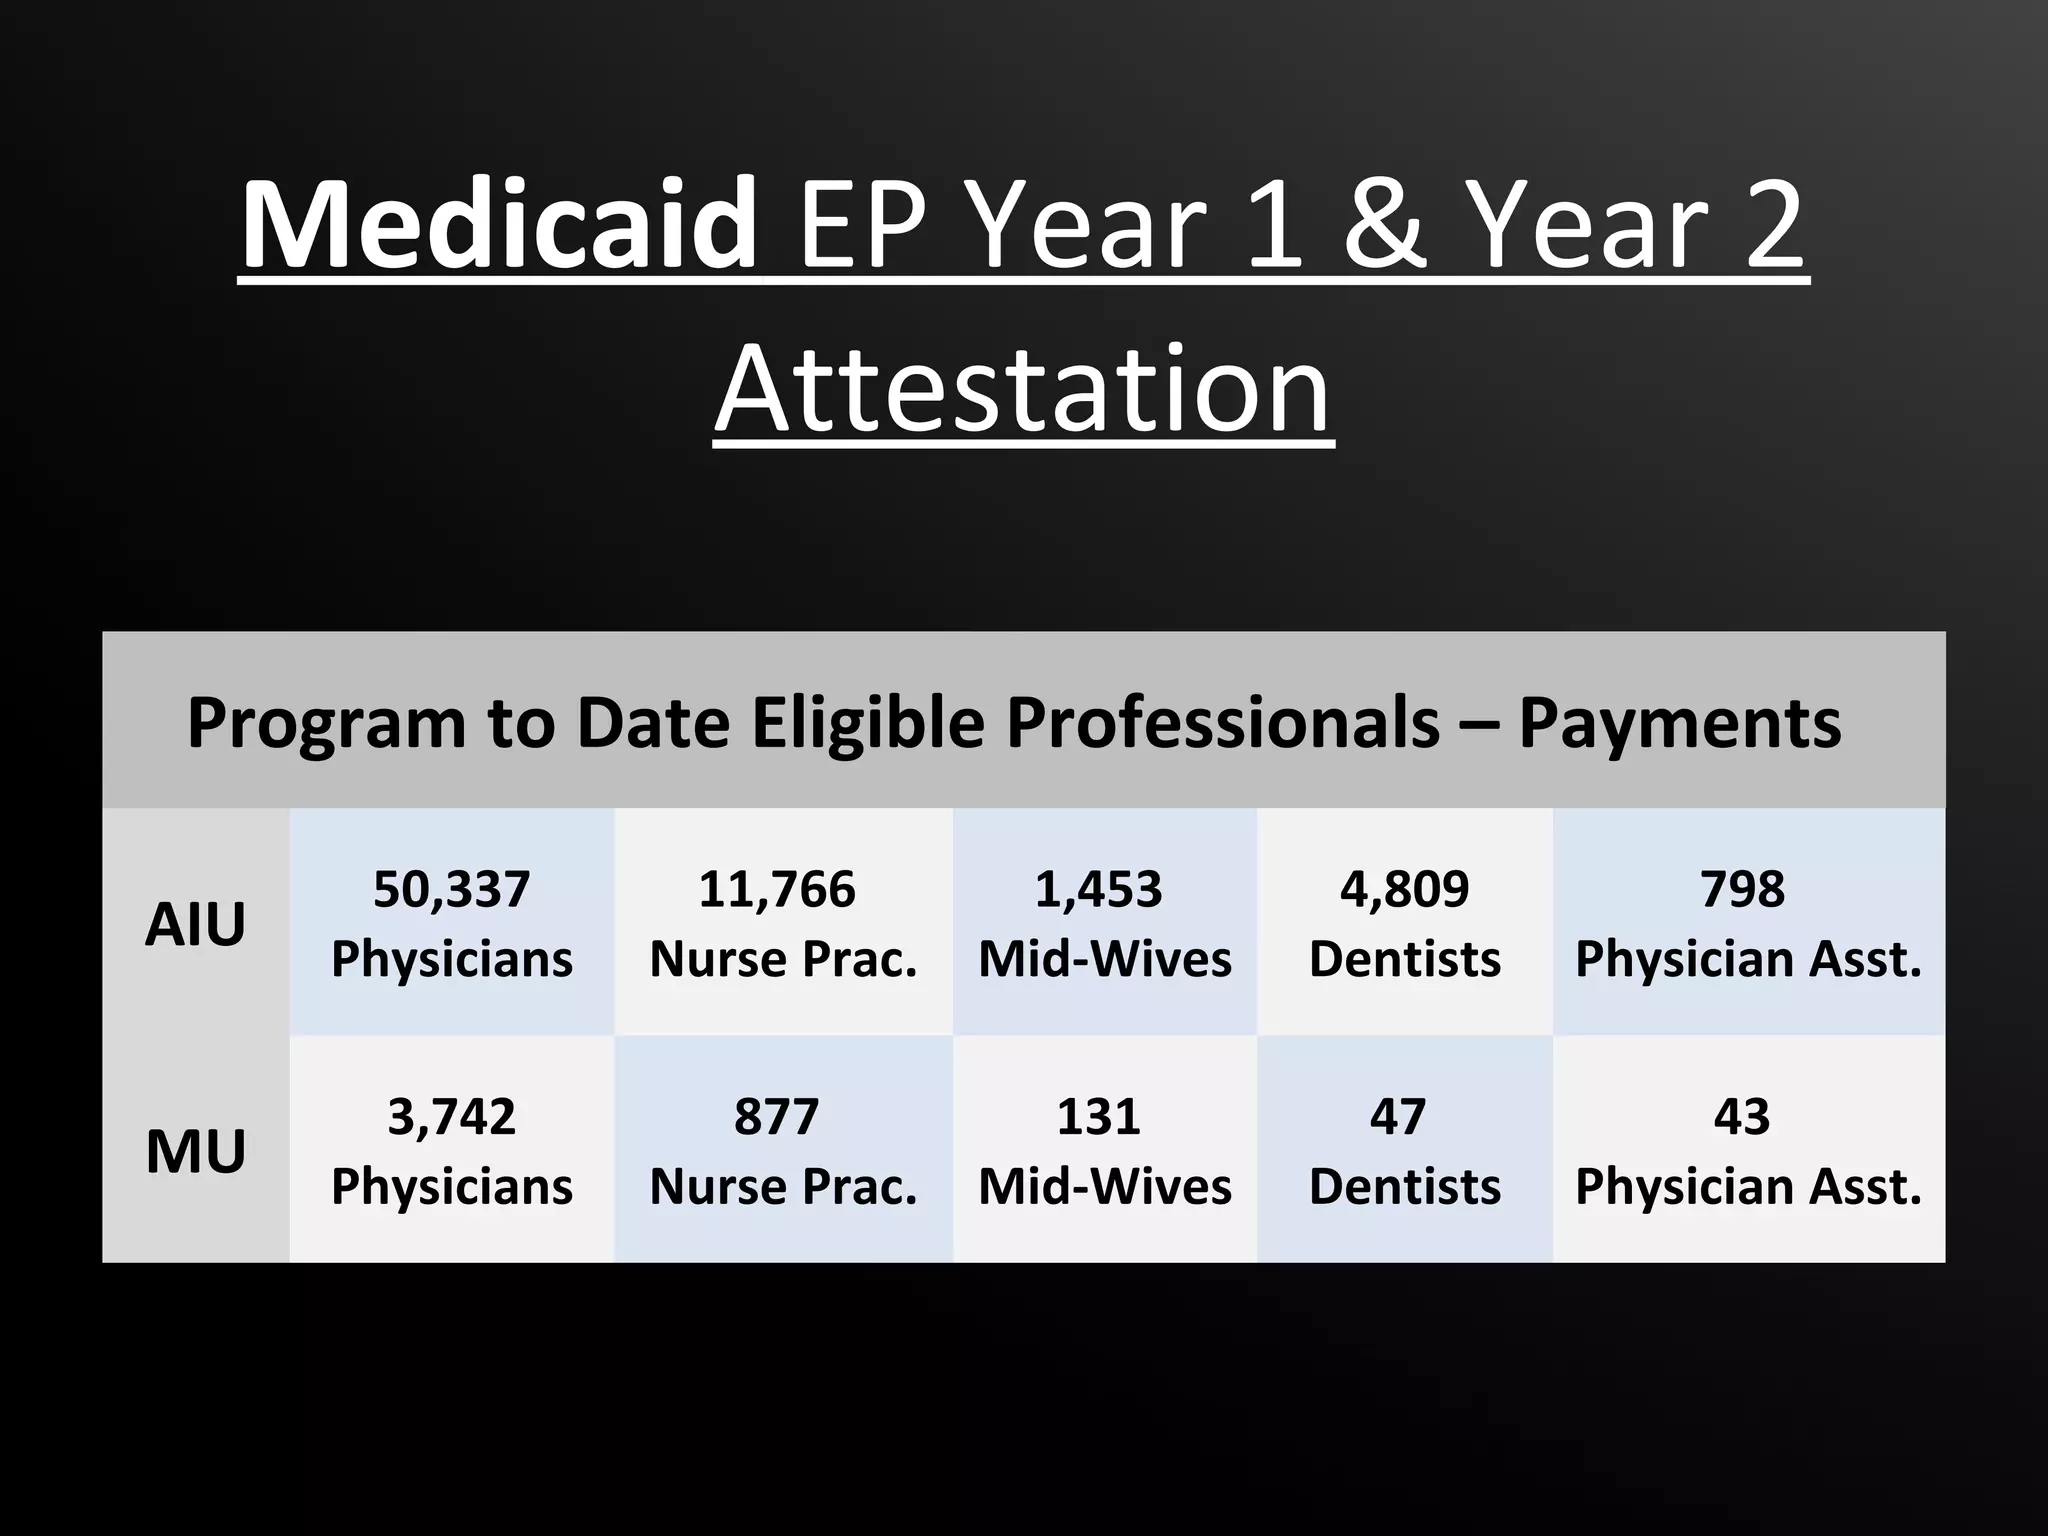

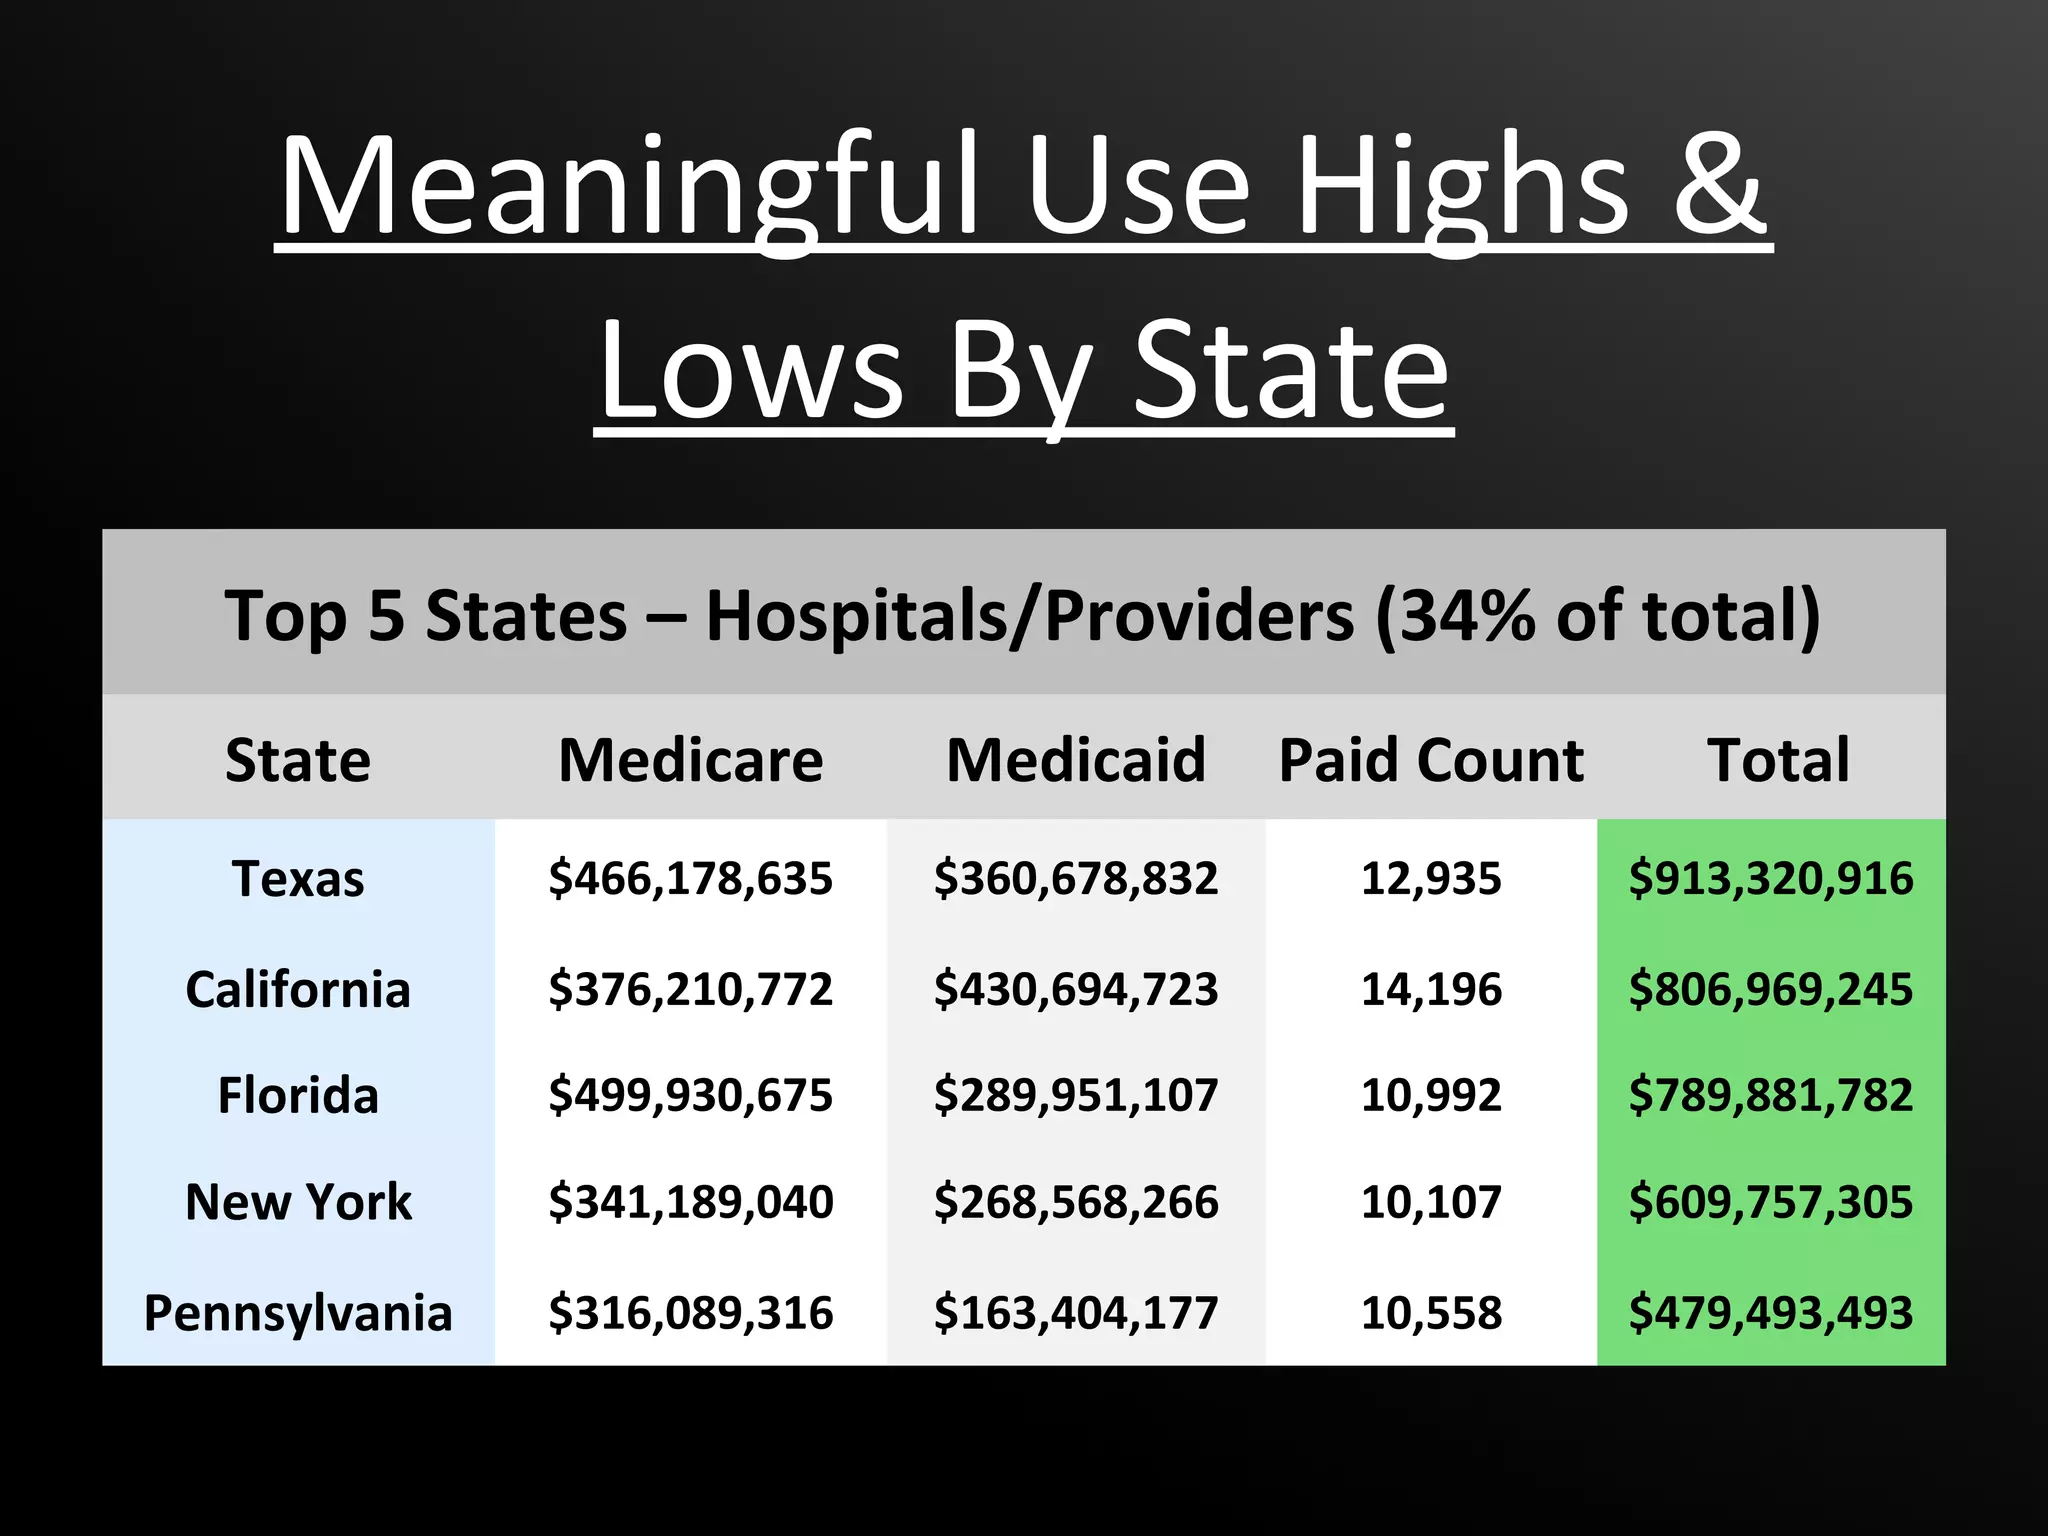
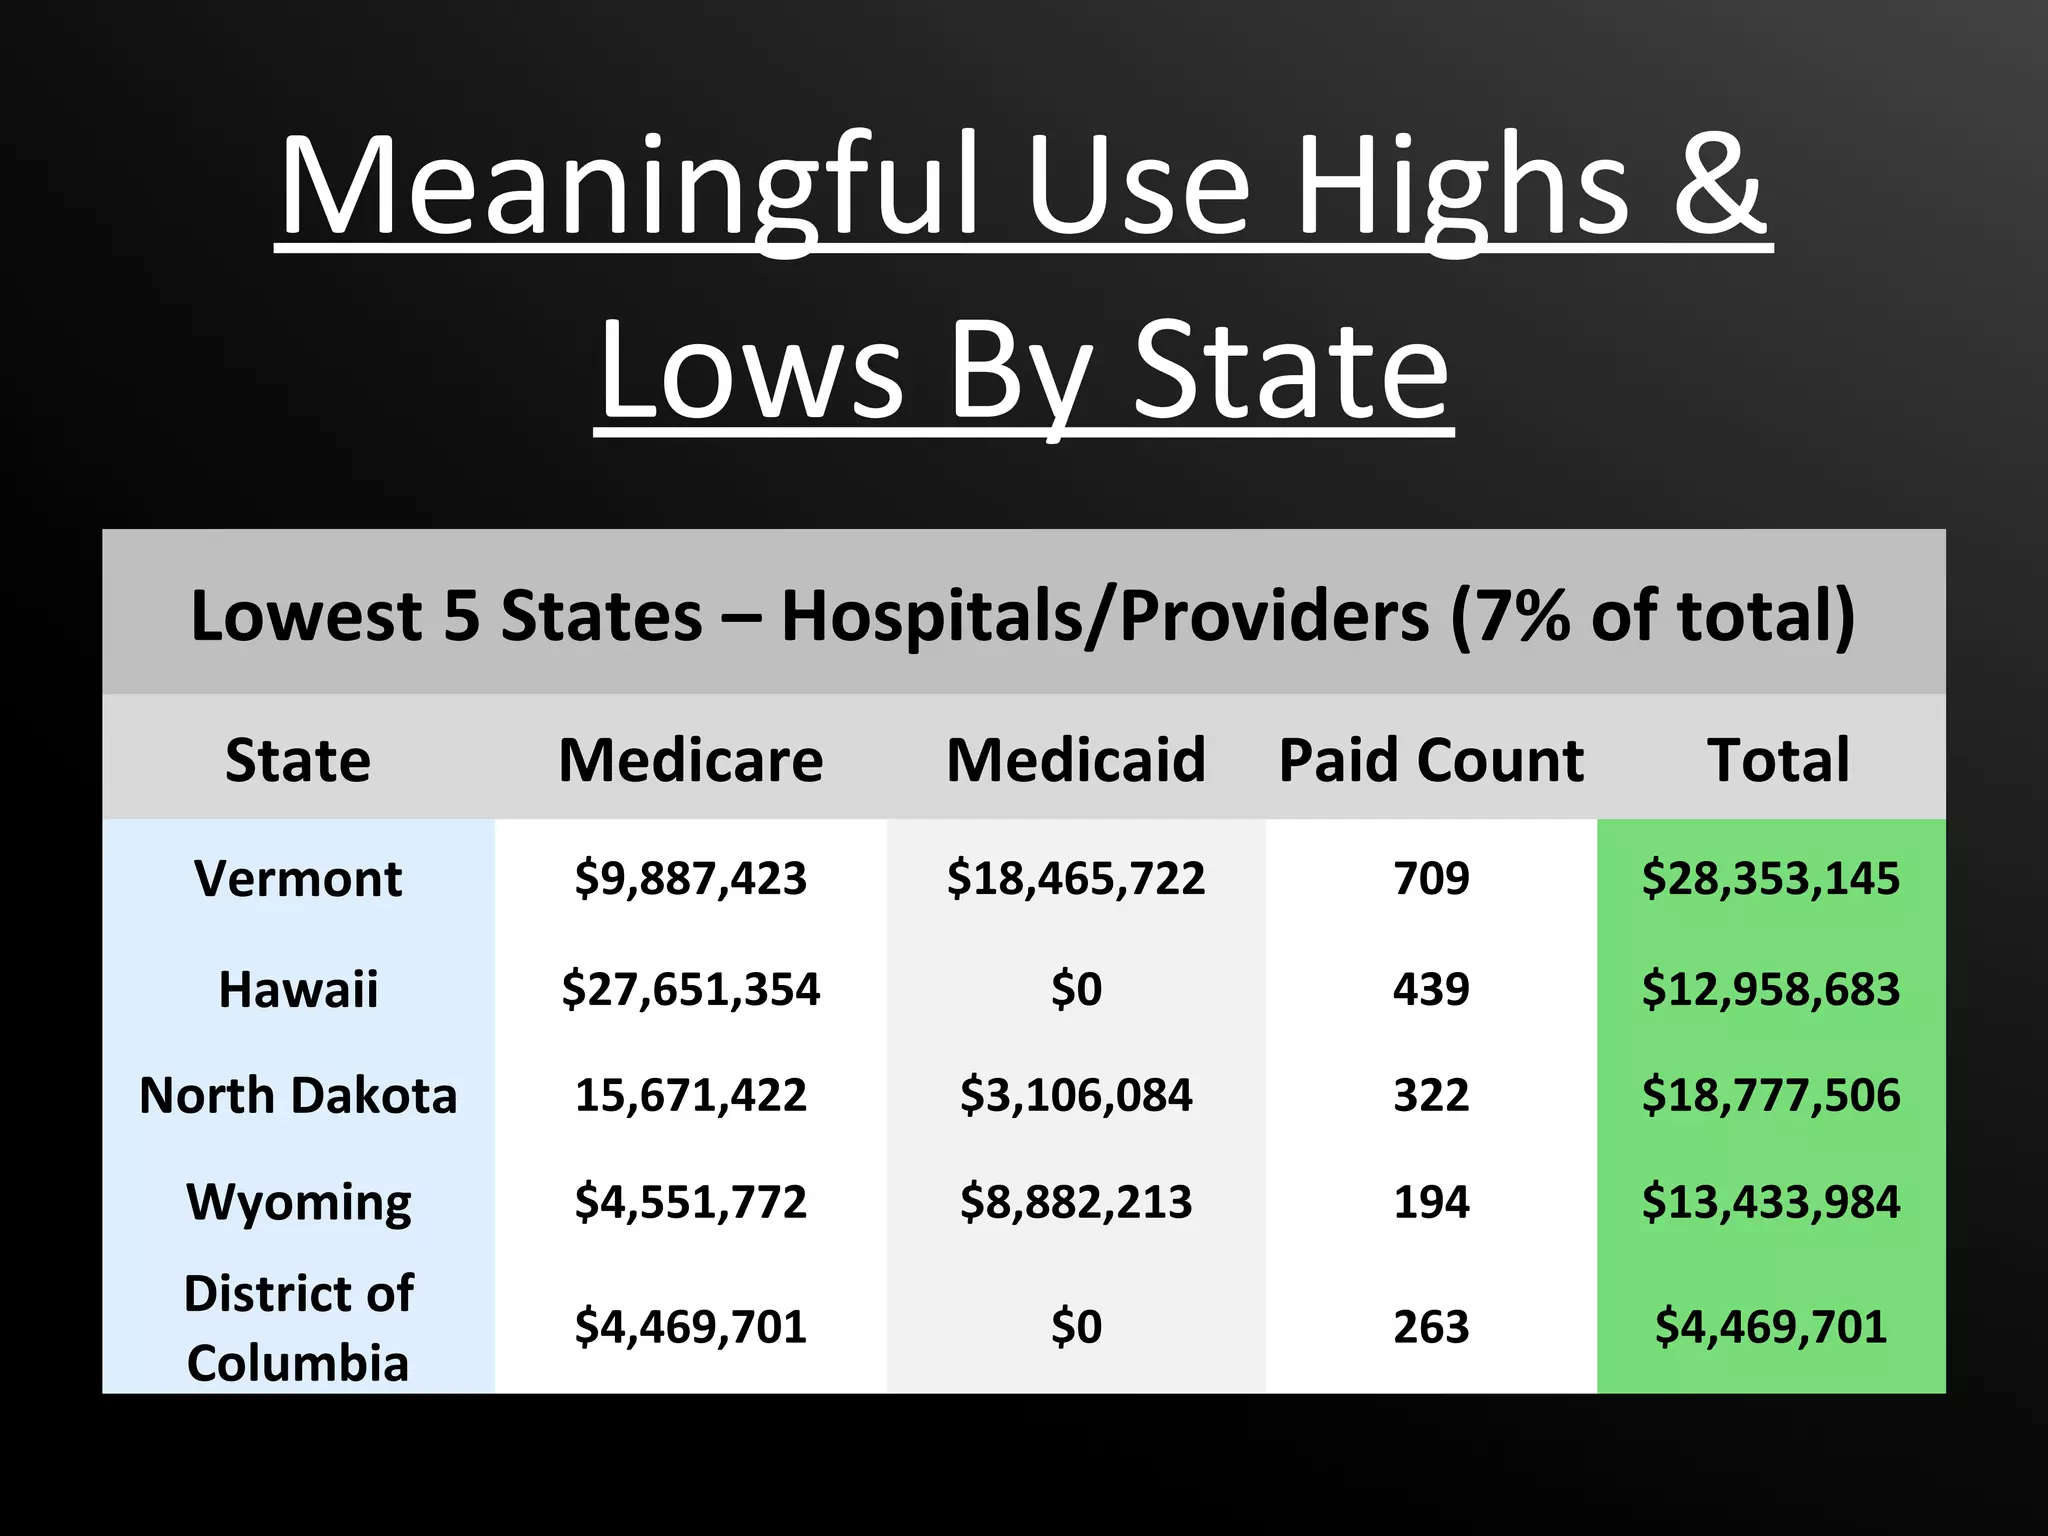


The document reports on the performance of meaningful use incentive programs, detailing a total of $10.7 billion in incentives distributed to hospitals and providers to date. It highlights that 355,000 hospitals and professionals have registered, with disparities in participation among states and providers. The document also lists the top states receiving incentive payments and compares Medicare and Medicaid payouts across various categories.


