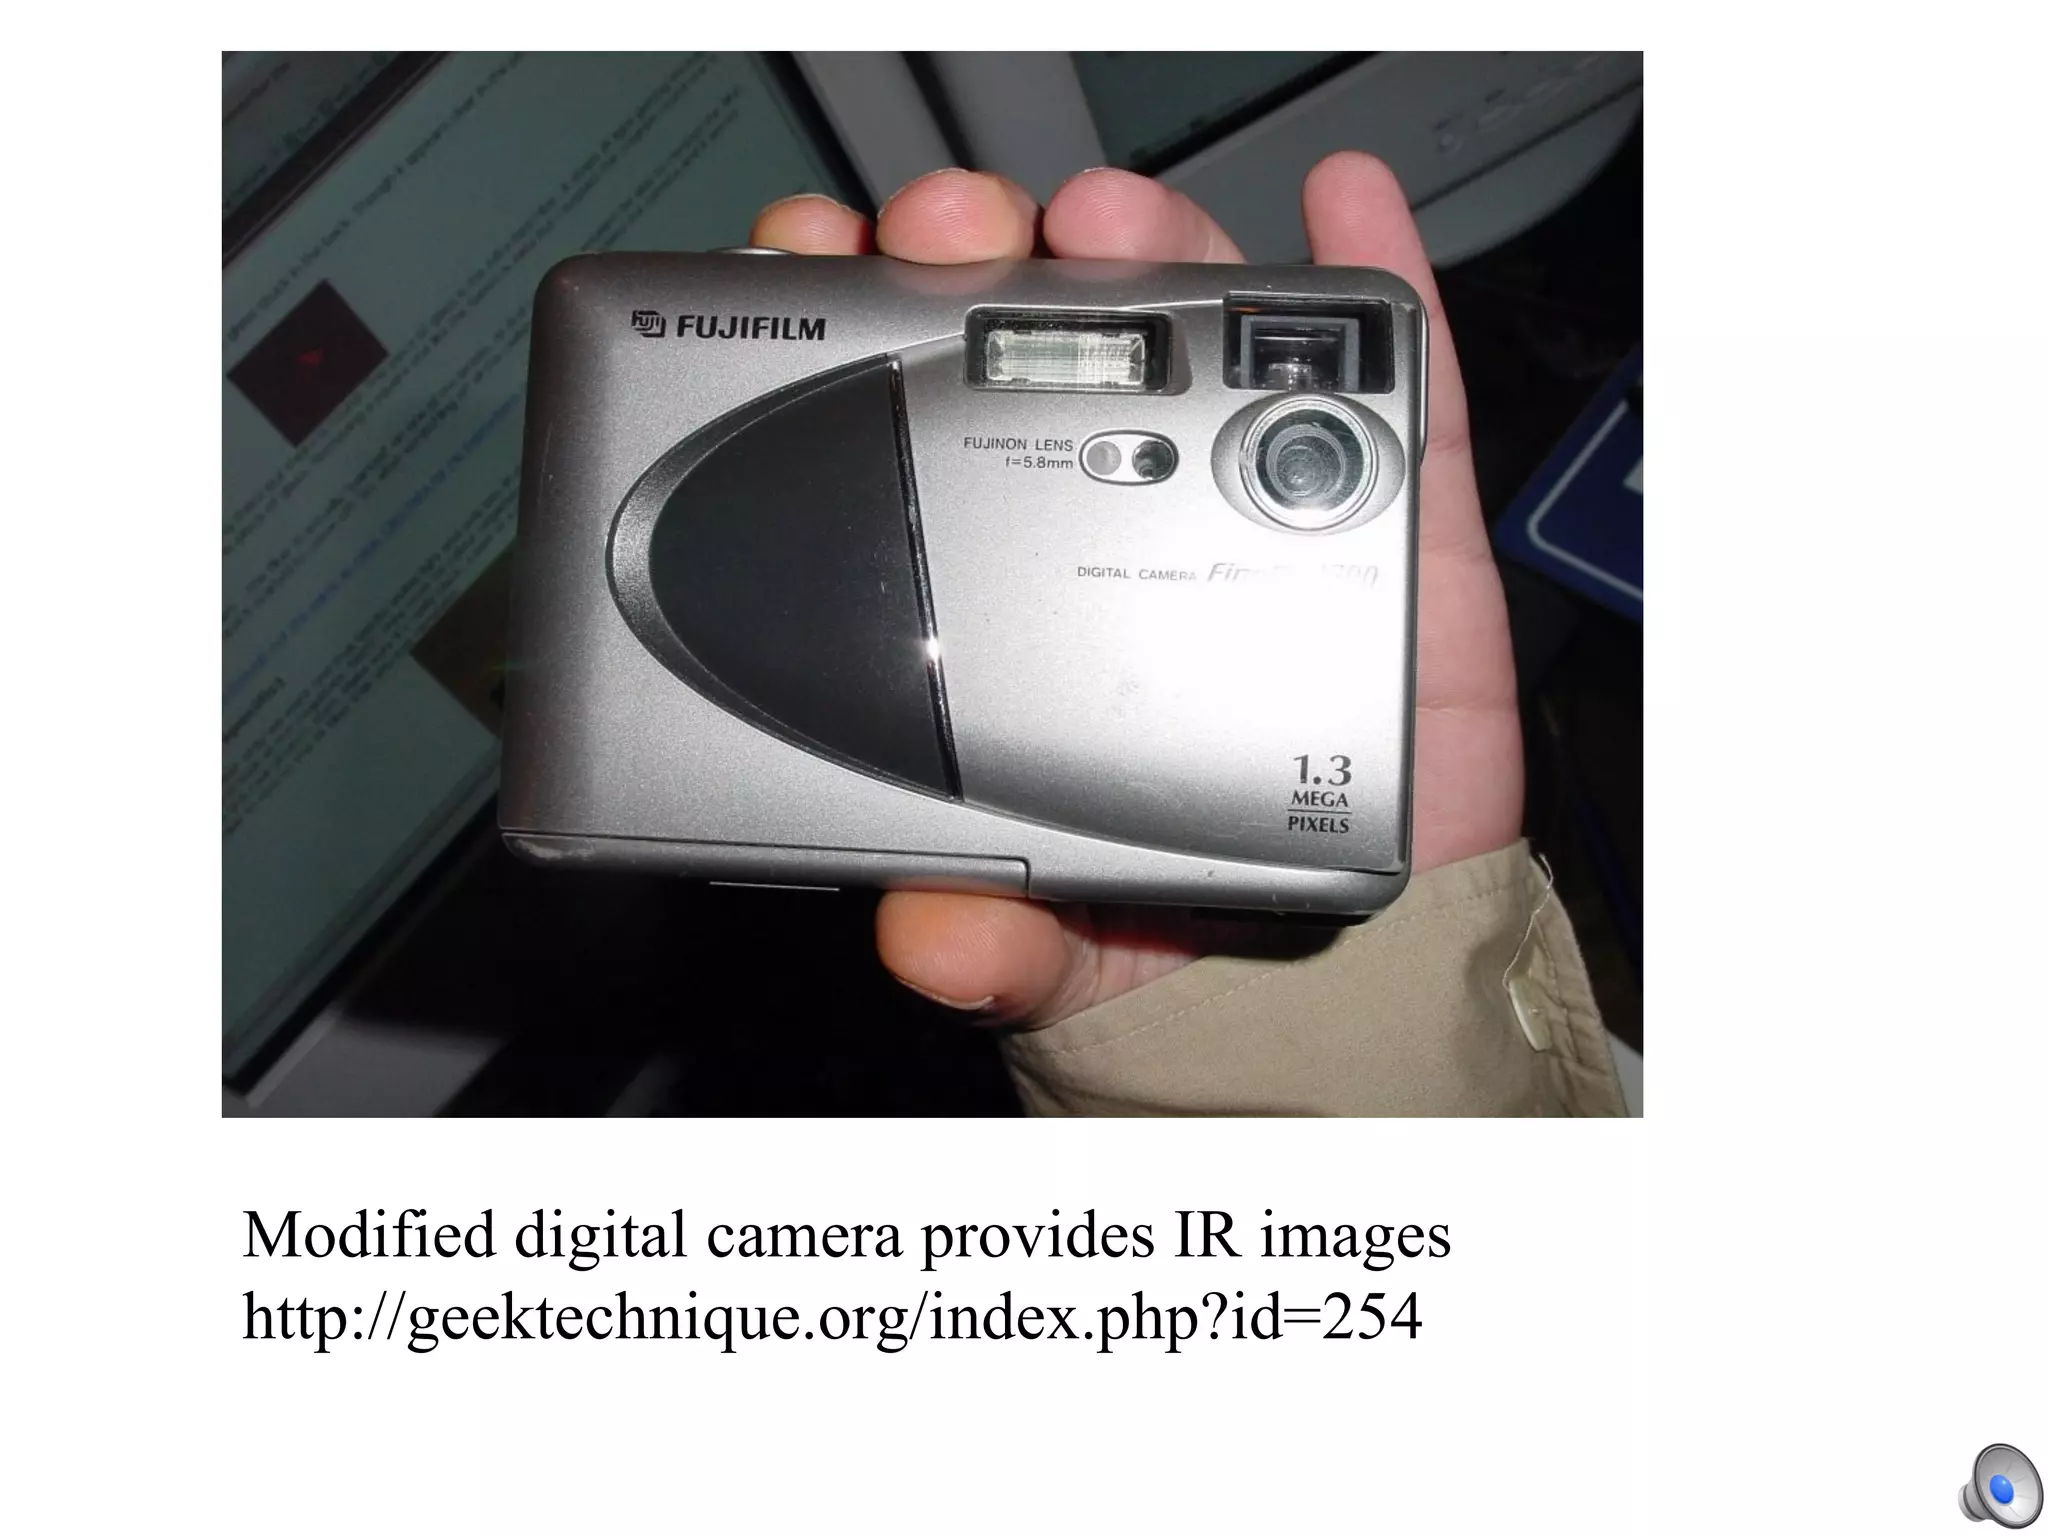
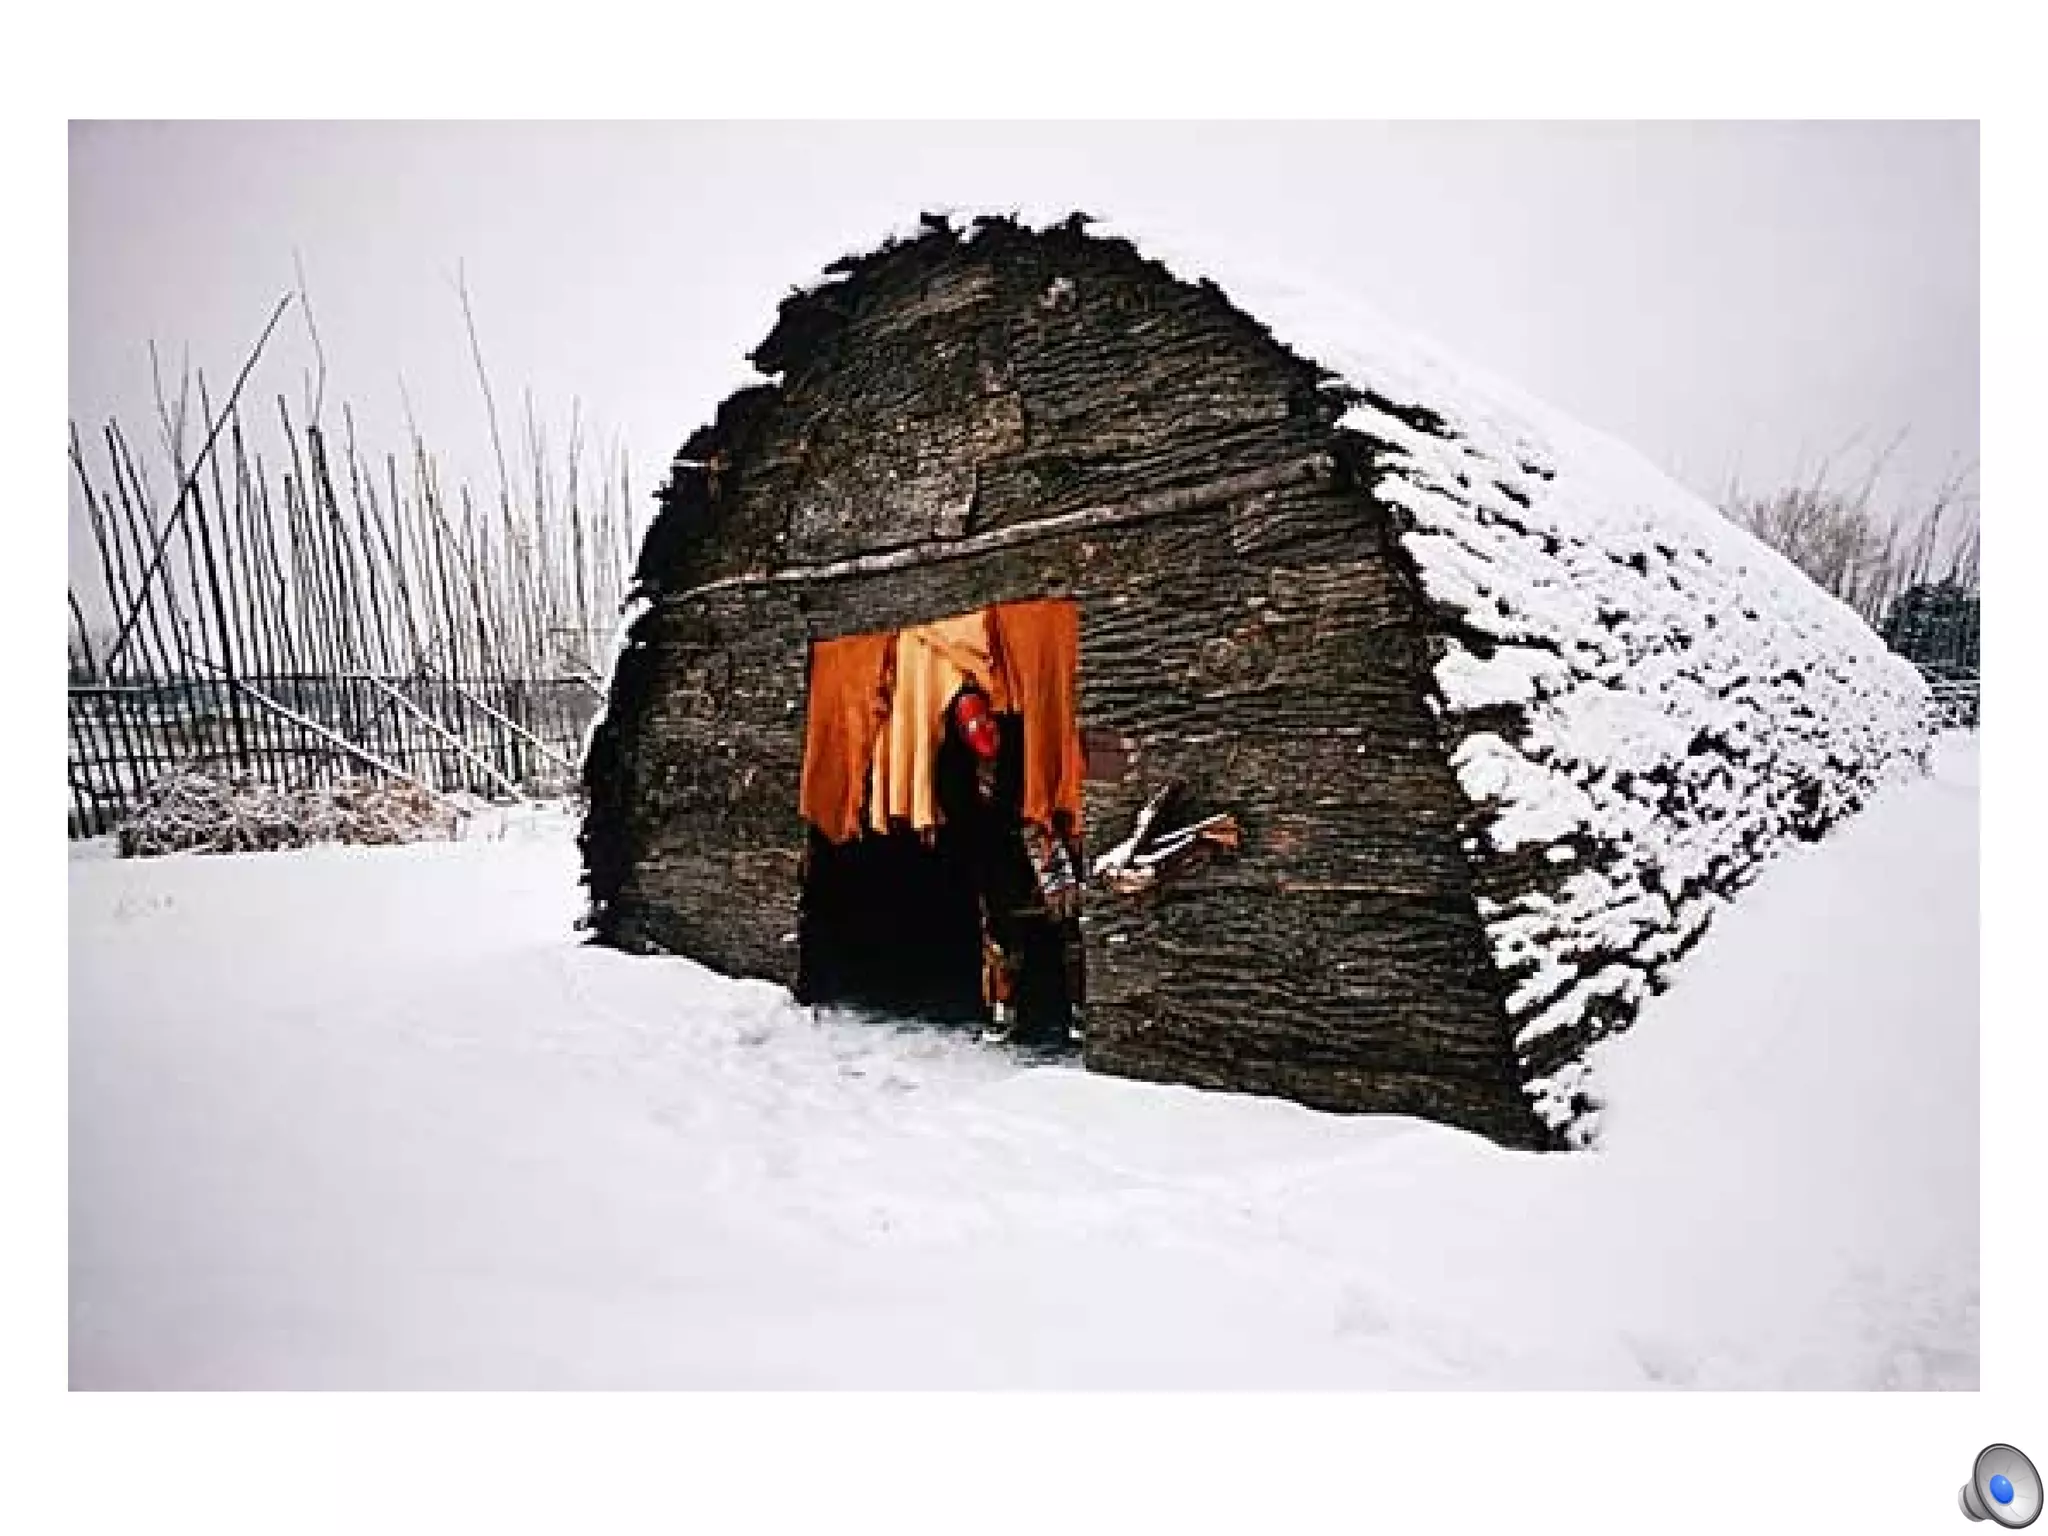
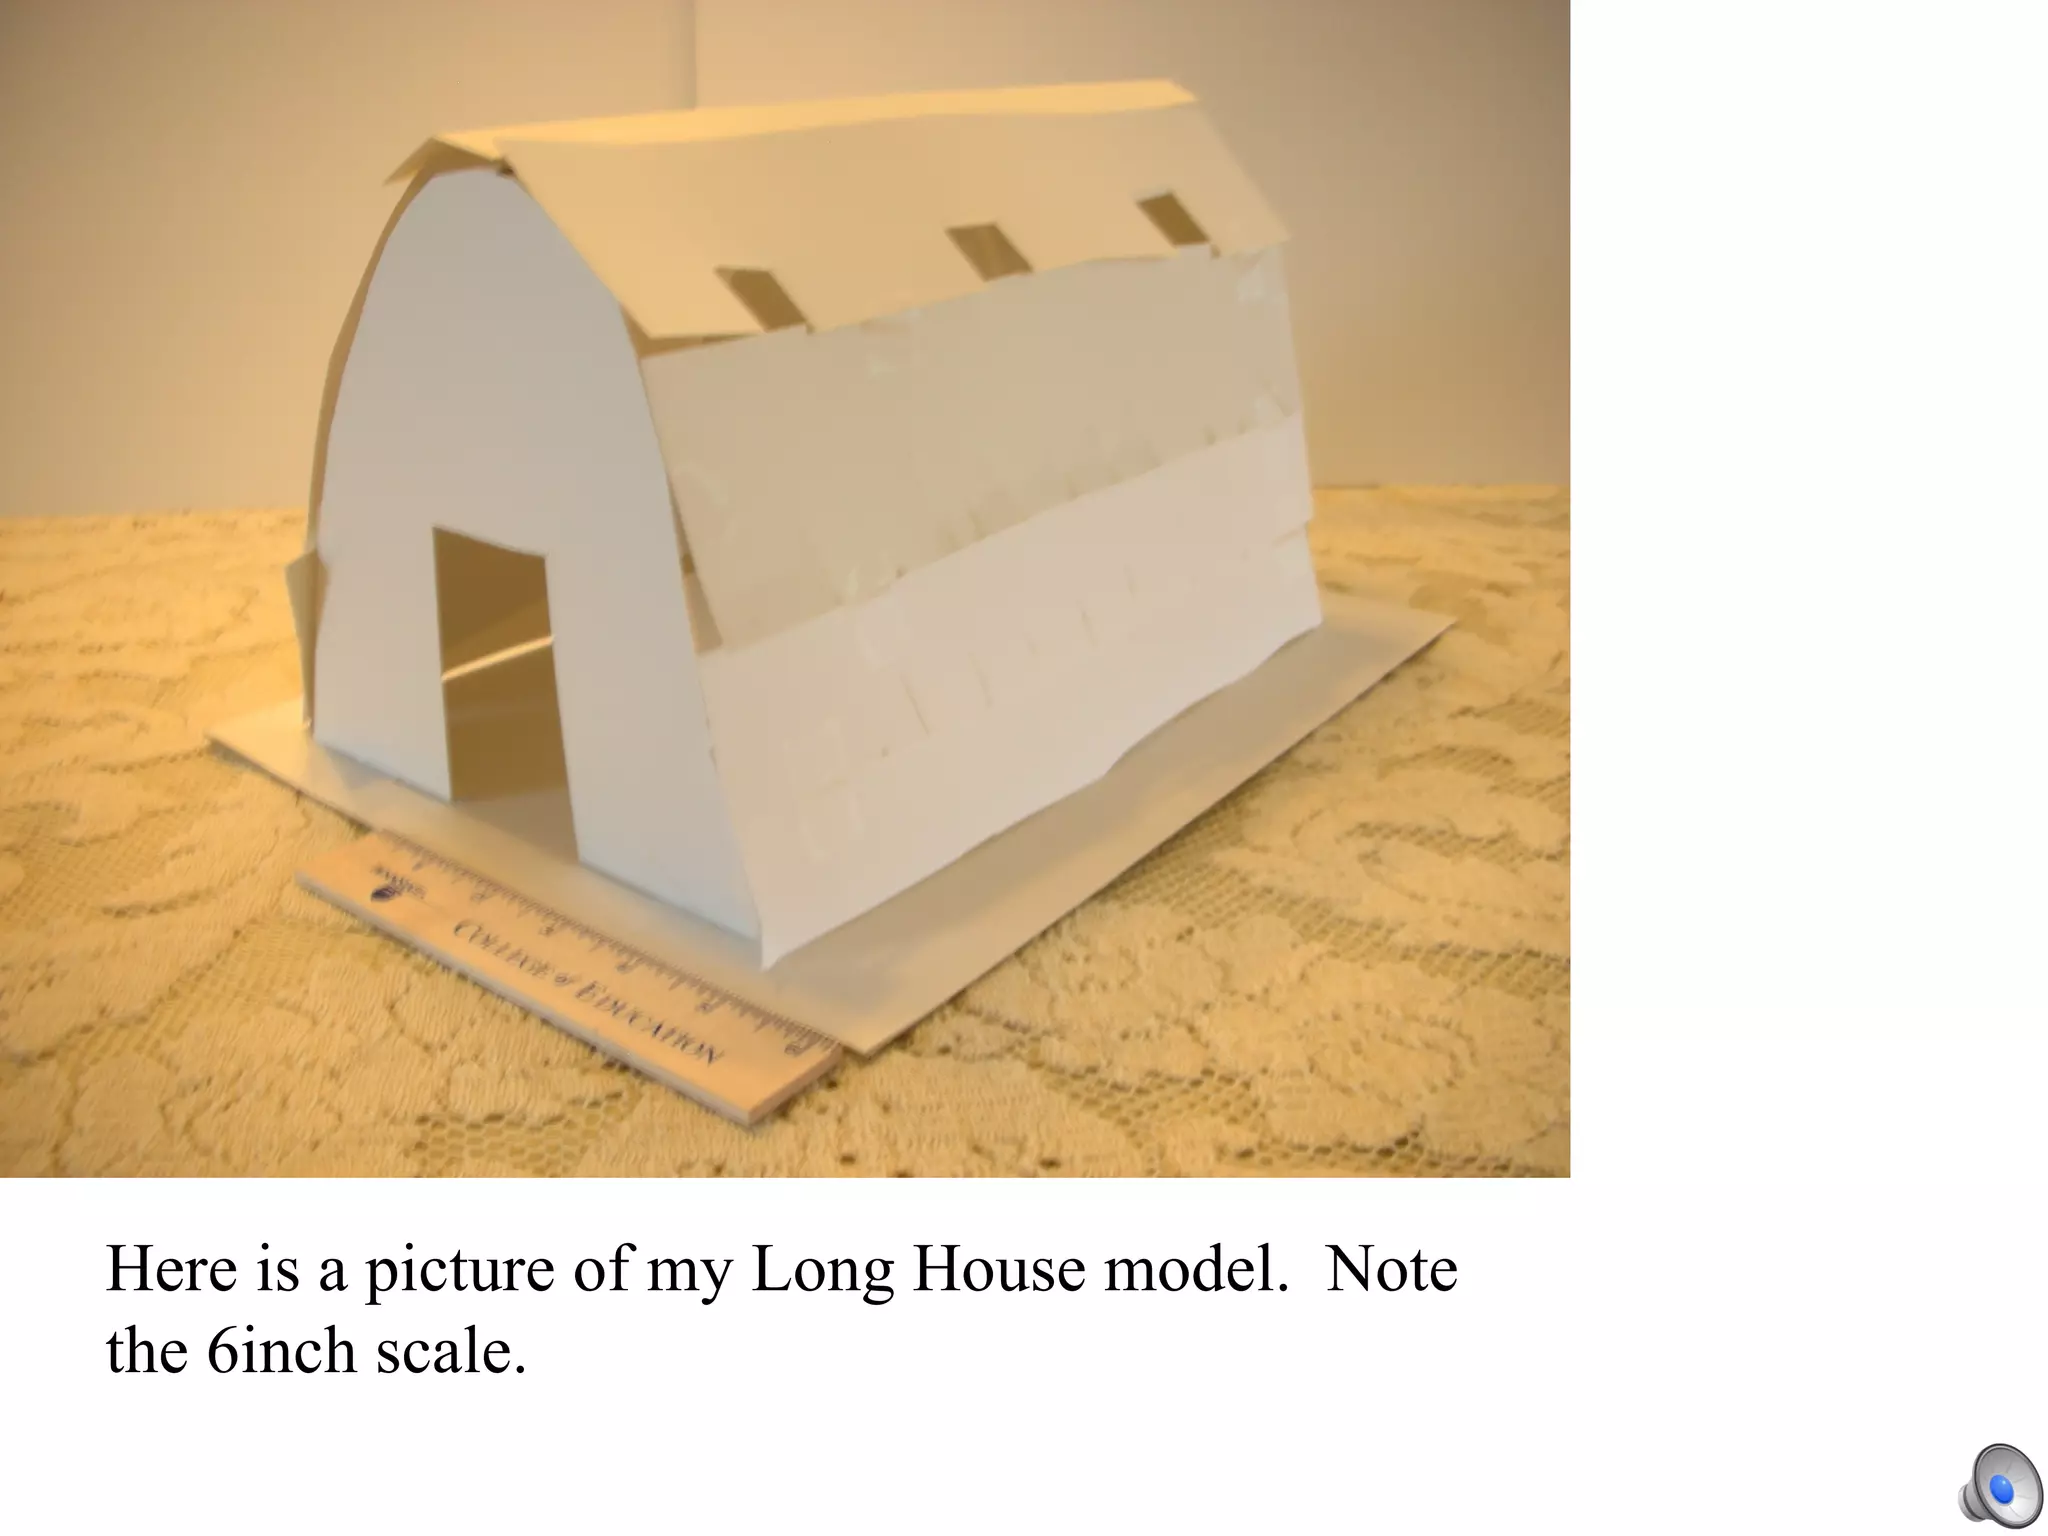
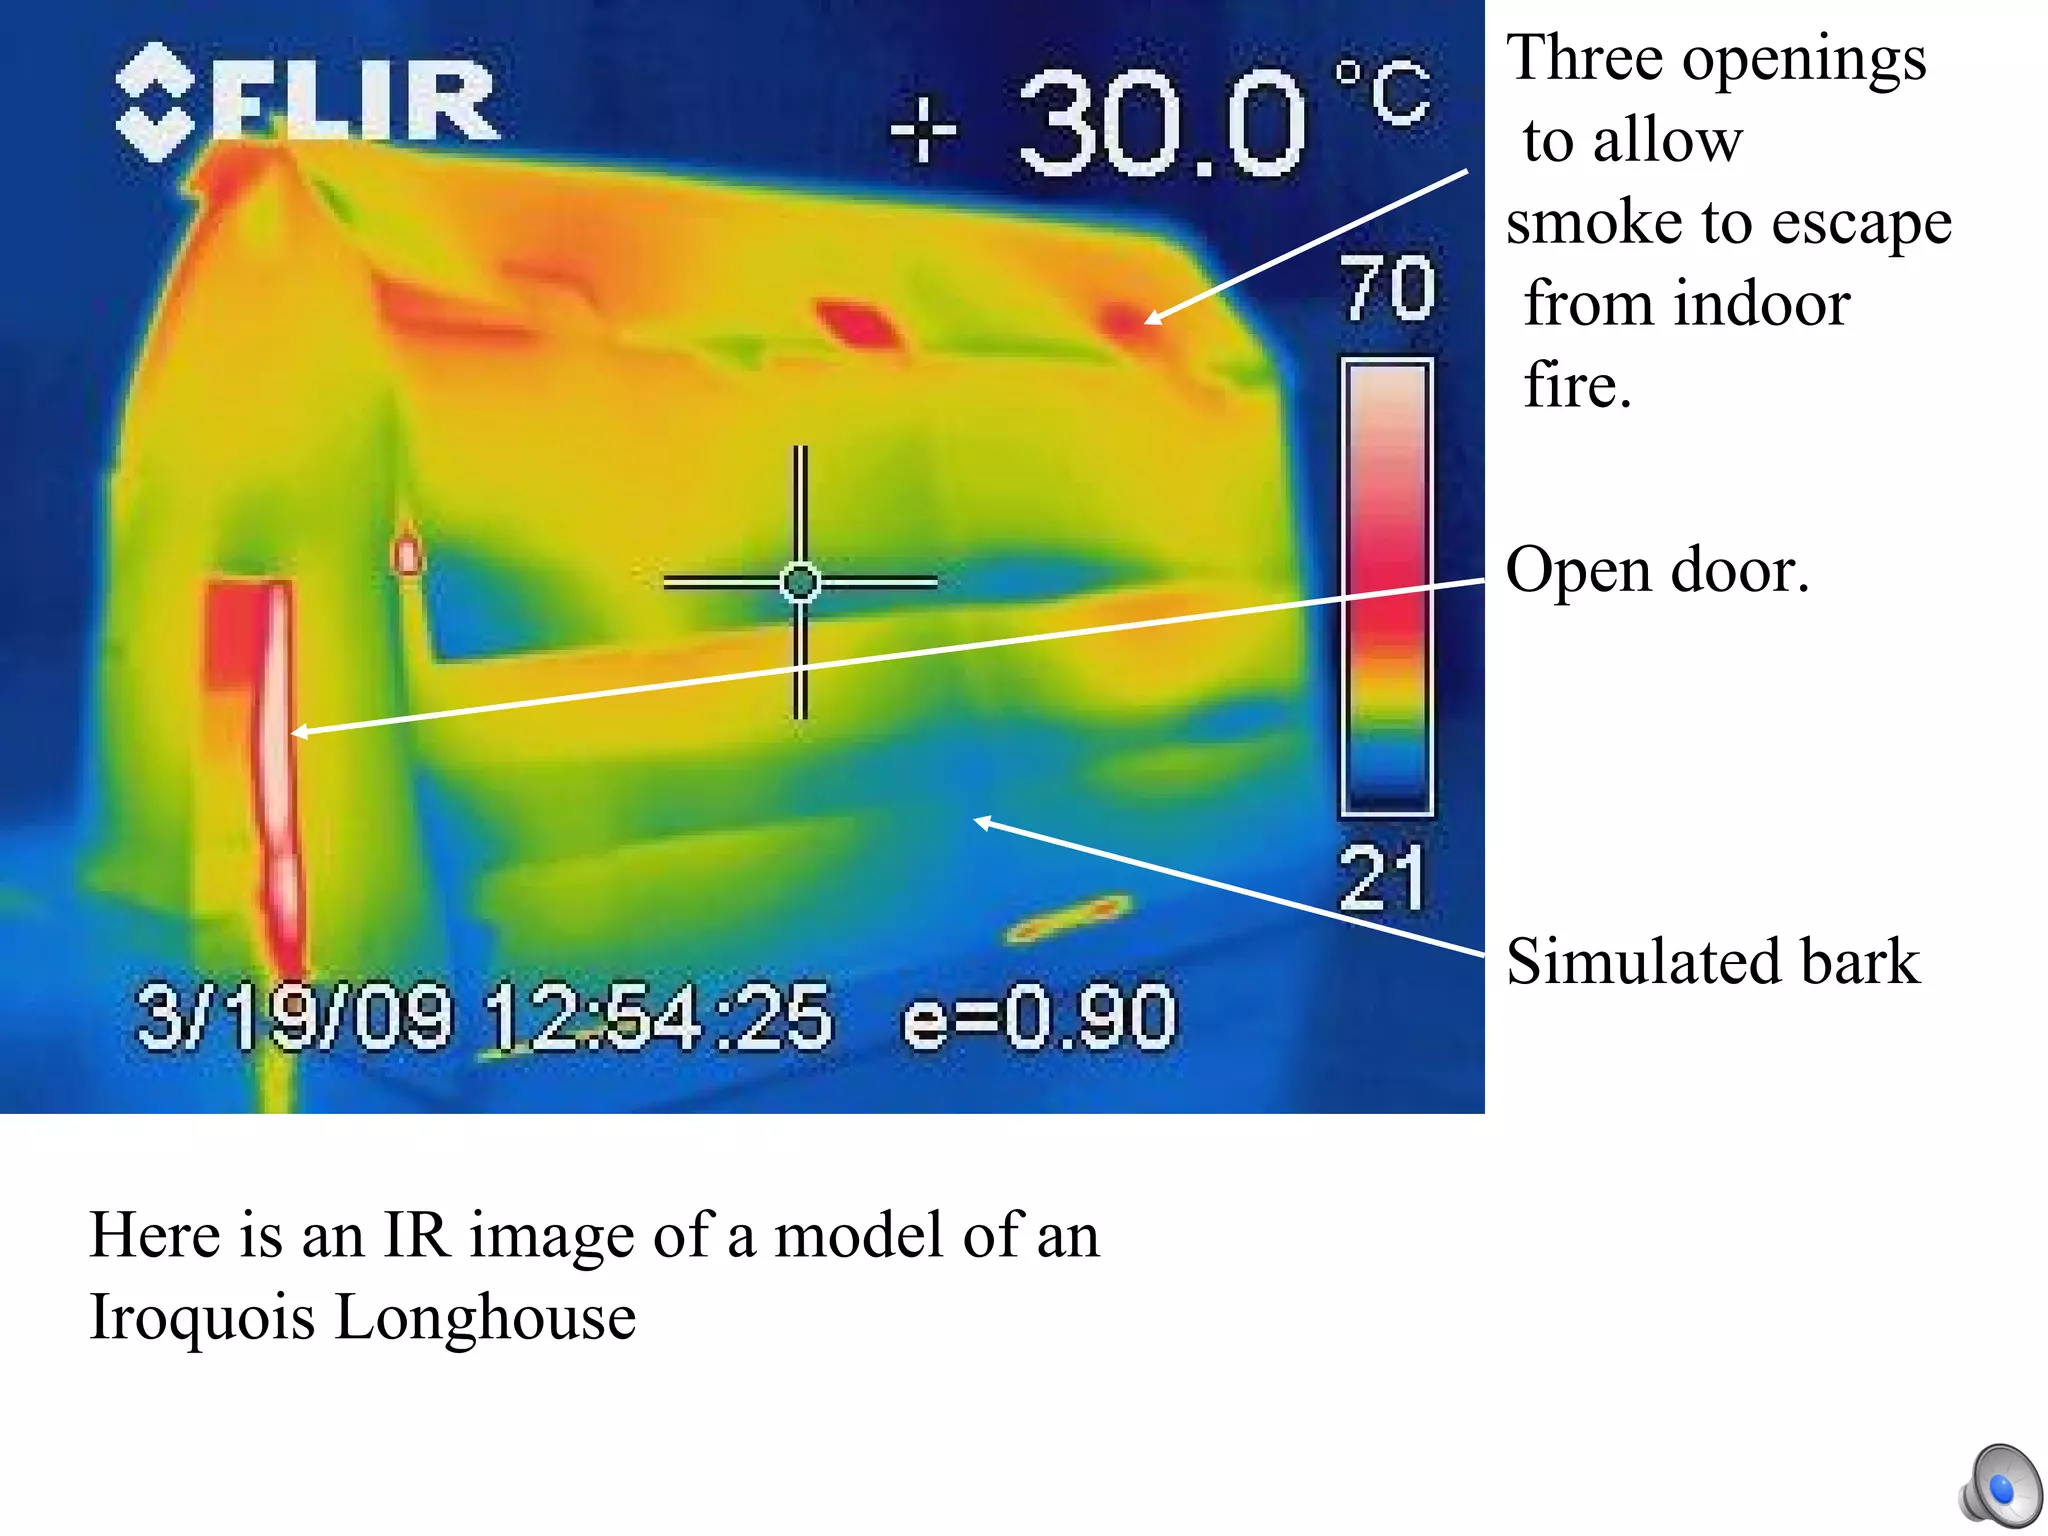
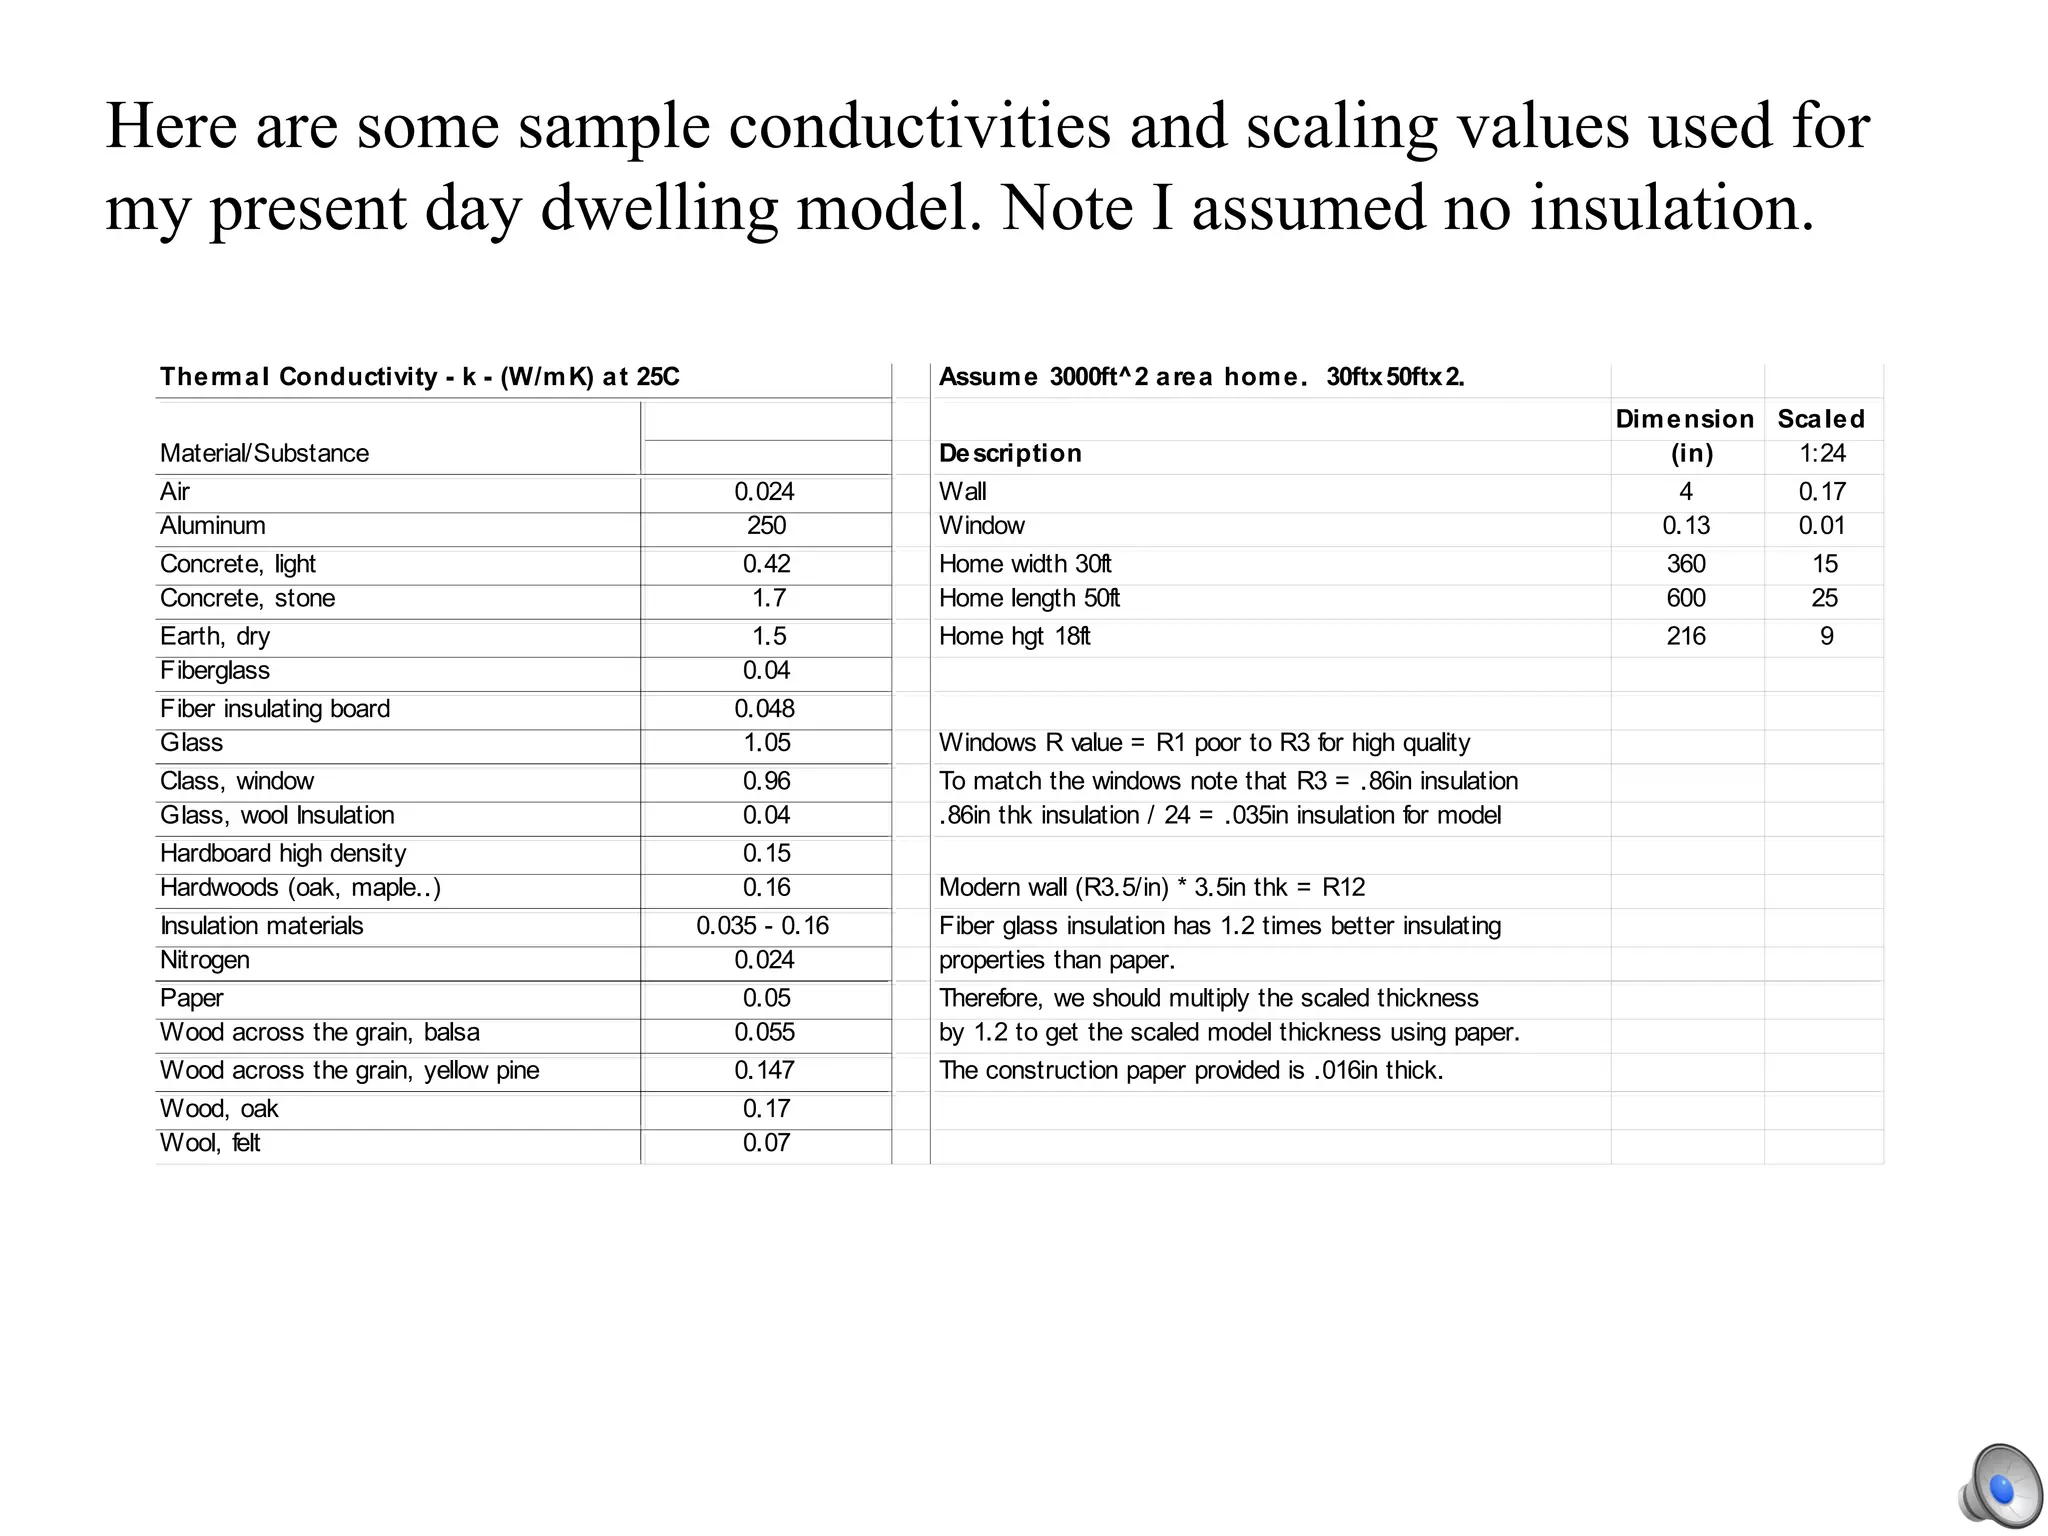
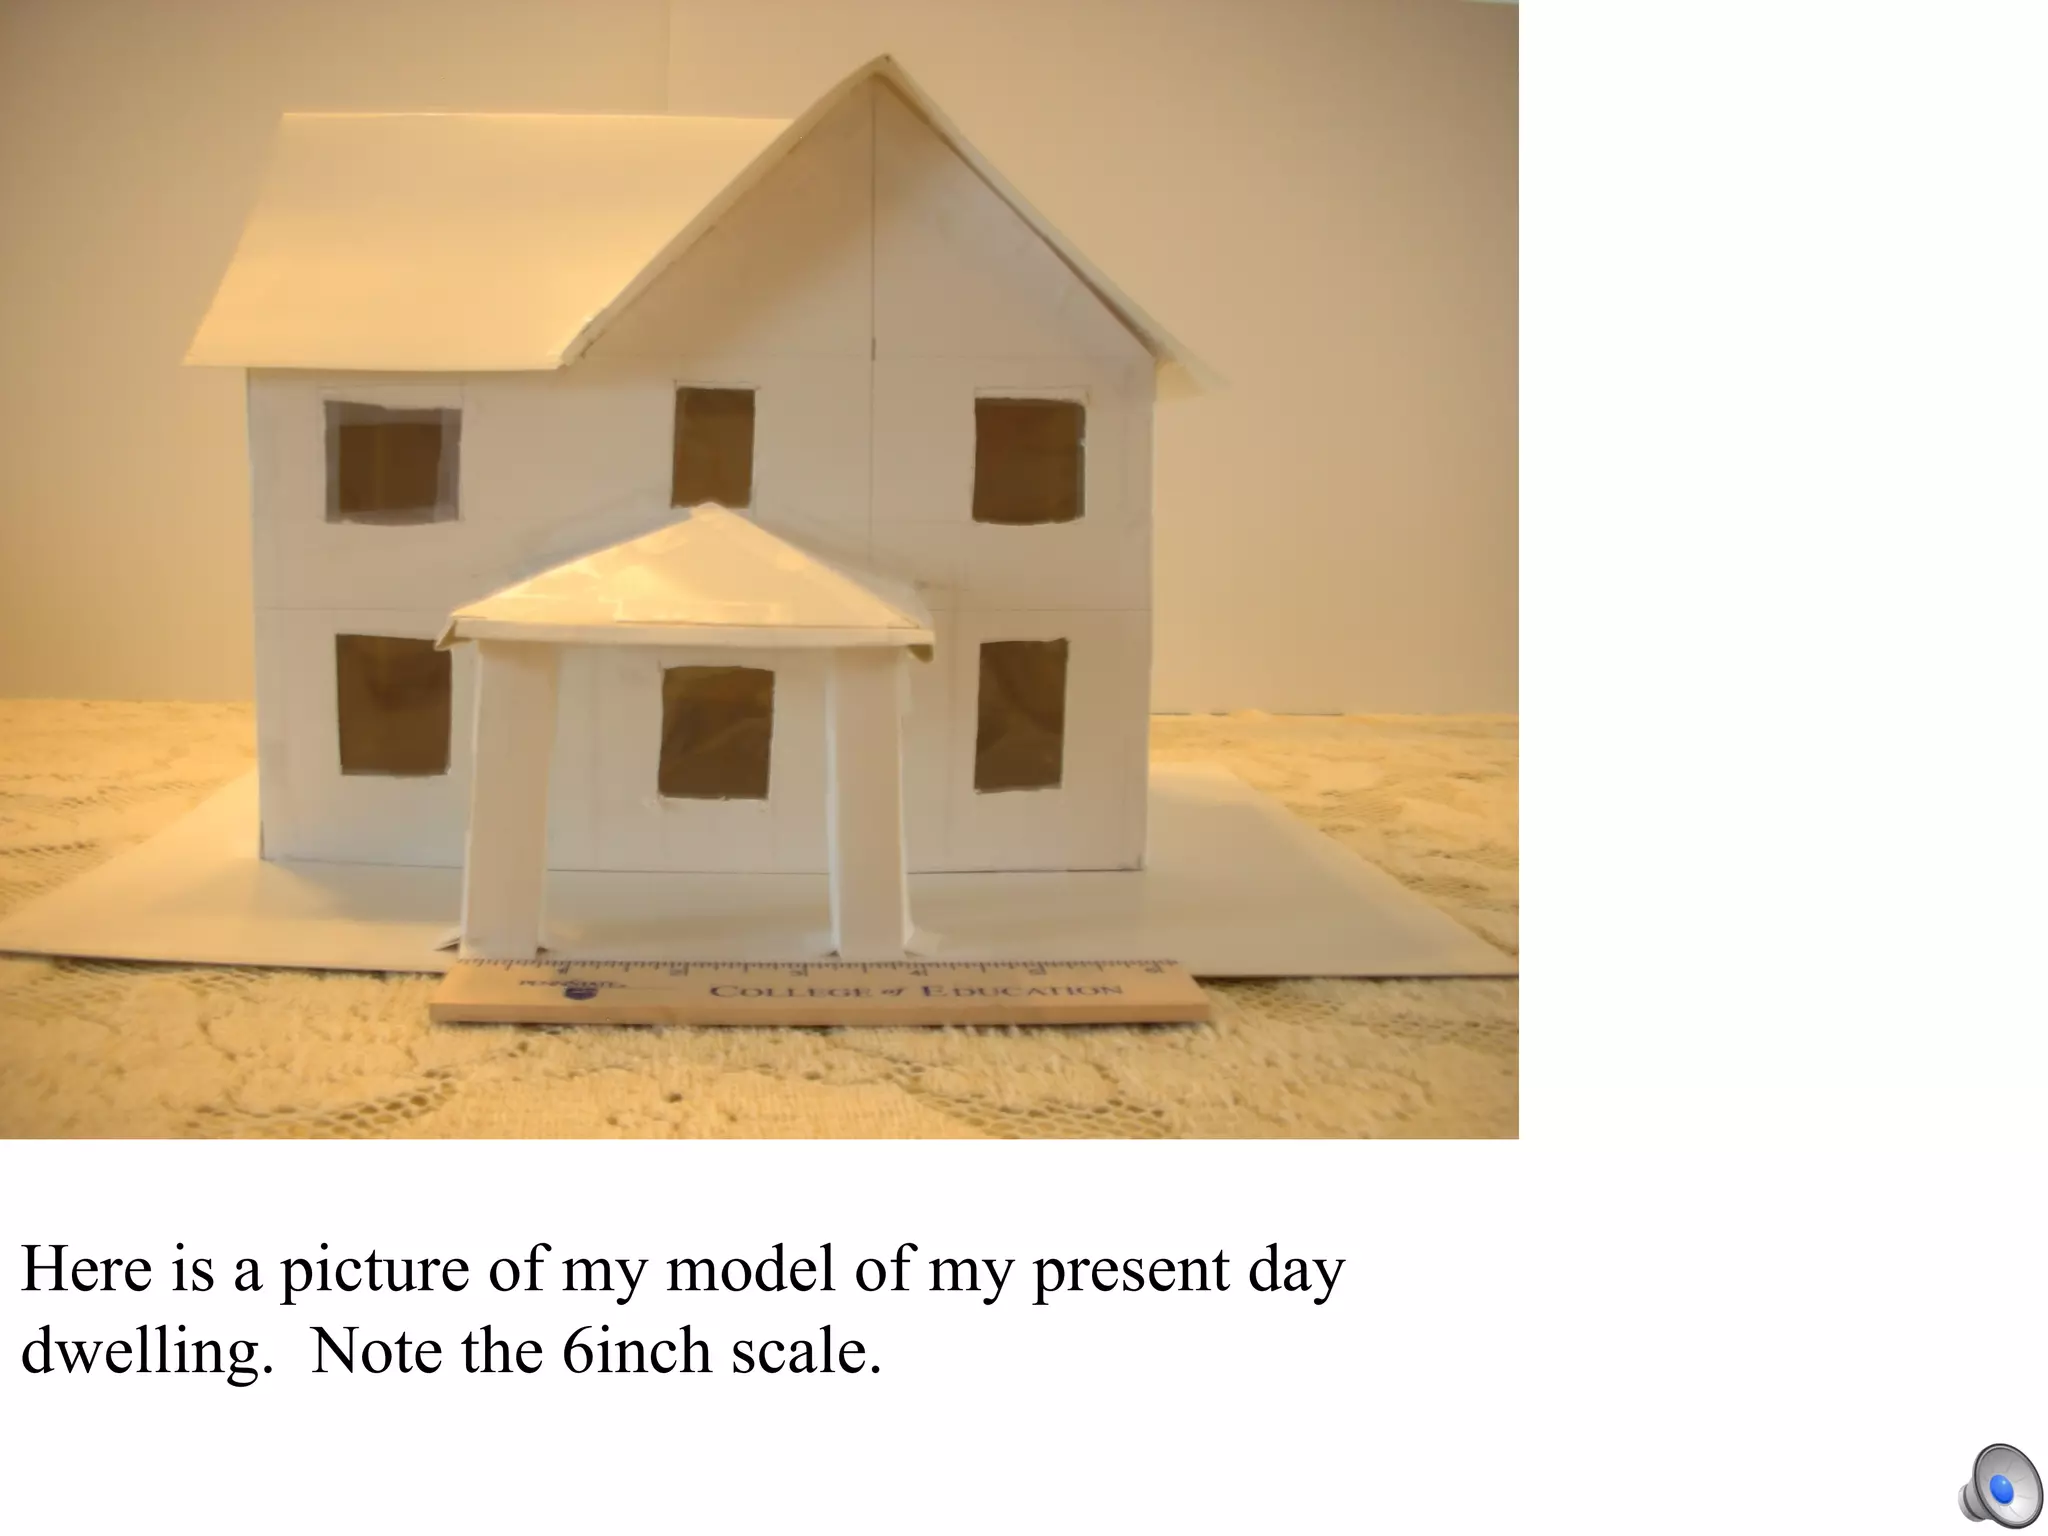
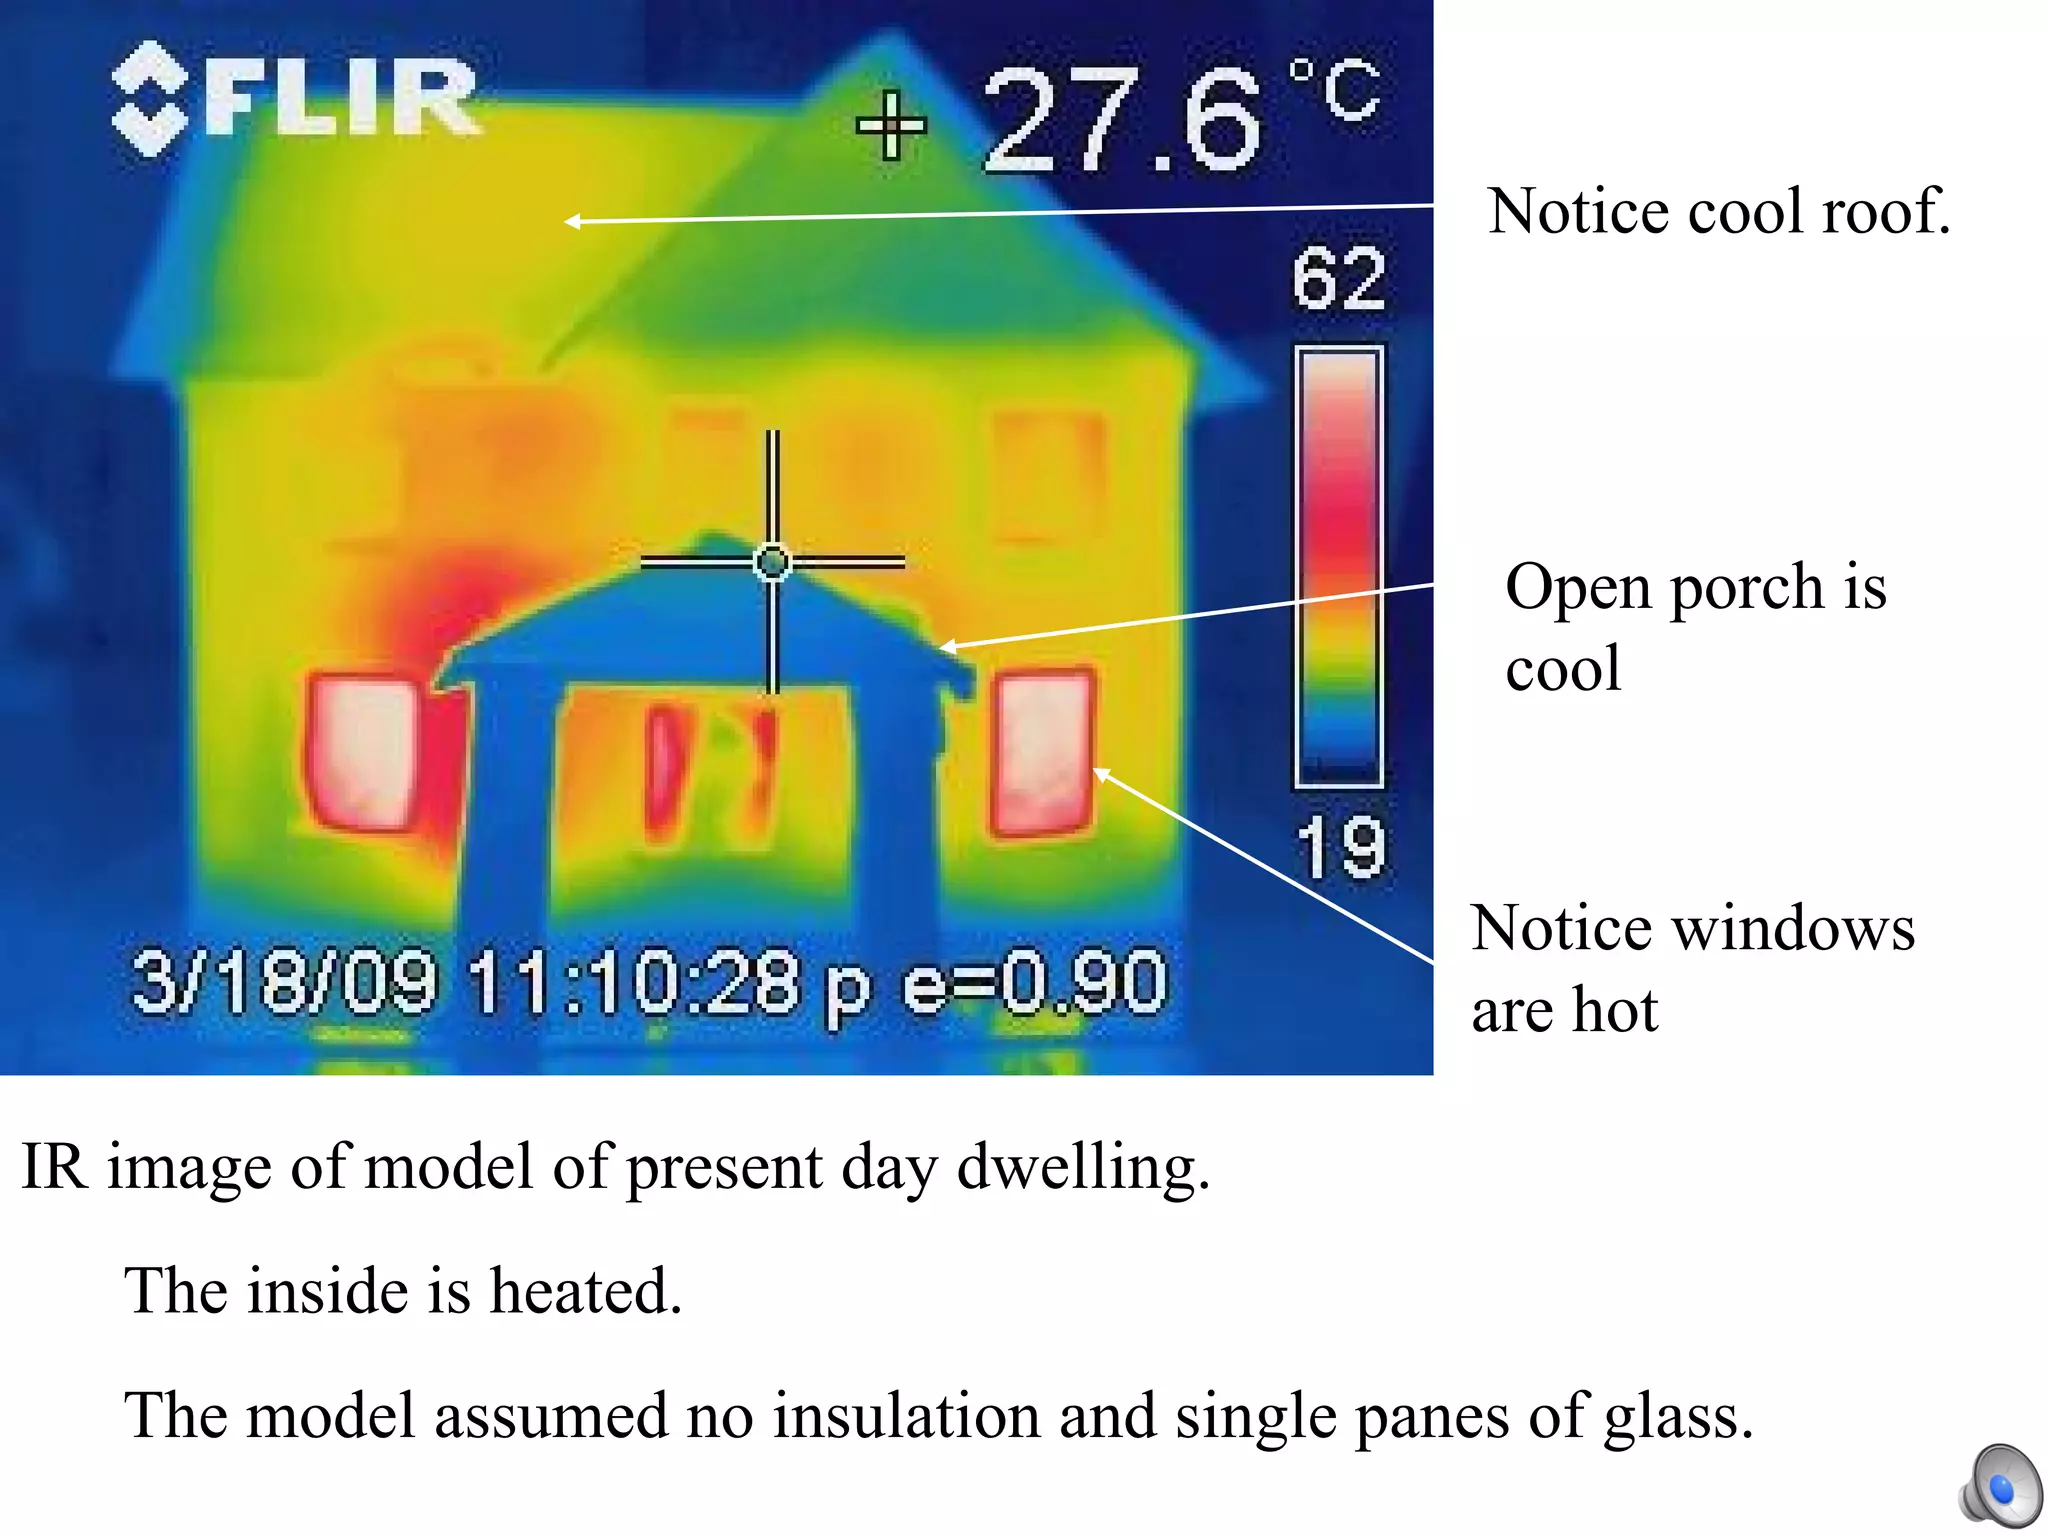
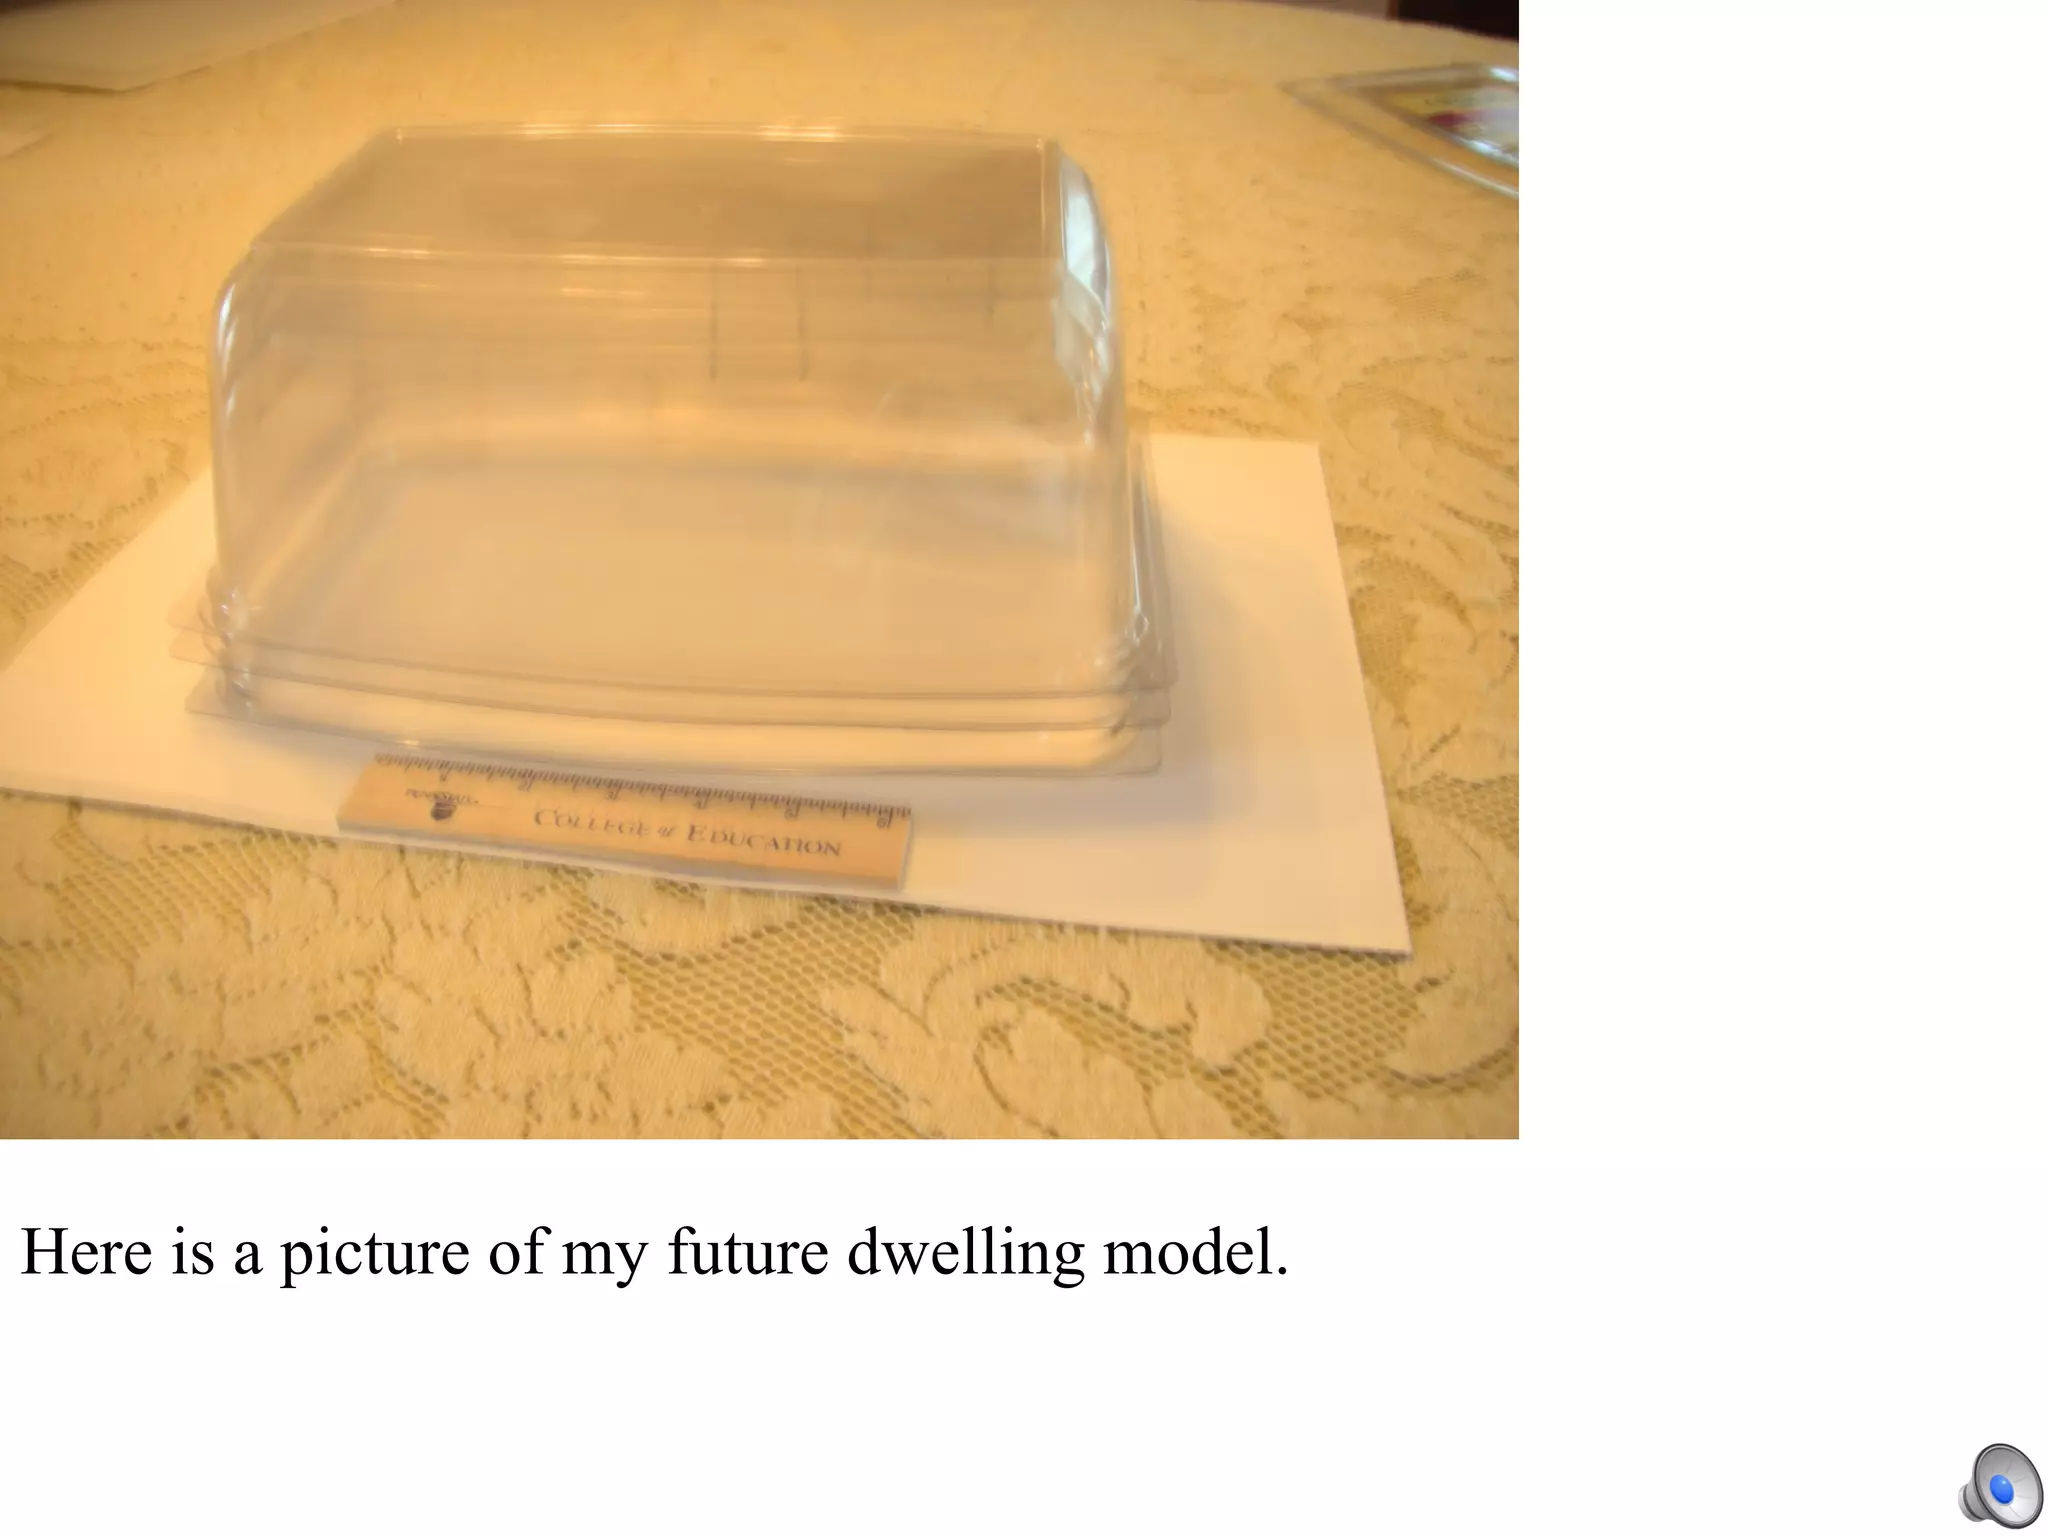
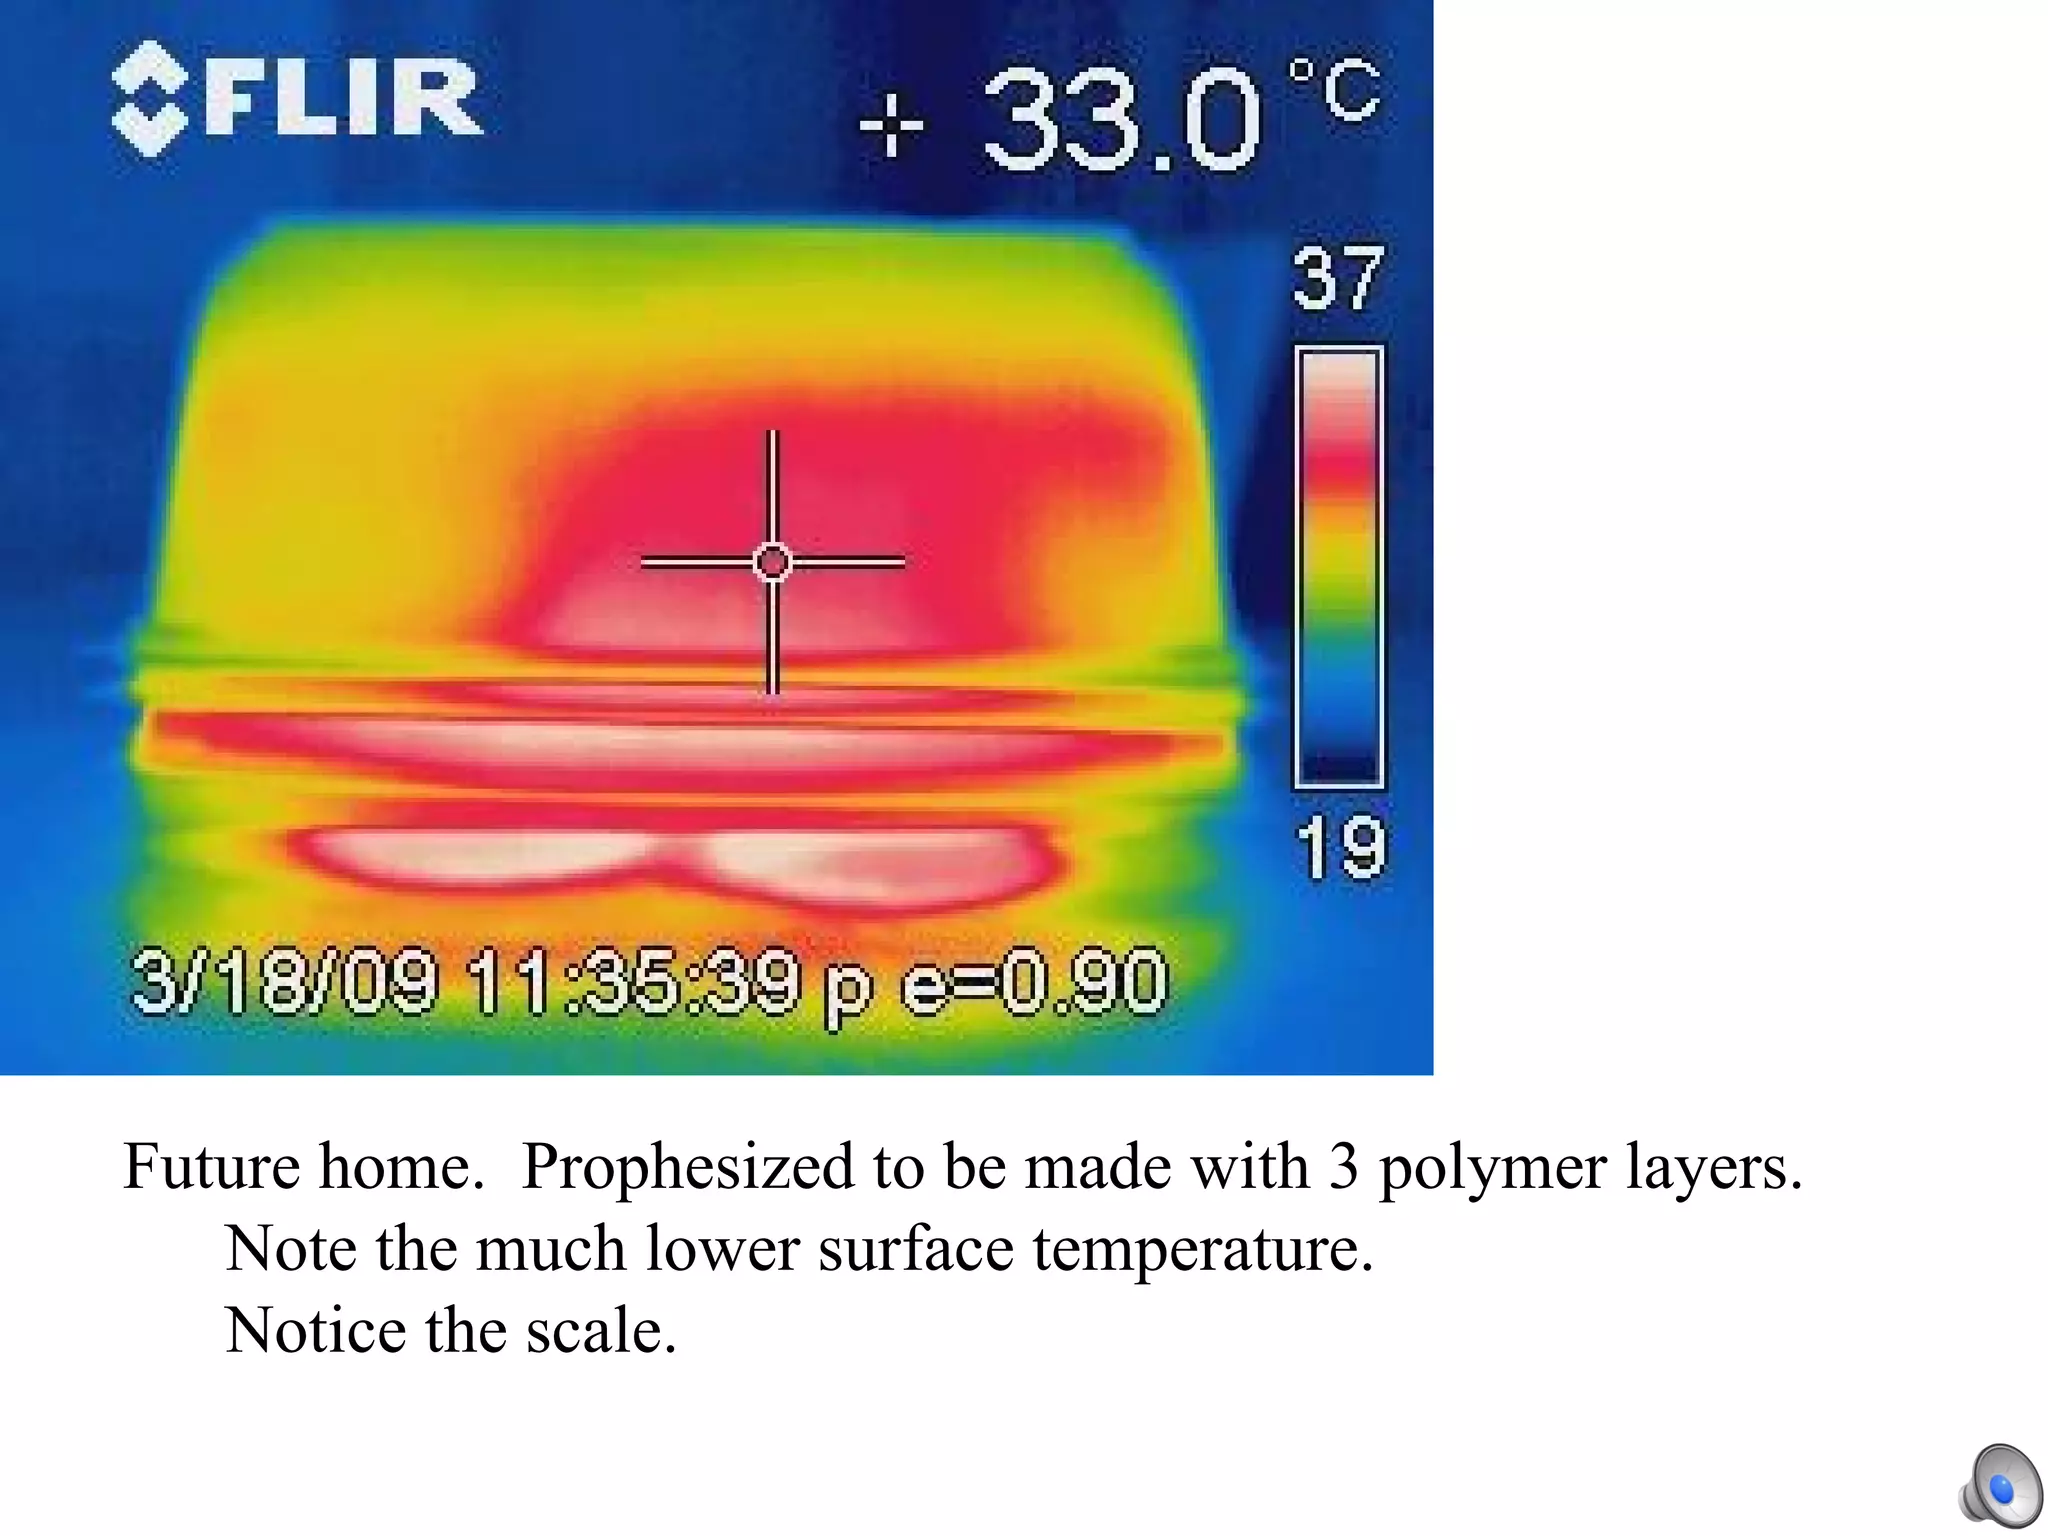
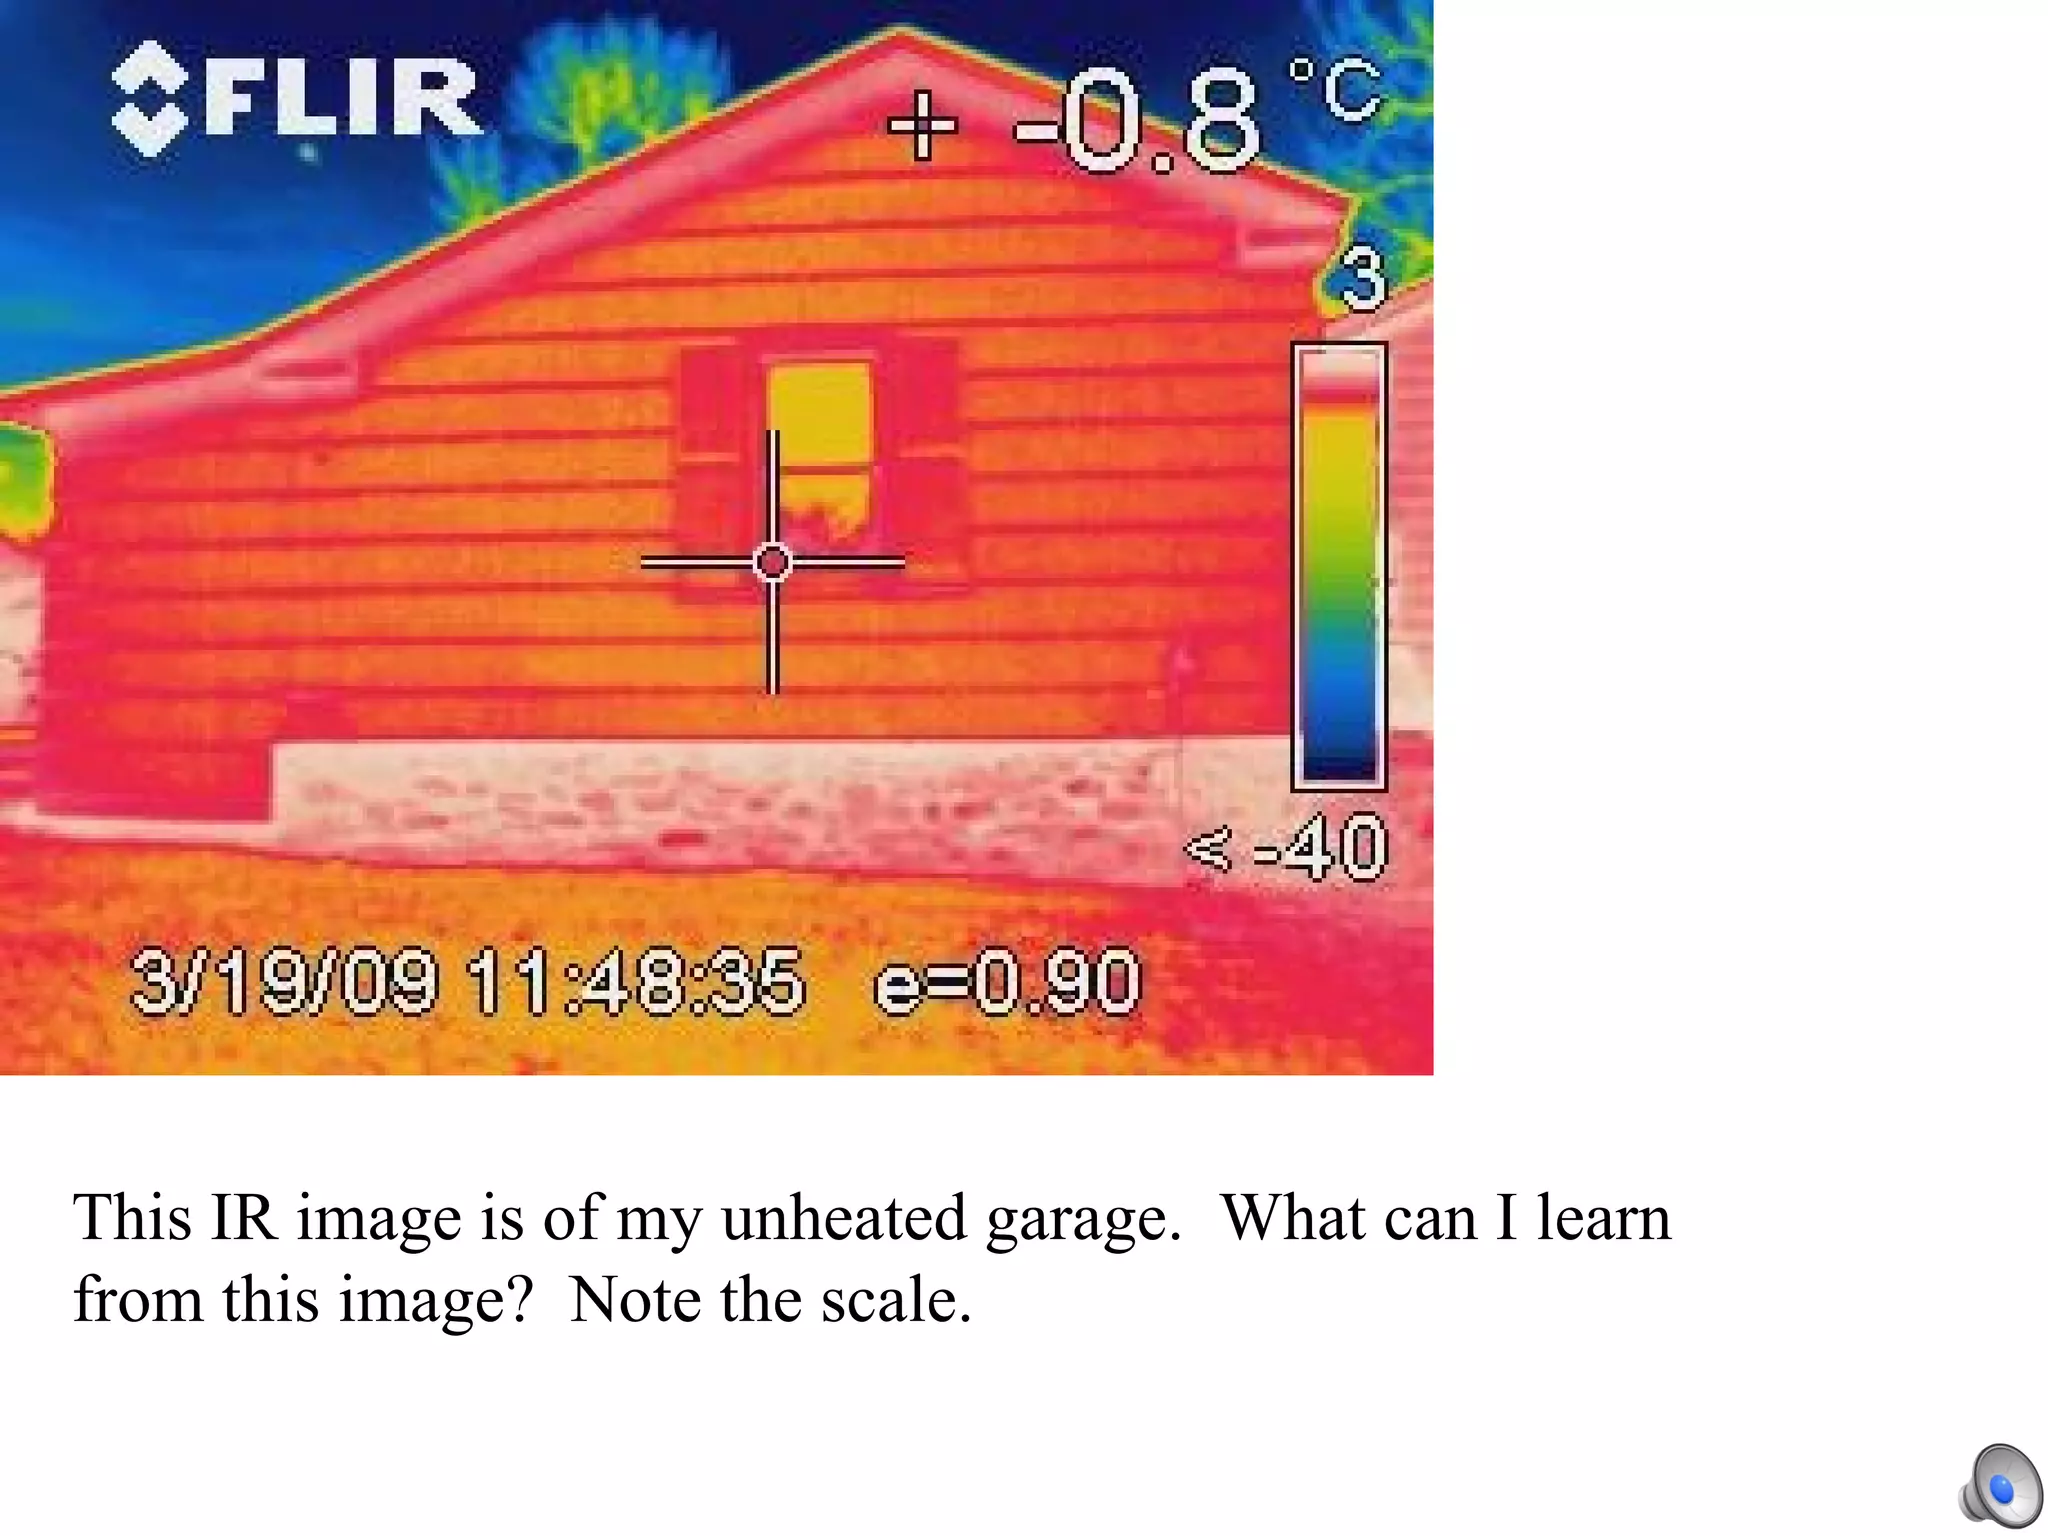
Physical Technology Project Learning objective: Understand energy losses in a dwelling. Overview: Compare the energy efficiency of dwellings Teams will select the dwelling construction technology Each team will be provided construction materials Each team will be provided thermometers and an IR camera Each team will need to make heat flow and scaling calculations
Modified digital camera provides IR images http://geektechnique.org/index.php?id=254
 
 
Here is a picture of my Long House model.  Note the 6inch scale.
Three openings to allow smoke to escape from indoor fire. Open door. Simulated bark Here is an IR image of a model of an Iroquois Longhouse
Here are some sample conductivities and scaling values used for my present day dwelling model. Note I assumed no insulation.
Here is a picture of my model of my present day dwelling.  Note the 6inch scale.
IR image of model of present day dwelling.  The inside is heated.  The model assumed no insulation and single panes of glass. Open porch is cool Notice cool roof. Notice windows are hot
Here is a picture of my future dwelling model.
Future home.  Prophesized to be made with 3 polymer layers.  Note the much lower surface temperature.  Notice the scale.
For extra credit   For my example I have used an IR image from National Geographic The caption for the image reads: “Thermographic photography offers clues to where energy is being wasted in this older house in Connecticut.  Red and yellow patches indicate escaping heat,  while new double pane windows appear cool blue.  By sealing in warmth , the windows cut heating costs, which can account for up to half a family’s energy bill.”
Why is the roof hotter than the windows?  Also, why is the roof of the open porch hot?
Dear National Geographic, I would like to suggest that the Geographic misinterpreted the IR image of a home in Connecticut; Page 61 March 2009.  The caption under  “It starts at home” states that new double pane windows show low heat loss while red and yellow shows high heat loss. The roof is red, but so is the roof of the open porch. How can this be?   Most modern windows have R-values in the R1-R3 range.  Most older homes have ceiling insulation in the R5 - R20 range.  Even if there was no insulation in the ceiling the sheet rock, wood and shingled roof would have an R-value about the same range as the windows and therefore about the same heat loss.    The IR camera shows the temperature of the surface of the house.  Heat loss is inferred.   I suggest that the IR picture was taken when the sun was over the left of the house, about the 11 o’clock position.  The red is the sun heating the roof, presumably on a cold day. Residual heat could explain the higher temperature if the picture was taken at night.  Note that the porch roof shows up red indicating it has a higher temperature. But there is no heat inside the open porch.  The open porch could only have a high roof temperature if the sun were heating it.    The message remains the same however.  We need efficient homes, cars and appliances so I completely support the message the National Geographic presents.   Thank you for the wonderful article. Mark Jacobs  BSME, MS
Although I did not get a direct response from National Geographic, I did find a blog, IRtalk.com.  The high roof temperature was probably due to the sun. https://www.irtalk.com/forums/thread/2764.aspx
Here is an IR image of my model without any heat.  Why can I see the house at all?
IR image of model with no internal heat but with a desk lamp over at the 11o’clock position.  Does it look like the National Geographic picture?
This IR image has both internal heat and a desk lamp at the 11 o’clock position.  Does it look like the NG image?
Here is a just for fun IR image with my hand in front of the model.
Here is an IR image of my home.  What should I do to improve the energy efficiency of my home?
This IR image is of my unheated garage.  What can I learn from this image?  Note the scale.

Physical Technology Presentation

  • 1.
    Physical Technology ProjectLearning objective: Understand energy losses in a dwelling. Overview: Compare the energy efficiency of dwellings Teams will select the dwelling construction technology Each team will be provided construction materials Each team will be provided thermometers and an IR camera Each team will need to make heat flow and scaling calculations
  • 2.
    Modified digital cameraprovides IR images http://geektechnique.org/index.php?id=254
  • 3.
  • 4.
  • 5.
    Here is apicture of my Long House model. Note the 6inch scale.
  • 6.
    Three openings toallow smoke to escape from indoor fire. Open door. Simulated bark Here is an IR image of a model of an Iroquois Longhouse
  • 7.
    Here are somesample conductivities and scaling values used for my present day dwelling model. Note I assumed no insulation.
  • 8.
    Here is apicture of my model of my present day dwelling. Note the 6inch scale.
  • 9.
    IR image ofmodel of present day dwelling. The inside is heated. The model assumed no insulation and single panes of glass. Open porch is cool Notice cool roof. Notice windows are hot
  • 10.
    Here is apicture of my future dwelling model.
  • 11.
    Future home. Prophesized to be made with 3 polymer layers. Note the much lower surface temperature. Notice the scale.
  • 12.
    For extra credit For my example I have used an IR image from National Geographic The caption for the image reads: “Thermographic photography offers clues to where energy is being wasted in this older house in Connecticut. Red and yellow patches indicate escaping heat, while new double pane windows appear cool blue. By sealing in warmth , the windows cut heating costs, which can account for up to half a family’s energy bill.”
  • 13.
    Why is theroof hotter than the windows? Also, why is the roof of the open porch hot?
  • 14.
    Dear National Geographic,I would like to suggest that the Geographic misinterpreted the IR image of a home in Connecticut; Page 61 March 2009. The caption under “It starts at home” states that new double pane windows show low heat loss while red and yellow shows high heat loss. The roof is red, but so is the roof of the open porch. How can this be?   Most modern windows have R-values in the R1-R3 range. Most older homes have ceiling insulation in the R5 - R20 range. Even if there was no insulation in the ceiling the sheet rock, wood and shingled roof would have an R-value about the same range as the windows and therefore about the same heat loss.   The IR camera shows the temperature of the surface of the house. Heat loss is inferred.   I suggest that the IR picture was taken when the sun was over the left of the house, about the 11 o’clock position. The red is the sun heating the roof, presumably on a cold day. Residual heat could explain the higher temperature if the picture was taken at night. Note that the porch roof shows up red indicating it has a higher temperature. But there is no heat inside the open porch. The open porch could only have a high roof temperature if the sun were heating it.   The message remains the same however. We need efficient homes, cars and appliances so I completely support the message the National Geographic presents.   Thank you for the wonderful article. Mark Jacobs BSME, MS
  • 15.
    Although I didnot get a direct response from National Geographic, I did find a blog, IRtalk.com. The high roof temperature was probably due to the sun. https://www.irtalk.com/forums/thread/2764.aspx
  • 16.
    Here is anIR image of my model without any heat. Why can I see the house at all?
  • 17.
    IR image ofmodel with no internal heat but with a desk lamp over at the 11o’clock position. Does it look like the National Geographic picture?
  • 18.
    This IR imagehas both internal heat and a desk lamp at the 11 o’clock position. Does it look like the NG image?
  • 19.
    Here is ajust for fun IR image with my hand in front of the model.
  • 20.
    Here is anIR image of my home. What should I do to improve the energy efficiency of my home?
  • 21.
    This IR imageis of my unheated garage. What can I learn from this image? Note the scale.