1) The document describes using a Monte Carlo simulation method to calculate the critical mass of fissionable materials like Uranium-235. It examines how critical mass depends on factors like sample purity, shape, mean free path of neutrons, and average neutrons released per fission.
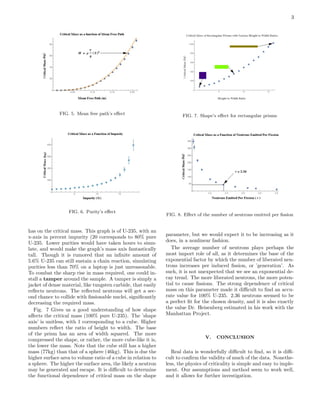
2) The simulation works by randomly simulating the path and interactions of neutrons released during fissions to calculate the ratio of induced to spontaneous fissions. It finds the mass where this ratio exceeds 1, indicating a self-sustaining reaction.
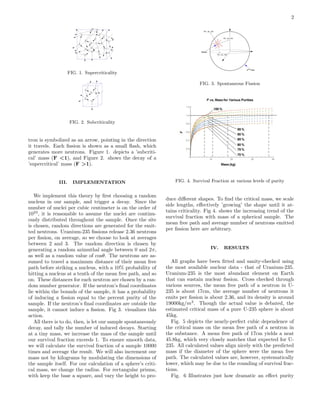
3) Results show spherical samples have the lowest critical mass. Critical mass increases exponentially with decreasing purity and average neutrons released per fission, and depends on mean free path and

![4
VI. REFERENCES
[1] R. Roberts, R. Meyer, L. Hafstad, P. Wang, Further
Observations on the Splitting of Uranium and Thorium,
Phys. Rev. 55 (1939) 510.
[2] Bernstein, J. Hitlers Uranium Club: The Secret Recordings
at Farm Hall ; Copernicus Books, New York (2001)
[3] Reed, B.C. The Physics of the Manhattan Project ;
Springer (2011)
[4] Ehrlich, Robert, Simulation of a Chain Reaction ; MISN-
0-356 (2002)](https://image.slidesharecdn.com/b012144a-8eb5-420f-8236-a754687fb724-150824012346-lva1-app6891/85/PHY-492-Final-Paper-4-320.jpg)


