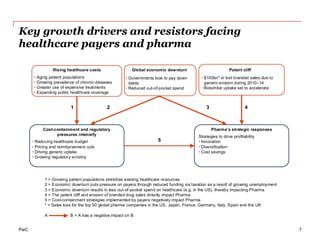
7. PwC
Key growth drivers and resistors facing
healthcare payers and pharma
7
1 = Growing patient populations stretches existing healthcare resources
2 = Economic downturn puts pressure on payers through reduced funding via taxation as a result of growing unemployment
3 = Economic downturn results in less out-of-pocket spend on healthcare (e.g. in the US), thereby impacting Pharma
4 = The patent cliff and erosion of branded drug sales directly impact Pharma
5 = Cost-containment strategies implemented by payers negatively impact Pharma
* = Sales loss for the top 50 global pharma companies in the US, Japan, France, Germany, Italy, Spain and the UK
A B = A has a negative impact on B
Global economic downturn Patent cliff
1 2 3 4
5
• Aging patient populations
• Growing prevalence of chronic diseases
• Greater use of expensive treatments
• Expanding public healthcare coverage
Rising healthcare costs
Cost-containment and regulatory
pressures intensify
• Reducing healthcare budget
• Pricing and reimbursement cuts
• Driving generic uptake
• Growing regulatory scrutiny
• Governments look to pay down
debts
• Reduced out-of-pocket spend
• $100bn* in lost branded sales due to
generic erosion during 2010–14
• Biosimilar uptake set to accelerate
Pharma’s strategic responses
Strategies to drive profitability
• Innovation
• Diversification
• Cost savings
9. PwC
The avalanche of new biomedicine knowledge at
the origin of the growth of healthcare expenditure
9
Pharmaceutical
&
biotechnology
manufacturers
Medical device
makers
Medical
suppliers
Information
technology
firms
Governments
Employers
Individuals
Insurers
HMO’s
Pharmacy
Benefit
Management
Hospitals
Physicians
Integrated
delivery
networks
Pharmacies
Wholesalers
Mail order
distributors
Group
purchasing
organizations
Purchasers
Fiscal
intermediaries
Providers
Product
intermediaries
Producers
Innovation
Money
Fuente: Lawton R. Burns. “The Health Care Value Chain”. San Francisco. Jossey-Bass. 2002.Fuente: Lawton R. Burns. “The Health Care Value Chain”. San Francisco. Jossey-Bass. 2002.
10. PwC
Traditional pharmaceutical industry survives
thanks to the introduction of new molecules in the
sector
10
Fuente: Lawton R. Burns. “The Health Care Value Chain”. San Francisco. Jossey-Bass. 2002.
The higher added value of the pharmaceutical industry is generated
in pre-clinical and clinical research, particularly in the first, segment
of the value chain that originates the intellectual property of the new
molecules
Pharmaceutical industry value chain
MarketingDistributionProduction
Clinic
Research
Pre-clinic
research
R&D activities
Sophistication of necessary skills
12. PwC
Pharma is increasing recognition of its
interdependence with payers and providers…
12
Fuente: Lawton R. Burns. “The Health Care Value Chain”. San Francisco. Jossey-Bass. 2002.
Provider
Payer
Pharmaceutical
13. PwC
Global Pharma is growing
13
Fuente: Lawton R. Burns. “The Health Care Value Chain”. San Francisco. Jossey-Bass. 2002.
Breakdown of global market 2005
Other G7
30%
E7
8%
RoW
20%
US
42%
Breakdown of global market 2020*
Global
$520bn
Other G7
23%
E7
18%
RoW
20%
US
39%Global
$1.3trn
• By 2020 ~20% global
sales from E7
countries
• E7 nations: Brazil,
China, India,
Indonesia, Mexico,
Russia and Turkey
• Assumes G7 grow at
mid-singledigits,E7
grow low- to mid-
double digits
14. PwC
Pharma’s Investment Model
14
R&D 12 Years Marketing & Sales 7 Years
$
R&D
Productivity
Extend
Patent Life
Marketing
& Sales
$1.0 Billion
Costs
15. PwC
More people are living longer with chronic
diseases which were previously fatal
15
Fuente: Lawton R. Burns. “The Health Care Value Chain”. San Francisco. Jossey-Bass. 2002.
0
2
4
6
8
10
12
50-64 65-69 70-74 75-79 80+
US
Canada
UK
Australia
Japan
Germany
Sweden
Spain
Age Group
Healthcarecostrelativeto
50-64agegroup
Sources: Laurence Kotlikoff and Christian Hagist, “Who’s Going Broke?” National Bureau of Economic Research, Working Paper
No. 11833, December 2005, p.25; World Factbook, 2006; OECD Health Data 2006; IMS Sales Data 2005.
17. PwC
Pharma has to develop medicines the market
wants to buy
17
Fuente: Lawton R. Burns. “The Health Care Value Chain”. San Francisco. Jossey-Bass. 2002.
0
5
10
15
20
25
30
35
40
45
50
1996 1997 1998 1999 2000 2001 2002 2003 2004 2005 2006 2007*
R&Dspend($bn)
0
10
20
30
40
50
60
NMEsandBiologicsapproved
PhRMA member
R&D spend ($bn)
NME and New
Biologics Approved
by FDA
NME:
New Molecular Entity.
Excludes vaccines, antigens
and combination therapies
which do not include at least
one new constituents
* PwC estimate
R&D productivity continues to decline
Over last decade:
• PhRMA member R&D investment almost tripled, reaching an estimated $46bn in 2007
• FDA approved medicines declined by two thirds - 56 in 1996, 19 in 2007
18. PwC
Yet the industry is unable to develop affordable
innovative treatment to meet these future
demands
18
Fuente: Lawton R. Burns. “The Health Care Value Chain”. San Francisco. Jossey-Bass. 2002.
• R&D investment doubled since 1996, to >$55bn p.a. and expected to
reach $160bn in 2020 at current growth rates
• FDA approved medicines declined by 60% - 53 in 1996, 22 in 2006
WHY?
• Phase III trials typically cost between $135m and $270m
• 20-40% of R&D spend on line extensions
• Over 40-45% of all drugs fail in phase III
21. PwC
Main long term trends
21
Fuente: Lawton R. Burns. “The Health Care Value Chain”. San Francisco. Jossey-Bass. 2002.
Main
long
term
trends
From
blockbuster
to niche
medicines
Changes in
the way of
launching
Regulatory
changes
Changes in
marketing
From
chemistry to
biotechnology
Changes in
the way of
pricing
New
Technologies
Threats and
Opportunities
22. PwC
Pharma shifting to Specialty Products
22
Fuente: Lawton R. Burns. “The Health Care Value Chain”. San Francisco. Jossey-Bass. 2002.
• 25% US Market is specialty products
• 19% EU market is specialty products
• > 60% of Pharma’s pipeline is specialty products
• $10,000 - $600,000 + cost/patient
• Imperative specialty products can command premium price
23. PwC
Which will polarise the industry
23
Fuente: Lawton R. Burns. “The Health Care Value Chain”. San Francisco. Jossey-Bass. 2002.
‘Mass market’
Low cost
Branded generic /over
the counter
treatment
Management
High volume
Protocol driven
Poly pharmacy & bundles
Direct to Consumer
communications
Speciality / Niche
High cost
Disease modifying
Cure
Price
Physician driven
Risk sharing
Specialist targeted
Packages of Care
24. PwC
Marketing strategies tailored for product type
24
Fuente: Lawton R. Burns. “The Health Care Value Chain”. San Francisco. Jossey-Bass. 2002.
Mass-market
medicines
Specialist therapies Marketing implications
Treat common illnesses
Treat rare diseases and
specific disease subtypes
Smaller target market
Generally used with a diagnostic
Relatively simple products Complex products More educated reps & No Samples
Typically prescribed by
general practitioners
Prescribed by specialists Much smaller sales force
Low price per dose
Very high price per
treatment
Extensive proof of clinical efficacy
Outcomes-based pricing
Usually oral formulations
Usually delivered by
infusion or injection
Intensive education & monitoring
Easy to manufacture Difficult to manufacture Less vulnerable to generic competition
Easy to transport Usually require cold chain More expensive to ship & store
Generally kept in stock Often delivered to order More flexible supply chain essential
25. PwC
Linear phase R&D process will progress to in-
life testing and live licensing by 2020
25
Fuente: Lawton R. Burns. “The Health Care Value Chain”. San Francisco. Jossey-Bass. 2002.
Today – Intensive all-or-nothing regulation
Developing
leads
Discovery
&
screening
Pre-clinical
evaluation
Phase I Phase II Phase III
Submission
MAA / NDA
Phase
IIIb / IV
Scientific
advice /
pre-IND
Submission
of CTA / IND
CIM CIS Launch
2020 – Collaborative, evolving, automated regulation
CIM
Discussion
and agreed
plan
of action with
Regulators
Limited launch
with Living
Licence
Instant
automated
approvals
Development loop for
extended indications
and regulatory
activities
Patho
Physiology
Molecule
Development
In-life
licensing
trials
Automated
submission/
approvals
CIS
CIM = Confidence in mechanism
CIS = Confidence in safety
IND = Investigative New Drug
CTA = Clinical Trial Application
MAA = Marketing Authorisation
Application
26. PwC
Linear phase R&D process will progress to
in-life testing and live licensing by 2020
26
Fuente: Lawton R. Burns. “The Health Care Value Chain”. San Francisco. Jossey-Bass. 2002.
Today – Intensive all-or-nothing regulation
Developing
leads
Discovery
&
screening
Pre-clinical
evaluation
Phase I Phase II Phase III
Submission
MAA / NDA
Phase
IIIb / IV
Scientific
advice /
pre-IND
Submission
of CTA / IND
CIM CIS Launch
2020 – Collaborative, evolving, automated regulation
CIM
Discussion
and agreed
plan
of action with
Regulators
Limited launch
with Living
Licence
Instant
automated
approvals
Development loop for
extended indications
and regulatory
activities
Patho
Physiology
Molecule
Development
In-life
licensing
trials
Automated
submission/
approvals
CIS
CIM = Confidence in mechanism
CIS = Confidence in safety
IND = Investigative New Drug
CTA = Clinical Trial Application
MAA = Marketing Authorisation
Application
We predict
all medicines will be launched with
live licences
27. PwC
Impact of Regulatory Harmony and Live
Licenses
27
Fuente: Lawton R. Burns. “The Health Care Value Chain”. San Francisco. Jossey-Bass. 2002.
$
One Big
Bang
Launch
Multiple
Smaller
Launches
28. PwC
Greater international regulatory co-operation
28
Fuente: Lawton R. Burns. “The Health Care Value Chain”. San Francisco. Jossey-Bass. 2002.
Access
Regulators use risk
benefit analyses not
average outcomes.
Complexity will
increase
Value for Money
Payers / providers use
Cost-effectiveness /
HTA assessments for all
regulatory reviews plus
safety and efficacy
Transparency
Public will demand independent
verification of all clinical data
Single global
regulator?
Resources
Regulators lack manpower
for expanded range of
studies.
Greater need / use of
specialist panels or “notified
bodies” ~ medical devices
Qualified auditors
Lifecycle regulation
Life time monitoring of all
treatments (Live License)
29. PwC
Customers are more complex and ever
changing…
29
Fuente: Lawton R. Burns. “The Health Care Value Chain”. San Francisco. Jossey-Bass. 2002.
TOMORROW
Key Account Managers
TODAY
Sales Representatives
Secondary Care Practices
• Management Board
• Professional Executive
Committee
• Prescribing Advisor
Primary Care Practices
• Practice Manager
• GPs
• Practice Nurses
Secondary Care Practices
• Management Board
• Professional Executive
Committee
• Prescribing Advisor
Primary Care Practices
• Practice Manager
• Family Practitioners
• Practice Nurses
Retail Pharmacies
Government / Payers
30. PwC
Customers are more complex and ever
changing…
30
TOMORROW
Key Account Managers
Government / Payers
Secondary Care Practices
• Management Board
• Professional Executive
Committee
• Prescribing Advisor
Primary Care Practices
• Practice Manager
• GPs
• Practice Nurses
Retail Pharmacies
32. PwC
Expediting Development
32
and shift their agenda from treatment to prevention and
cure of disease
Nanotherapeutics
• Delivery of Therapeutic agents or repair to specific cells or
organs in the human body
Regenerative Medicine
• Replacement or regeneration of human cells to restore
normal function and potentially reverse the course of a
disease
Gene Therapy
• Introduction of modified DNA into a human cell with the
intent to produce a functional protein and improve the
effective treatment of some diseases and potentially
provide cures for others
33. PwC
Flexible Pricing
33
Fuente: Lawton R. Burns. “The Health Care Value Chain”. San Francisco. Jossey-Bass. 2002.
• Capitated
• Pay for Performance
• Discounts & Rebates
• Others
34. PwC
New Technologies Threats and Opportunities
34
Fuente: Lawton R. Burns. “The Health Care Value Chain”. San Francisco. Jossey-Bass. 2002.
Disruptive Healthcare Technology
Proactive Pharmacovigilance
(Sentinel, SAEC, AMGA)
ePrescribing and Interventions
Medvantx Generic Sample Distribution
Automated Prescription Delivery System
Electronic Medical Records (EMR)
Genomics: Diagnostics and Personal
(23&Me, deCodeGenetics)
Health 2.0
(Healia, Patientslikeme, MEDgle)
Outcomes Exchanges & Consortiums
(NCCN Oncology, AMGA)
36. PwC
To succeed in the ‘2021’ era choose your business
model carefully…
36
What is pharmaceutical innovation?
More than just products…
Who determines what is innovative?
More than just Clinicians…
Commoditised
Pharma
Innovative
Pharma
Divergent industry
Premium PriceVolume not price
38. PwC
Innovation spans the value chain
38
Fuente: Lawton R. Burns. “The Health Care Value Chain”. San Francisco. Jossey-Bass. 2002.
Cures a disease or condition
Prevents a disease or condition
Decreases mortality
Decreases morbidity
Decreases cost of care
Increases QALY’s
Increases safety
Increases ease of use
Increases persistency or compliance
Will command a
premium price
Product or /
service which…
Etc…
39. PwC
However the development of medicines alone will
not be sufficient
39
Fuente: Lawton R. Burns. “The Health Care Value Chain”. San Francisco. Jossey-Bass. 2002.
• Problems stem from three invalid assumptions
• Movement into healthcare management – health screening,
compliance programmes, nutritional advice, exercise
programmes & facilities, etc
• Requirement for accompanying diagnostics
• A web of alliances will be needed to offer supporting services
• New sources of revenue generation
• Closer relationships with patients, payers & providers
• Build stronger brands and protect value of medicines
Value comes
in the form
of products
Pharma alone
determines
value
Technical data
is sufficient for
selling products
Good products alone will not
guarantee the industry’s long-term
future
40. PwC
Innovation is a team sport: All stakeholders must
be convinced the products and services are
innovative
40
Fuente: Lawton R. Burns. “The Health Care Value Chain”. San Francisco. Jossey-Bass. 2002.
An innovative product or
service needs all decision
makers to be convinced that
it is convenient for their
patients
Creating winning strategies requires a new more adaptive business
model across the value chain to orchestrate success for all stakeholders
42. PwC
What does it mean to be a partner?
1. Better understand the entire value chain
2. Further integrate in the value chain
3. Participate in the risk
42
noviembre 2010