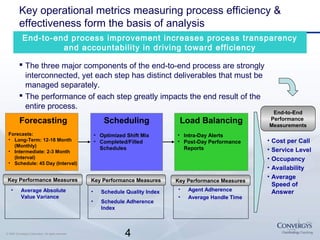
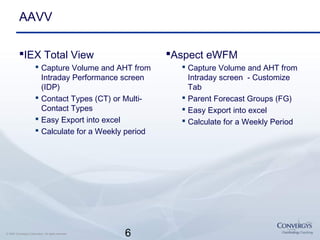
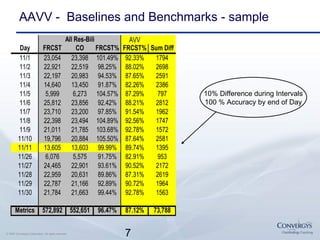
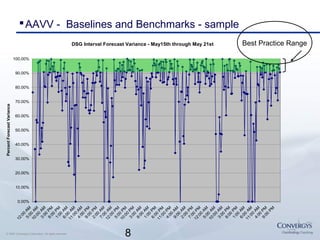
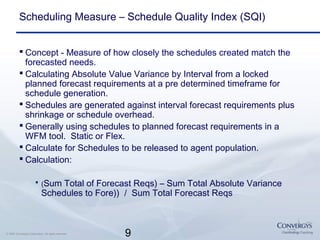
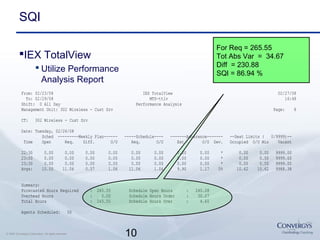
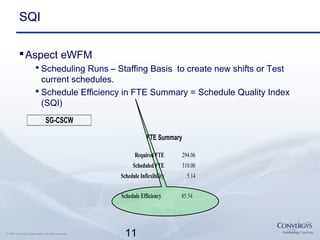
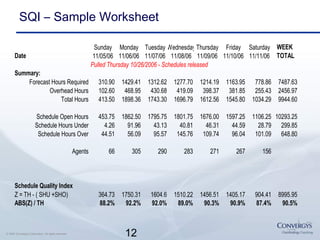
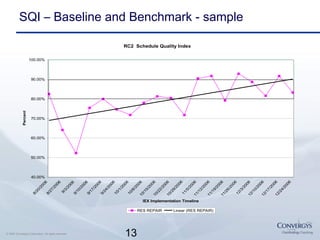
Performance
Measurements for
WFM Processes
Debra Phillips,
Convergys, Global Consulting
Services
March 27, 2008
2© 2007 Convergys Corporation. All rights reserved.
Speaker Bio
Debra Phillips
 Extensive experience in strategic and operational functions of
Workforce Management in the Contact Center environment,
covering scheduling, forecasting, budgeting, and intraday
management process design, implementation, and operations.
Design and operational experience with IEX TotalView, Aspect
eWFM, and Avaya Call Routing, in multi-contact type and multi-
skilled agent environments.
 Earliest experience with software - Manpower Planning System
(TCS) 1.13.x (1991) Attended First TCS Group Conference
 Email - debra.l.phillips@convergys.com
3© 2007 Convergys Corporation. All rights reserved.
Agenda
Key Performance Measures for Best Practices through
end to end process
Key Metric Definition for Forecasting, Scheduling
How to calculate Metrics
 IEX TotalView
 Aspect eWFM
 Manual Template
Sample Baselines and Benchmarks
Convergys Best Practice Findings
4© 2007 Convergys Corporation. All rights reserved.
 The three major components of the end-to-end process are strongly
interconnected, yet each step has distinct deliverables that must be
managed separately.
 The performance of each step greatly impacts the end result of the
entire process.
Scheduling
• Optimized Shift Mix
• Completed/Filled
Schedules
Load Balancing
• Intra-Day Alerts
• Post-Day Performance
Reports
Key Performance Measures
• Schedule Quality Index
• Schedule Adherence
Index
Key Performance Measures
• Average Absolute
Value Variance
Key Performance Measures
• Agent Adherence
• Average Handle Time
• Cost per Call
• Service Level
• Occupancy
• Availability
• Average
Speed of
Answer
End-to-End
Performance
Measurements
Forecasting
Forecasts:
• Long-Term: 12-18 Month
(Monthly)
• Intermediate: 2-3 Month
(Interval)
• Schedule: 45 Day (Interval)
End-to-end process improvement increases process transparency
and accountability in driving toward efficiency
Key operational metrics measuring process efficiency &
effectiveness form the basis of analysis
5© 2007 Convergys Corporation. All rights reserved.
Forecasting Measure – Average Absolute Value Variance
(AAVV)
Concept - Measure of how closely the staff requirements,
call volume, and AHT forecasts created match actuals.
Calculating Absolute Value Variance by Interval from a
locked forecast at a pre determined timeframe.
Schedules are generated against interval forecast
requirements.
Generally using a forecast in a WFM tool.
Calculate for Volume Offered and AHT
Calculation:
 (Sum Total of Forecast (Volume) – Sum Total Absolute Variance
(Volume)) / Sum Total Forecast Volume
6© 2007 Convergys Corporation. All rights reserved.
AAVV
IEX Total View
 Capture Volume and AHT from
Intraday Performance screen
(IDP)
 Contact Types (CT) or Multi-
Contact Types
 Easy Export into excel
 Calculate for a Weekly period
Aspect eWFM
 Capture Volume and AHT from
Intraday screen - Customize
Tab
 Parent Forecast Groups (FG)
 Easy Export into excel
 Calculate for a Weekly Period
7© 2007 Convergys Corporation. All rights reserved.
AAVV - Baselines and Benchmarks - sample
AVV
Day FRCST CO FRCST% FRCST% Sum Diff
11/1 23,054 23,398 101.49% 92.33% 1794
11/2 22,921 22,519 98.25% 88.02% 2698
11/3 22,197 20,983 94.53% 87.65% 2591
11/4 14,640 13,450 91.87% 82.26% 2386
11/5 5,999 6,273 104.57% 87.29% 797
11/6 25,812 23,856 92.42% 88.21% 2812
11/7 23,710 23,200 97.85% 91.54% 1962
11/8 22,398 23,494 104.89% 92.56% 1747
11/9 21,011 21,785 103.68% 92.78% 1572
11/10 19,796 20,884 105.50% 87.64% 2581
11/11 13,605 13,603 99.99% 89.74% 1395
11/26 6,076 5,575 91.75% 82.91% 953
11/27 24,465 22,901 93.61% 90.52% 2172
11/28 22,959 20,631 89.86% 87.31% 2619
11/29 22,787 21,166 92.89% 90.72% 1964
11/30 21,784 21,663 99.44% 92.78% 1563
Metrics 572,892 552,651 96.47% 87.12% 73,788
All Res-Bili
10% Difference during Intervals
100 % Accuracy by end of Day
8© 2007 Convergys Corporation. All rights reserved.
AAVV - Baselines and Benchmarks - sample
DSG Interval Forecast Variance - May15th through May 21st
0.00%
10.00%
20.00%
30.00%
40.00%
50.00%
60.00%
70.00%
80.00%
90.00%
100.00%
12:00
AM5:00
AM
10:00
AM3:00
PM8:00
PM1:00
AM6:00
AM
11:00
AM4:00
PM9:00
PM2:00
AM7:00
AM
12:00
PM5:00
PM
10:00
PM3:00
AM8:00
AM1:00
PM6:00
PM
11:00
PM4:00
AM9:00
AM2:00
PM7:00
PM
12:00
AM5:00
AM
10:00
AM3:00
PM8:00
PM1:00
AM6:00
AM
11:00
AM4:00
PM9:00
PM
PercentForecastVariance
Best Practice Range
9© 2007 Convergys Corporation. All rights reserved.
Scheduling Measure – Schedule Quality Index (SQI)
 Concept - Measure of how closely the schedules created match the
forecasted needs.
 Calculating Absolute Value Variance by Interval from a locked
planned forecast requirements at a pre determined timeframe for
schedule generation.
 Schedules are generated against interval forecast requirements plus
shrinkage or schedule overhead.
 Generally using schedules to planned forecast requirements in a
WFM tool. Static or Flex.
 Calculate for Schedules to be released to agent population.
 Calculation:
 (Sum Total of Forecast Reqs) – Sum Total Absolute Variance
Schedules to Fore)) / Sum Total Forecast Reqs
10© 2007 Convergys Corporation. All rights reserved.
SQI
IEX TotalView
 Utilize Performance
Analysis Report
From: 02/23/08 IEX TotalView 02/27/08
To: 02/29/08 MTS-ttlv 16:48
Shift: 0 All Day Performance Analysis
Management Unit: 302 Wireless - Cust Srv Page: 8
CT: 302 Wireless - Cust Srv
Date: Tuesday, 02/26/08
Sched ---------Weekly Plan------ -----Schedule---- -------Adherence------- --Seat Limits ( 0/9999)--
Time Open Req. Diff. O/U Req. O/U Est. O/U Dev. Occupied O/U Min Vacant
22:30 0.00 0.00 0.00 0.00 0.00 0.00 0.00 0.00 * 0.00 0.00 9999.00
23:00 0.00 0.00 0.00 0.00 0.00 0.00 0.00 0.00 * 0.00 0.00 9999.00
23:30 0.00 0.00 0.00 0.00 0.00 0.00 0.00 0.00 * 0.00 0.00 9999.00
Avgs: 10.00 11.06 0.57 1.06 11.06 1.06 9.90 1.17 5% 10.62 10.62 9988.38
Summary:
Forecasted Hours Required : 265.55 Schedule Open Hours : 240.08
Overhead Hours : 0.00 Schedule Hours Under : 30.07
Total Hours : 265.55 Schedule Hours Over : 4.60
Agents Scheduled: 50
For Req = 265.55
Tot Abs Var = 34.67
Diff = 230.88
SQI = 86.94 %
11© 2007 Convergys Corporation. All rights reserved.
SQI
Aspect eWFM
 Scheduling Runs – Staffing Basis to create new shifts or Test
current schedules.
 Schedule Efficiency in FTE Summary = Schedule Quality Index
(SQI)
Schedule Efficiency 85.54
Scheduled FTE 310.00
Schedule Inflexibility 5.14
SG-CSCW
FTE Summary
Required FTE 294.06
12© 2007 Convergys Corporation. All rights reserved.
SQI – Sample Worksheet
Sunday Monday Tuesday WednesdayThursday Friday Saturday WEEK
Date 11/05/06 11/06/06 11/07/06 11/08/06 11/09/06 11/10/06 11/11/06 TOTAL
Pulled Thursday 10/26/2006 - Schedules released
Summary:
Forecast Hours Required 310.90 1429.41 1312.62 1277.70 1214.19 1163.95 778.86 7487.63
Overhead Hours 102.60 468.95 430.68 419.09 398.37 381.85 255.43 2456.97
Total Hours 413.50 1898.36 1743.30 1696.79 1612.56 1545.80 1034.29 9944.60
Schedule Open Hours 453.75 1862.50 1795.75 1801.75 1676.00 1597.25 1106.25 10293.25
Schedule Hours Under 4.26 91.96 43.13 40.81 46.31 44.59 28.79 299.85
Schedule Hours Over 44.51 56.09 95.57 145.76 109.74 96.04 101.09 648.80
Agents 66 305 290 283 271 267 156
Schedule Quality Index
Z = TH - ( SHU +SHO) 364.73 1750.31 1604.6 1510.22 1456.51 1405.17 904.41 8995.95
ABS(Z) / TH 88.2% 92.2% 92.0% 89.0% 90.3% 90.9% 87.4% 90.5%
13© 2007 Convergys Corporation. All rights reserved.
SQI – Baseline and Benchmark - sample
RC2 Schedule Quality Index
40.00%
50.00%
60.00%
70.00%
80.00%
90.00%
100.00%
8/20/2006
8/27/2006
9/3/2006
9/10/2006
9/17/2006
9/24/2006
10/1/2006
10/8/200610/15/200610/22/200610/29/2006
11/5/200611/12/200611/19/200611/26/2006
12/3/200612/10/200612/17/200612/24/2006
IEX Implementation Timeline
Percent
RES REPAIR Linear (RES REPAIR)
14© 2007 Convergys Corporation. All rights reserved.
Best Practice Findings - notes
 SQI can be used as a qualitative evaluation of schedule mixes with
shift types and work rules.
 SQI must include Shrinkage/Schedule Overhead
 Be Flexible with Tool settings to achieve desired results.
 Don’t get hung up on numbers. Baseline yours and establish
continuous feedback loop for improvement.
 SQI – Best Practice - 95 %
 AVV – Best Practice - 90-95%
 Other Measures
 Staffing Adherence Index (SAI) -
Measure of how closely agents were staffed into the assigned schedules.
 Aggregate Schedule Adherence -
Measure of how closely agents/centers followed the plan net staff plan.

Performance Measurements for WFM Processes - Convergys

  • 1.
    Performance Measurements for WFM Processes DebraPhillips, Convergys, Global Consulting Services March 27, 2008
  • 2.
    2© 2007 ConvergysCorporation. All rights reserved. Speaker Bio Debra Phillips  Extensive experience in strategic and operational functions of Workforce Management in the Contact Center environment, covering scheduling, forecasting, budgeting, and intraday management process design, implementation, and operations. Design and operational experience with IEX TotalView, Aspect eWFM, and Avaya Call Routing, in multi-contact type and multi- skilled agent environments.  Earliest experience with software - Manpower Planning System (TCS) 1.13.x (1991) Attended First TCS Group Conference  Email - debra.l.phillips@convergys.com
  • 3.
    3© 2007 ConvergysCorporation. All rights reserved. Agenda Key Performance Measures for Best Practices through end to end process Key Metric Definition for Forecasting, Scheduling How to calculate Metrics  IEX TotalView  Aspect eWFM  Manual Template Sample Baselines and Benchmarks Convergys Best Practice Findings
  • 4.
    4© 2007 ConvergysCorporation. All rights reserved.  The three major components of the end-to-end process are strongly interconnected, yet each step has distinct deliverables that must be managed separately.  The performance of each step greatly impacts the end result of the entire process. Scheduling • Optimized Shift Mix • Completed/Filled Schedules Load Balancing • Intra-Day Alerts • Post-Day Performance Reports Key Performance Measures • Schedule Quality Index • Schedule Adherence Index Key Performance Measures • Average Absolute Value Variance Key Performance Measures • Agent Adherence • Average Handle Time • Cost per Call • Service Level • Occupancy • Availability • Average Speed of Answer End-to-End Performance Measurements Forecasting Forecasts: • Long-Term: 12-18 Month (Monthly) • Intermediate: 2-3 Month (Interval) • Schedule: 45 Day (Interval) End-to-end process improvement increases process transparency and accountability in driving toward efficiency Key operational metrics measuring process efficiency & effectiveness form the basis of analysis
  • 5.
    5© 2007 ConvergysCorporation. All rights reserved. Forecasting Measure – Average Absolute Value Variance (AAVV) Concept - Measure of how closely the staff requirements, call volume, and AHT forecasts created match actuals. Calculating Absolute Value Variance by Interval from a locked forecast at a pre determined timeframe. Schedules are generated against interval forecast requirements. Generally using a forecast in a WFM tool. Calculate for Volume Offered and AHT Calculation:  (Sum Total of Forecast (Volume) – Sum Total Absolute Variance (Volume)) / Sum Total Forecast Volume
  • 6.
    6© 2007 ConvergysCorporation. All rights reserved. AAVV IEX Total View  Capture Volume and AHT from Intraday Performance screen (IDP)  Contact Types (CT) or Multi- Contact Types  Easy Export into excel  Calculate for a Weekly period Aspect eWFM  Capture Volume and AHT from Intraday screen - Customize Tab  Parent Forecast Groups (FG)  Easy Export into excel  Calculate for a Weekly Period
  • 7.
    7© 2007 ConvergysCorporation. All rights reserved. AAVV - Baselines and Benchmarks - sample AVV Day FRCST CO FRCST% FRCST% Sum Diff 11/1 23,054 23,398 101.49% 92.33% 1794 11/2 22,921 22,519 98.25% 88.02% 2698 11/3 22,197 20,983 94.53% 87.65% 2591 11/4 14,640 13,450 91.87% 82.26% 2386 11/5 5,999 6,273 104.57% 87.29% 797 11/6 25,812 23,856 92.42% 88.21% 2812 11/7 23,710 23,200 97.85% 91.54% 1962 11/8 22,398 23,494 104.89% 92.56% 1747 11/9 21,011 21,785 103.68% 92.78% 1572 11/10 19,796 20,884 105.50% 87.64% 2581 11/11 13,605 13,603 99.99% 89.74% 1395 11/26 6,076 5,575 91.75% 82.91% 953 11/27 24,465 22,901 93.61% 90.52% 2172 11/28 22,959 20,631 89.86% 87.31% 2619 11/29 22,787 21,166 92.89% 90.72% 1964 11/30 21,784 21,663 99.44% 92.78% 1563 Metrics 572,892 552,651 96.47% 87.12% 73,788 All Res-Bili 10% Difference during Intervals 100 % Accuracy by end of Day
  • 8.
    8© 2007 ConvergysCorporation. All rights reserved. AAVV - Baselines and Benchmarks - sample DSG Interval Forecast Variance - May15th through May 21st 0.00% 10.00% 20.00% 30.00% 40.00% 50.00% 60.00% 70.00% 80.00% 90.00% 100.00% 12:00 AM5:00 AM 10:00 AM3:00 PM8:00 PM1:00 AM6:00 AM 11:00 AM4:00 PM9:00 PM2:00 AM7:00 AM 12:00 PM5:00 PM 10:00 PM3:00 AM8:00 AM1:00 PM6:00 PM 11:00 PM4:00 AM9:00 AM2:00 PM7:00 PM 12:00 AM5:00 AM 10:00 AM3:00 PM8:00 PM1:00 AM6:00 AM 11:00 AM4:00 PM9:00 PM PercentForecastVariance Best Practice Range
  • 9.
    9© 2007 ConvergysCorporation. All rights reserved. Scheduling Measure – Schedule Quality Index (SQI)  Concept - Measure of how closely the schedules created match the forecasted needs.  Calculating Absolute Value Variance by Interval from a locked planned forecast requirements at a pre determined timeframe for schedule generation.  Schedules are generated against interval forecast requirements plus shrinkage or schedule overhead.  Generally using schedules to planned forecast requirements in a WFM tool. Static or Flex.  Calculate for Schedules to be released to agent population.  Calculation:  (Sum Total of Forecast Reqs) – Sum Total Absolute Variance Schedules to Fore)) / Sum Total Forecast Reqs
  • 10.
    10© 2007 ConvergysCorporation. All rights reserved. SQI IEX TotalView  Utilize Performance Analysis Report From: 02/23/08 IEX TotalView 02/27/08 To: 02/29/08 MTS-ttlv 16:48 Shift: 0 All Day Performance Analysis Management Unit: 302 Wireless - Cust Srv Page: 8 CT: 302 Wireless - Cust Srv Date: Tuesday, 02/26/08 Sched ---------Weekly Plan------ -----Schedule---- -------Adherence------- --Seat Limits ( 0/9999)-- Time Open Req. Diff. O/U Req. O/U Est. O/U Dev. Occupied O/U Min Vacant 22:30 0.00 0.00 0.00 0.00 0.00 0.00 0.00 0.00 * 0.00 0.00 9999.00 23:00 0.00 0.00 0.00 0.00 0.00 0.00 0.00 0.00 * 0.00 0.00 9999.00 23:30 0.00 0.00 0.00 0.00 0.00 0.00 0.00 0.00 * 0.00 0.00 9999.00 Avgs: 10.00 11.06 0.57 1.06 11.06 1.06 9.90 1.17 5% 10.62 10.62 9988.38 Summary: Forecasted Hours Required : 265.55 Schedule Open Hours : 240.08 Overhead Hours : 0.00 Schedule Hours Under : 30.07 Total Hours : 265.55 Schedule Hours Over : 4.60 Agents Scheduled: 50 For Req = 265.55 Tot Abs Var = 34.67 Diff = 230.88 SQI = 86.94 %
  • 11.
    11© 2007 ConvergysCorporation. All rights reserved. SQI Aspect eWFM  Scheduling Runs – Staffing Basis to create new shifts or Test current schedules.  Schedule Efficiency in FTE Summary = Schedule Quality Index (SQI) Schedule Efficiency 85.54 Scheduled FTE 310.00 Schedule Inflexibility 5.14 SG-CSCW FTE Summary Required FTE 294.06
  • 12.
    12© 2007 ConvergysCorporation. All rights reserved. SQI – Sample Worksheet Sunday Monday Tuesday WednesdayThursday Friday Saturday WEEK Date 11/05/06 11/06/06 11/07/06 11/08/06 11/09/06 11/10/06 11/11/06 TOTAL Pulled Thursday 10/26/2006 - Schedules released Summary: Forecast Hours Required 310.90 1429.41 1312.62 1277.70 1214.19 1163.95 778.86 7487.63 Overhead Hours 102.60 468.95 430.68 419.09 398.37 381.85 255.43 2456.97 Total Hours 413.50 1898.36 1743.30 1696.79 1612.56 1545.80 1034.29 9944.60 Schedule Open Hours 453.75 1862.50 1795.75 1801.75 1676.00 1597.25 1106.25 10293.25 Schedule Hours Under 4.26 91.96 43.13 40.81 46.31 44.59 28.79 299.85 Schedule Hours Over 44.51 56.09 95.57 145.76 109.74 96.04 101.09 648.80 Agents 66 305 290 283 271 267 156 Schedule Quality Index Z = TH - ( SHU +SHO) 364.73 1750.31 1604.6 1510.22 1456.51 1405.17 904.41 8995.95 ABS(Z) / TH 88.2% 92.2% 92.0% 89.0% 90.3% 90.9% 87.4% 90.5%
  • 13.
    13© 2007 ConvergysCorporation. All rights reserved. SQI – Baseline and Benchmark - sample RC2 Schedule Quality Index 40.00% 50.00% 60.00% 70.00% 80.00% 90.00% 100.00% 8/20/2006 8/27/2006 9/3/2006 9/10/2006 9/17/2006 9/24/2006 10/1/2006 10/8/200610/15/200610/22/200610/29/2006 11/5/200611/12/200611/19/200611/26/2006 12/3/200612/10/200612/17/200612/24/2006 IEX Implementation Timeline Percent RES REPAIR Linear (RES REPAIR)
  • 14.
    14© 2007 ConvergysCorporation. All rights reserved. Best Practice Findings - notes  SQI can be used as a qualitative evaluation of schedule mixes with shift types and work rules.  SQI must include Shrinkage/Schedule Overhead  Be Flexible with Tool settings to achieve desired results.  Don’t get hung up on numbers. Baseline yours and establish continuous feedback loop for improvement.  SQI – Best Practice - 95 %  AVV – Best Practice - 90-95%  Other Measures  Staffing Adherence Index (SAI) - Measure of how closely agents were staffed into the assigned schedules.  Aggregate Schedule Adherence - Measure of how closely agents/centers followed the plan net staff plan.