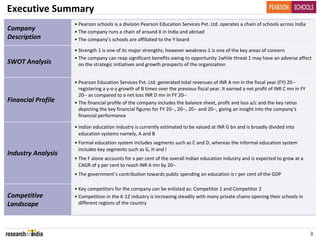
Pearson Schools
September 2011
Contents


                  Executive Summary
                  Factsheet
                  Offices & Centres
                  Key People
                  SWOT Analysis
                  Expansion Plans
Pearson Schools   Financial Profile
                  Industry Analysis
                  Competitive Landscape
                  Competitive Benchmarking
                  Recent News
                  Appendix


                                              2
Executive Summary
                    • Pearson schools is a division Pearson Education Services Pvt. Ltd. operates a chain of schools across India
Company             • The company runs a chain of around X in India and abroad
Description         • The company’s schools are affiliated to the Y board

                    • Strength 1 is one of its major strengths; however weakness 1 is one of the key areas of concern
                    • The company can reap significant benefits owing to opportunity 1while threat 1 may have an adverse affect 
SWOT Analysis         on the strategic initiatives and growth prospects of the organization


                    • Pearson Education Services Pvt. Ltd. generated total revenues of INR A mn in the fiscal year (FY) 20‐‐
                      registering a y‐o‐y growth of B times over the previous fiscal year. It earned a net profit of INR C mn in FY 
                      20‐‐ as compared to a net loss INR D mn in FY 20‐‐
Financial Profile   • The financial profile of the company includes the balance sheet, profit and loss a/c and the key ratios 
                      depicting the key financial figures for FY 20‐‐, 20‐‐, 20‐‐ and 20‐‐, giving an insight into the company's 
                      financial performance

                    • Indian education industry is currently estimated to be valued at INR G bn and is broadly divided into 
                      education systems namely, A and B
                    • Formal education system includes segments such as C and D, whereas the informal education system 
                      includes key segments such as G, H and I
Industry Analysis
                    • The F alone accounts for x per cent of the overall Indian education industry and is expected to grow at a 
                      CAGR of y per cent to reach INR A mn by 20‐‐
                    • The government’s contribution towards public spending on education is r per cent of the GDP

                    • Key competitors for the company can be enlisted as: Competitor 1 and Competitor 2
Competitive         • Competition in the K‐12 industry is increasing steadily with many private chains opening their schools in 
Landscape             different regions of the country


                                                                                                                                       3
Factsheet (1/3)
Basic Information            Brief Description
Industry                ‐‐   • Pearson Schools (Pearson) is a division of Name 1 formerly 
                               known as Name 2, provides services in the X of the education 
                               sector 
Corporate Address       ‐‐


                                 Name 2 was formerly known as Name 3
                                 It operates Y in India and abroad


                                                                                LE
                                 Pearson is affiliated to Z board


                                               P
                             • Name 2 is a joint Venture between Name 4 and Name 5
                                • Name 4: offers A tutoring to the students


                                              M
Tel No.                 ‐‐   • It provides G and H courses


                                             A
Fax No.                 ‐‐   • Pearson encompasses P, Q and R segment
Website
Year  Founded
Year of Incorporation
Ownership
                        ‐‐
                        ‐‐
                        ‐‐
                        ‐‐
                                           S
                                 It also has certain unique courses named C and D
                                 C provides P based learning for children
                                 D offers a range of T for the students such as:
                                    • ‐‐
                                    • ‐‐
                                    • ‐‐
                                    • ‐‐
Revenue                 ‐‐
                             • It follows the E and F approaches to teach its students
Fiscal Year End         ‐‐   • Pearson organizes events such as U and V for students
Auditor                 ‐‐

Competitors             ‐‐


                              Brief History 
                              • 2008:
Source:

                                                                                               4
Offices & Centres – India 


                   LE  
             MP
          S A


                                     HQ Office
                                     Pearson Schools


Source:                      Note:

                                                       5
Offices & Centres – Global 


                                      LE  
                                 MP
Source:
                              S A       Pearson Schools


                                                          6
Key People (1/3)
CEO and Managing Director                              President
Mrs. X                                                 Mr. Y
Chief Executive Officer and Managing Director          President
Age : ‐‐                                               Age : ‐‐
Since: ‐‐‐‐                                            Since: ‐‐‐‐

Current Position:         • ‐‐                         Current Position:       • ‐‐

Professional History:     • ‐‐                         Professional History:   • ‐‐

Qualification:            • ‐‐                         Qualification:          • ‐‐

Others:                   • ‐‐                         Others                  • ‐‐


                                                LE  
                       MP                              Director


                    S A                                Mr. Z
                                                       Director
                                                       Age : ‐‐
                                                       Since: ‐‐‐‐
                                                       Current Position:       • ‐‐
                    75%                                Professional History:   • ‐‐
                                                       Qualification:          • ‐‐

Source:

                                                                                      7
SWOT Analysis
                    Strengths                         Weaknesses
• Strength 1:                         • Weakness 1:


• Strength 2:


                                            LE  
                                      • Weakness 2:


• Strength 3:

                                      MP
                                   S A
                   Opportunities                        Threats
• Opportunity 1:
                                      • Threat 1:


• Opportunity 2:
                                      • Threat 2:


Source:

                                                                   8
Ratio Analysis
Key Ratios                                                                    Key Ratio Analysis
                                 y‐o‐y 
          Particulars           change     2010      2009     2008     2007
                                                                              • Analysis Point 1
                               (2010‐09)


Profitability Ratios               ‐        ‐          ‐        ‐       ‐
                                                                              • Analysis Point 2


                                                                                                       E
Operating Margin                   ‐        ‐          ‐        ‐       ‐


                                                                                                      L
Net Margin                         ‐        ‐          ‐        ‐       ‐


                                                                                            P
Profit Before Tax Margin           ‐        ‐          ‐        ‐       ‐     • Analysis Point 3
Return on Equity                   ‐        ‐          ‐        ‐       ‐


                                                                                           M
Return on Capital Employed         ‐        ‐          ‐        ‐       ‐
Return on Working Capital          ‐        ‐          ‐        ‐       ‐


                                                                                          A
                                                                              • Analysis Point 4
Return on Assets                   ‐        ‐          ‐        ‐       ‐
Return on Fixed Assets
Cost Ratios
Operating costs (% of Sales)
Interest costs (% of Sales)
Liquidity Ratios
                                   ‐
                                   ‐
                                   ‐
                                   ‐

                                   ‐
                                            ‐
                                            ‐
                                            ‐
                                            ‐

                                            ‐
                                                       ‐
                                                       ‐
                                                       ‐
                                                       ‐

                                                       ‐
                                                                ‐
                                                                ‐
                                                                ‐
                                                                ‐

                                                                ‐
                                                                        ‐
                                                                        ‐
                                                                        ‐
                                                                        ‐

                                                                        ‐
                                                                                        S
                                                                              • Analysis Point 5


                                                                              • Analysis Point 6
Current Ratio                      ‐        ‐          ‐        ‐       ‐
Cash Ratio                         ‐        ‐          ‐        ‐       ‐
                                                                              • Analysis Point 7
Leverage Ratios                    ‐        ‐          ‐        ‐       ‐

Debt to Equity Ratio               ‐        ‐          ‐        ‐       ‐
Debt to Capital Ratio              ‐        ‐          ‐        ‐       ‐
Interest Coverage Ratio            ‐        ‐          ‐        ‐       ‐

Efficiency Ratios                  ‐        ‐          ‐        ‐       ‐

Fixed Asset Turnover               ‐        ‐          ‐        ‐       ‐
                                                                                               100%
Asset Turnover                     ‐        ‐          ‐        ‐       ‐
Current Asset Turnover             ‐        ‐          ‐        ‐       ‐
Working Capital Turnover           ‐        ‐          ‐        ‐       ‐
Capital Employed Turnover          ‐        ‐          ‐        ‐       ‐
Source:                                           Improved   Decline            Note:
                                                                                                             9
Industry Analysis
K‐12 Market – Overview                                                 Size & Growth 
• The K12 Market in India is expected to grow at a CAGR of a per 


  cent reaching INR Y bn by 20‐‐                                          INR mn


                                              E
• It accounts for approximately z per cent of the overall education    2,000


                                             L
  market in India                                                                                 a %         Y


                     P
• Among the total students enrolled in this space, c% of students      1,500


                    M
  access private K12 institutions while d % of the revenues are                     X
                                                                       1,000
  generated by private unaided schools  


                 S A
• The market is regulated by the Ministry of Human Resource 
  Development with institutions required to operate as not‐for‐
  profit institutes set up under a Trust/ Society
• Government has taken various initiatives towards developing 
                                                                        500

                                                                          0
                                                                                   2008                     2012e
  the market which includes:
    • Initiative 1                                                     Market Segmentation – No. of Schools 
    • Initiative 2
• Some of the major drivers identified in the market include:                           Private
    • Driver 1                                                                              g%
    • Driver 2
    • Driver 3
    • Driver 4


                                                                                                  h %
                                                                                                   Public
Source:

                                                                                                                    10
Competitive Landscape (2/2)
Competitive Scenario
Company Name        Billabong         Edify               Pearson               Shemford                     Shemrock

                                              Number of Centres

Study Centres           ‐               ‐                     ‐                      ‐                            ‐

                                   Financial Information (INR mn – FY 2010)
Total Revenue           ‐               ‐                     ‐                      ‐                            ‐

Net Profit/(loss)       ‐               ‐                     ‐                      ‐                            ‐

                                        Geographic Presence (India)

Zone 1                 M               NA                    M                      H                             H

Zone 2                 NA               L                    NA                     M                             NA

Zone 3                 H               M                     L                       L                            NA

Zone 4                  L               H                    H                      M                             NA

                                Major Market Segmentation (courses/subjects)

Courses Offered:

Kindergarten                                                                                                  
Junior                                                                                                        

Secondary                                                                                                     

Higher Secondary                                                                                              

Source:                         SAMPLE                                 H: High; L: Low; M: Medium      Offered       Not Offered

                                                                                                                                11
Thank you for the attention
Pearson Schools is a part of Netscribes’ Education Company Profile Series.
For more detailed information or customized research requirements please contact:


Gagan Uppal                                                                 Jitendra Punjabi
Phone:        +91 22 4098 7530                                              Phone:         +91 33 4064 6215
E‐Mail:       gagan.uppal@netscribes.com                                    E‐Mail:        jitendra.punjabi@netscribes.com


About Netscribes
Netscribes is a knowledge‐consulting and solutions firm with clientele across the globe. The company’s expertise spans areas of investment 
& business research, business & corporate intelligence, content‐management services, and knowledge‐software services. At its core lies a 
true value proposition that draws upon a vast knowledge base. Netscribes is a one‐stop shop designed to fulfil clients’ profitability and 
growth objectives.
This report is published for general information only. Although high standards have been used in preparing this report, Netscribes (India) Pvt. 
Ltd. or Netscribes is not responsible for any loss or damage arising from use of this document. This document is the sole property of Netscribes 
(India) Pvt. Ltd. and no part may be reproduced without prior written permission.

                                                 www.netscribes.com
                                                                                                                                             12

Pearson schools - company profile

  • 1.
  • 2.
    Contents Executive Summary Factsheet Offices & Centres Key People SWOT Analysis Expansion Plans Pearson Schools Financial Profile Industry Analysis Competitive Landscape Competitive Benchmarking Recent News Appendix 2
  • 3.
    Executive Summary • Pearson schools is a division Pearson Education Services Pvt. Ltd. operates a chain of schools across India Company  • The company runs a chain of around X in India and abroad Description • The company’s schools are affiliated to the Y board • Strength 1 is one of its major strengths; however weakness 1 is one of the key areas of concern • The company can reap significant benefits owing to opportunity 1while threat 1 may have an adverse affect  SWOT Analysis on the strategic initiatives and growth prospects of the organization • Pearson Education Services Pvt. Ltd. generated total revenues of INR A mn in the fiscal year (FY) 20‐‐ registering a y‐o‐y growth of B times over the previous fiscal year. It earned a net profit of INR C mn in FY  20‐‐ as compared to a net loss INR D mn in FY 20‐‐ Financial Profile • The financial profile of the company includes the balance sheet, profit and loss a/c and the key ratios  depicting the key financial figures for FY 20‐‐, 20‐‐, 20‐‐ and 20‐‐, giving an insight into the company's  financial performance • Indian education industry is currently estimated to be valued at INR G bn and is broadly divided into  education systems namely, A and B • Formal education system includes segments such as C and D, whereas the informal education system  includes key segments such as G, H and I Industry Analysis • The F alone accounts for x per cent of the overall Indian education industry and is expected to grow at a  CAGR of y per cent to reach INR A mn by 20‐‐ • The government’s contribution towards public spending on education is r per cent of the GDP • Key competitors for the company can be enlisted as: Competitor 1 and Competitor 2 Competitive  • Competition in the K‐12 industry is increasing steadily with many private chains opening their schools in  Landscape different regions of the country 3
  • 4.
    Factsheet (1/3) Basic Information Brief Description Industry ‐‐ • Pearson Schools (Pearson) is a division of Name 1 formerly  known as Name 2, provides services in the X of the education  sector  Corporate Address ‐‐    Name 2 was formerly known as Name 3  It operates Y in India and abroad LE  Pearson is affiliated to Z board P • Name 2 is a joint Venture between Name 4 and Name 5 • Name 4: offers A tutoring to the students M Tel No. ‐‐ • It provides G and H courses A Fax No. ‐‐ • Pearson encompasses P, Q and R segment Website Year  Founded Year of Incorporation Ownership ‐‐ ‐‐ ‐‐ ‐‐ S  It also has certain unique courses named C and D  C provides P based learning for children  D offers a range of T for the students such as: • ‐‐ • ‐‐ • ‐‐ • ‐‐ Revenue ‐‐ • It follows the E and F approaches to teach its students Fiscal Year End ‐‐ • Pearson organizes events such as U and V for students Auditor ‐‐ Competitors ‐‐ Brief History  • 2008: Source: 4
  • 5.
    Offices & Centres – India  LE   MP S A HQ Office Pearson Schools Source: Note: 5
  • 6.
    Offices & Centres – Global  LE   MP Source: S A Pearson Schools 6
  • 7.
    Key People (1/3) CEO and Managing Director President Mrs. X Mr. Y Chief Executive Officer and Managing Director President Age : ‐‐ Age : ‐‐ Since: ‐‐‐‐ Since: ‐‐‐‐ Current Position: • ‐‐ Current Position: • ‐‐ Professional History: • ‐‐ Professional History: • ‐‐ Qualification: • ‐‐ Qualification: • ‐‐ Others: • ‐‐ Others • ‐‐ LE   MP Director S A Mr. Z Director Age : ‐‐ Since: ‐‐‐‐ Current Position: • ‐‐ 75% Professional History: • ‐‐ Qualification: • ‐‐ Source: 7
  • 8.
    SWOT Analysis Strengths Weaknesses • Strength 1: • Weakness 1: • Strength 2: LE   • Weakness 2: • Strength 3: MP S A Opportunities Threats • Opportunity 1: • Threat 1: • Opportunity 2: • Threat 2: Source: 8
  • 9.
    Ratio Analysis Key Ratios Key Ratio Analysis y‐o‐y  Particulars  change  2010 2009 2008 2007 • Analysis Point 1 (2010‐09)   Profitability Ratios ‐ ‐ ‐ ‐ ‐ • Analysis Point 2 E Operating Margin ‐ ‐ ‐ ‐ ‐ L Net Margin ‐ ‐ ‐ ‐ ‐ P Profit Before Tax Margin ‐ ‐ ‐ ‐ ‐ • Analysis Point 3 Return on Equity ‐ ‐ ‐ ‐ ‐ M Return on Capital Employed ‐ ‐ ‐ ‐ ‐ Return on Working Capital ‐ ‐ ‐ ‐ ‐ A • Analysis Point 4 Return on Assets ‐ ‐ ‐ ‐ ‐ Return on Fixed Assets Cost Ratios Operating costs (% of Sales) Interest costs (% of Sales) Liquidity Ratios ‐ ‐ ‐ ‐ ‐ ‐ ‐ ‐ ‐ ‐ ‐ ‐ ‐ ‐ ‐ ‐ ‐ ‐ ‐ ‐ ‐ ‐ ‐ ‐ ‐ S • Analysis Point 5 • Analysis Point 6 Current Ratio ‐ ‐ ‐ ‐ ‐ Cash Ratio ‐ ‐ ‐ ‐ ‐ • Analysis Point 7 Leverage Ratios ‐ ‐ ‐ ‐ ‐ Debt to Equity Ratio ‐ ‐ ‐ ‐ ‐ Debt to Capital Ratio ‐ ‐ ‐ ‐ ‐ Interest Coverage Ratio ‐ ‐ ‐ ‐ ‐ Efficiency Ratios ‐ ‐ ‐ ‐ ‐ Fixed Asset Turnover ‐ ‐ ‐ ‐ ‐ 100% Asset Turnover ‐ ‐ ‐ ‐ ‐ Current Asset Turnover ‐ ‐ ‐ ‐ ‐ Working Capital Turnover ‐ ‐ ‐ ‐ ‐ Capital Employed Turnover ‐ ‐ ‐ ‐ ‐ Source: Improved Decline Note: 9
  • 10.
    Industry Analysis K‐12 Market – Overview   Size & Growth  • The K12 Market in India is expected to grow at a CAGR of a per    cent reaching INR Y bn by 20‐‐ INR mn E • It accounts for approximately z per cent of the overall education  2,000 L market in India a % Y P • Among the total students enrolled in this space, c% of students  1,500 M access private K12 institutions while d % of the revenues are  X 1,000 generated by private unaided schools   S A • The market is regulated by the Ministry of Human Resource  Development with institutions required to operate as not‐for‐ profit institutes set up under a Trust/ Society • Government has taken various initiatives towards developing  500 0 2008 2012e the market which includes: • Initiative 1 Market Segmentation – No. of Schools  • Initiative 2 • Some of the major drivers identified in the market include:  Private • Driver 1 g% • Driver 2 • Driver 3 • Driver 4 h % Public Source: 10
  • 11.
    Competitive Landscape (2/2) Competitive Scenario Company Name Billabong Edify Pearson Shemford Shemrock Number of Centres Study Centres ‐ ‐ ‐ ‐ ‐ Financial Information (INR mn – FY 2010) Total Revenue ‐ ‐ ‐ ‐ ‐ Net Profit/(loss) ‐ ‐ ‐ ‐ ‐ Geographic Presence (India) Zone 1 M NA M H H Zone 2 NA L NA M NA Zone 3 H M L L NA Zone 4 L H H M NA Major Market Segmentation (courses/subjects) Courses Offered: Kindergarten      Junior      Secondary      Higher Secondary       Source: SAMPLE  H: High; L: Low; M: Medium  Offered  Not Offered 11
  • 12.
    Thank you for the attention Pearson Schools isa part of Netscribes’ Education Company Profile Series. For more detailed information or customized research requirements please contact: Gagan Uppal Jitendra Punjabi Phone: +91 22 4098 7530 Phone: +91 33 4064 6215 E‐Mail: gagan.uppal@netscribes.com E‐Mail: jitendra.punjabi@netscribes.com About Netscribes Netscribes is a knowledge‐consulting and solutions firm with clientele across the globe. The company’s expertise spans areas of investment  & business research, business & corporate intelligence, content‐management services, and knowledge‐software services. At its core lies a  true value proposition that draws upon a vast knowledge base. Netscribes is a one‐stop shop designed to fulfil clients’ profitability and  growth objectives. This report is published for general information only. Although high standards have been used in preparing this report, Netscribes (India) Pvt.  Ltd. or Netscribes is not responsible for any loss or damage arising from use of this document. This document is the sole property of Netscribes  (India) Pvt. Ltd. and no part may be reproduced without prior written permission. www.netscribes.com 12