This document summarizes research on the relationship between executive compensation and firm performance. The key points are:
1. Executive compensation has increased dramatically over the last 3 decades, far outpacing worker pay growth. However, research studies have found little to no correlation between high executive pay and stronger firm performance.
2. While companies argue that incentive-based pay motivates executives, some studies show executive pay is often not closely tied to performance metrics and stock price movements.
3. Alternative views of "performance" beyond short-term profits, such as investment, innovation, and workforce development, are rarely considered in executive compensation.
4. To strengthen the link between pay and performance, companies increasingly use long-
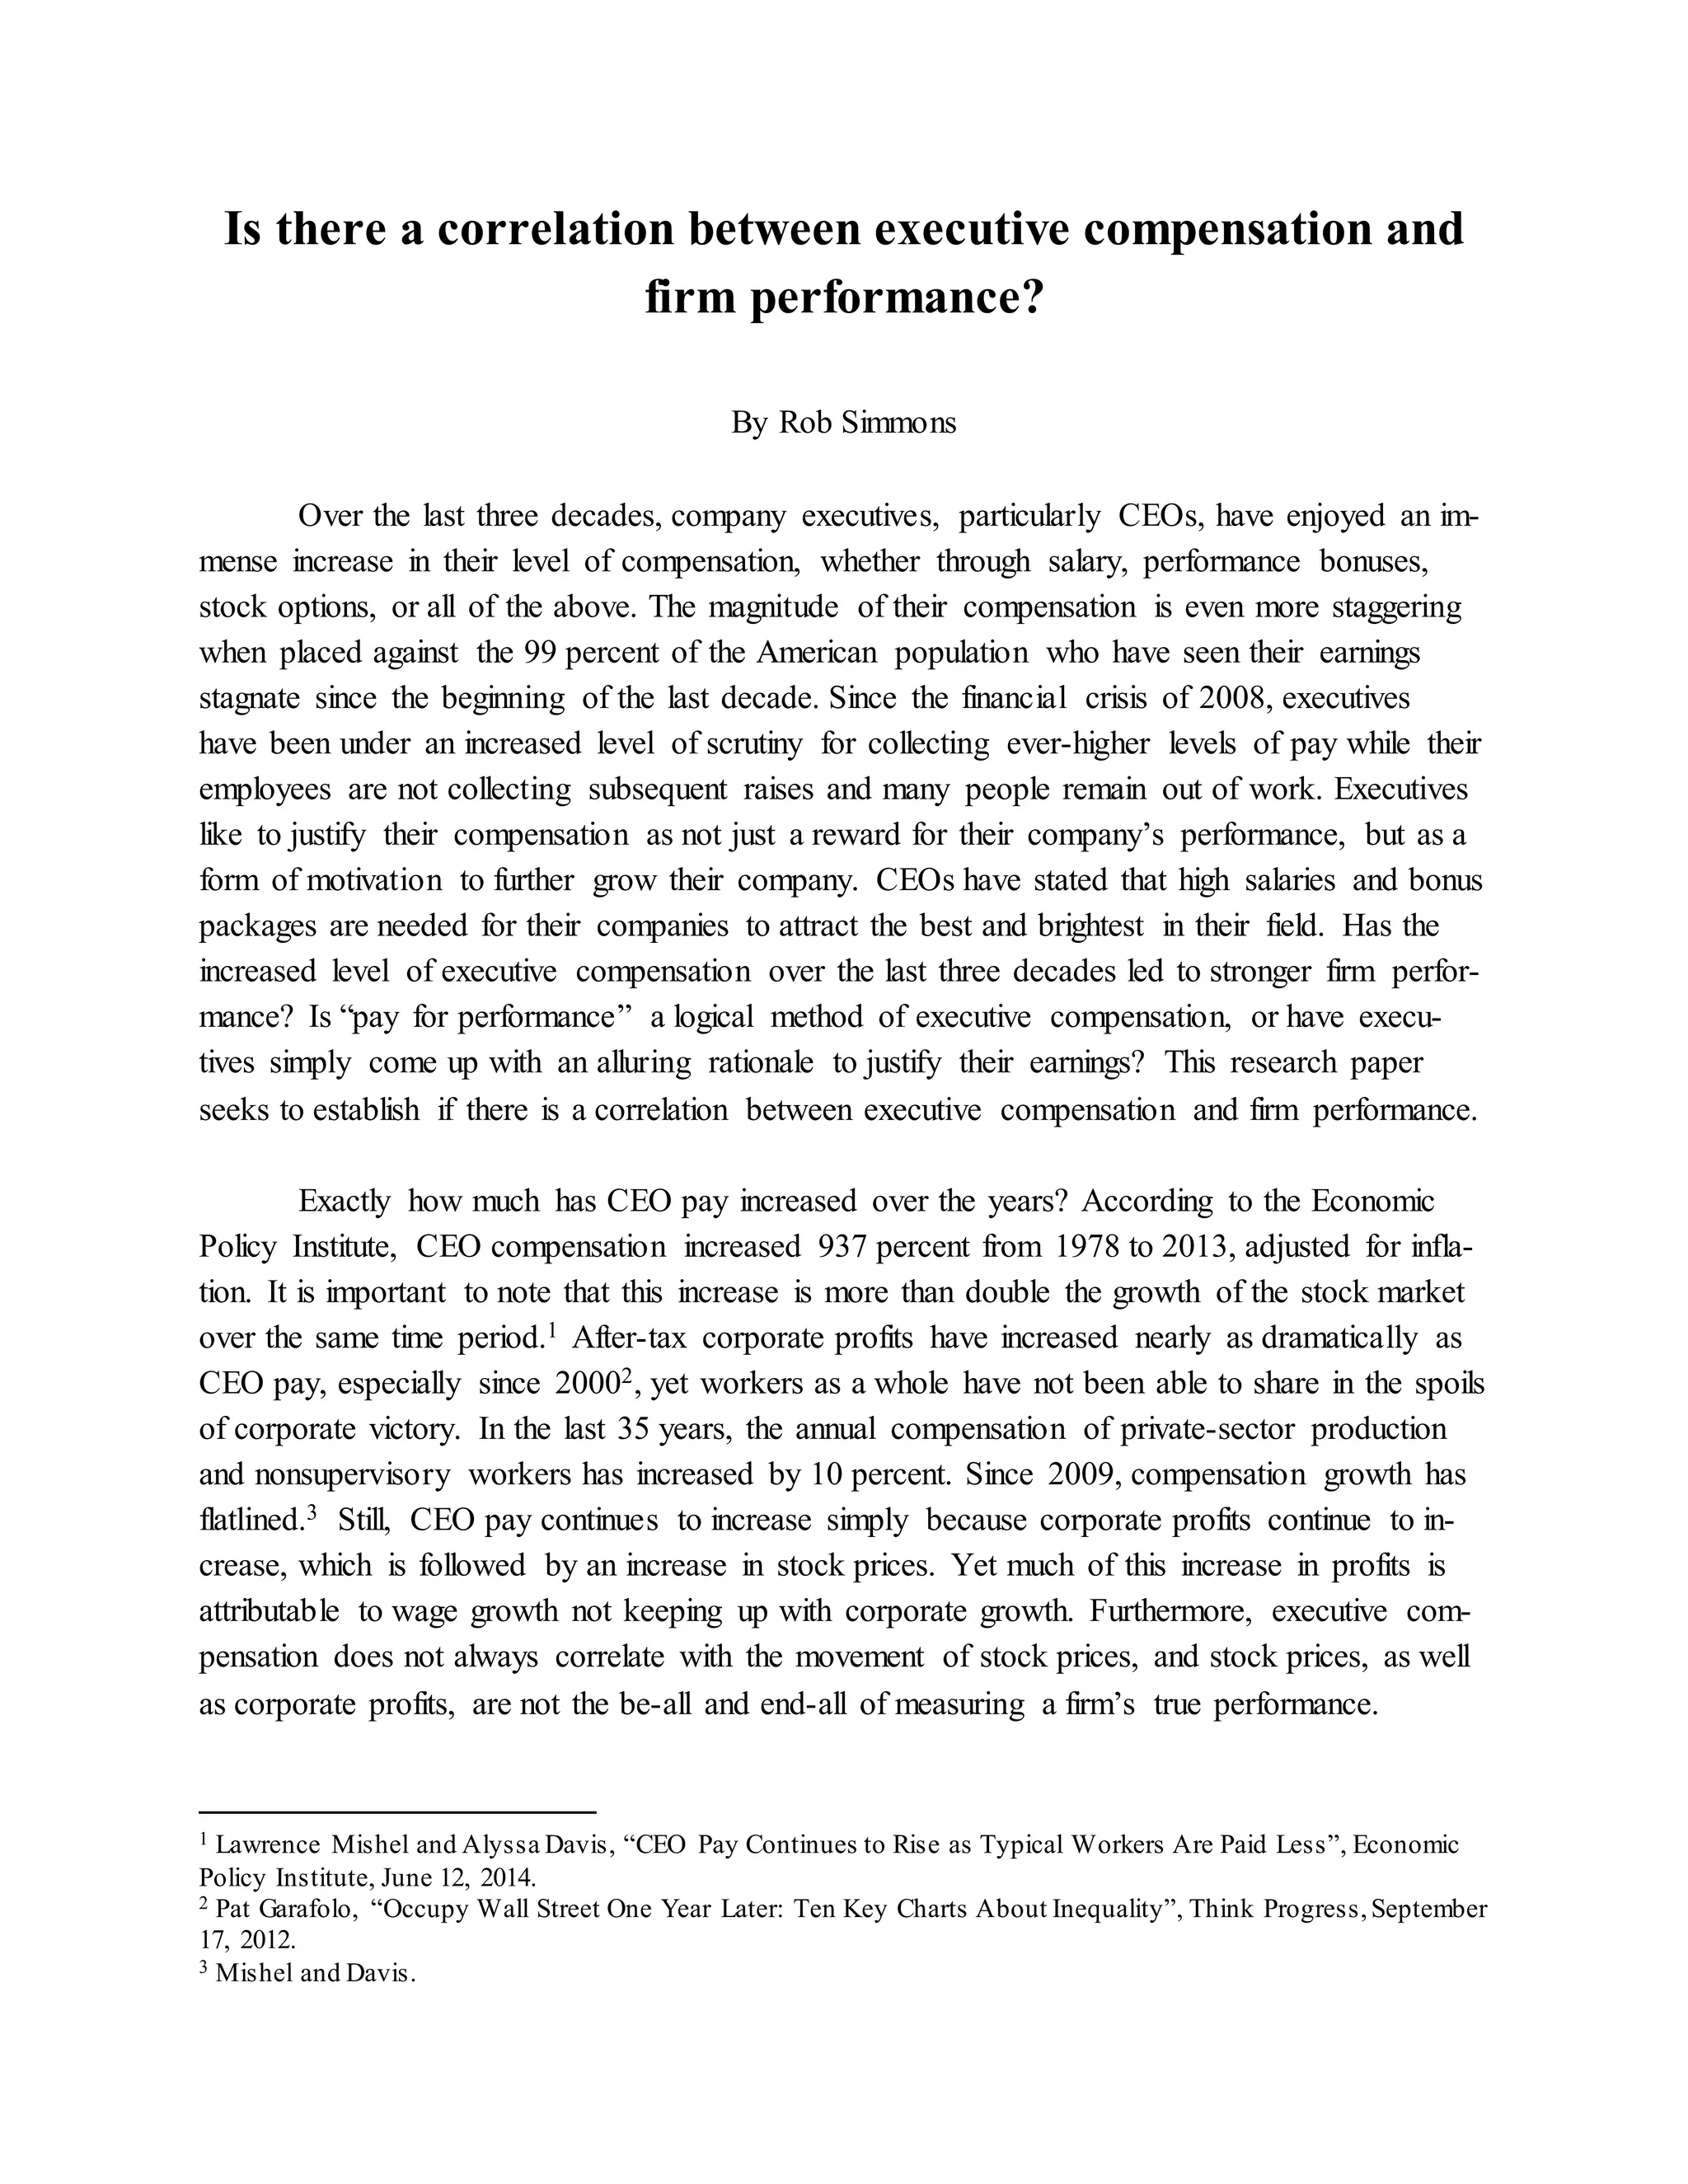
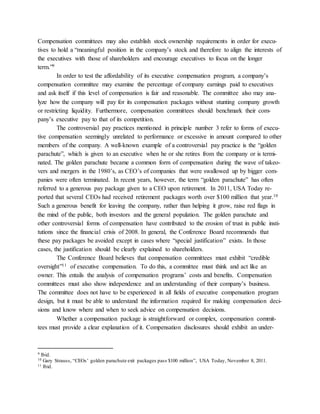
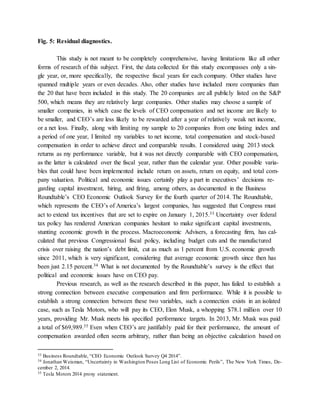
![and the second plot comparing net income to a CEO’s stock-based compensation. The results are
as follows:
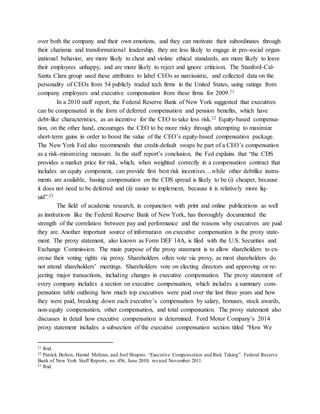
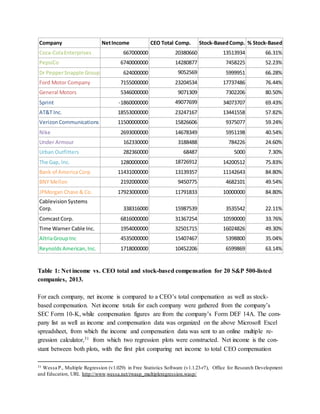
1. Net Income vs. CEO Total Compensation
While the 20 companies in this study are all well-known, there was still a wide disparity
in the companies’ net income. In fact, Sprint recorded a net loss for 2013 totaling $1.86 billion.
The biggest earner was rival AT&T, with a net income of more than $18.5 billion. In fact, there
is a relatively large gap in income between the companies in each of the eight industries repre-
sented, save the auto industry, where Ford and General Motors are very competitive with each
other and have been since 2009, when GM began its U.S. government-aided reconstruction fol-
lowing its bankruptcy and Ford, with plenty of cash on hand, was able to survive the financial
meltdown and global recession without any government assistance.
Total CEO compensation amongst the 20 companies also varied greatly. Urban Outfit-
ters’ CEO was the lowest-paid by a big margin, taking home $68,487 in 2013. The second-low-
est-paid CEO in the group, at $3.19 million, was the CEO of Under Armour. Interestingly, the
CEO of Sprint was the highest-paid, at over $49 million. The median CEO compensation of the
group was just over $15 million.
The equation relating corporate income to CEO compensation is as follows:
Net_Income[t] = + 5262220000 -15.6405CEO_Total_Compensation[t]
+ 654575t + e[t]
The t-statistic of -0.1226 and p-value of 0.451938 of the CEO_Total_Compensation variable in-
dicate a lack of correlation between the net income and total compensation values. While the t-
statistic is negative, indicating an inverse relationship between net income and total CEO com-
pensation, it is so insignificant in value that it may have been positive had one or two different
companies been used in the sample. The R-squared value is 0.00172123, meaning that CEO
compensation was little more than one-tenth of one percent based on corporate income.
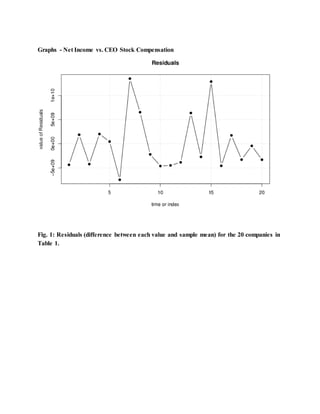
Graphs - Net Income vs. CEO Total Compensation](https://image.slidesharecdn.com/0cfc0e28-f64c-459b-878d-65b87a4837a9-150206150820-conversion-gate01/85/Accounting-Research-Paper-revised-13-320.jpg)
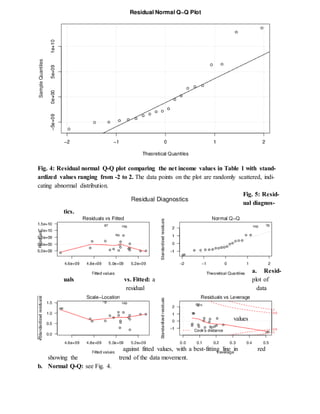
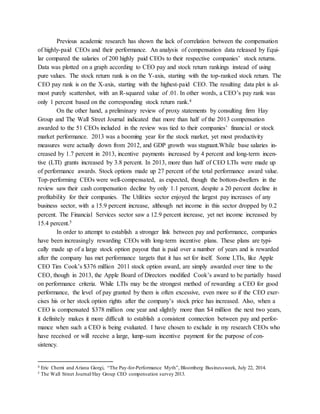
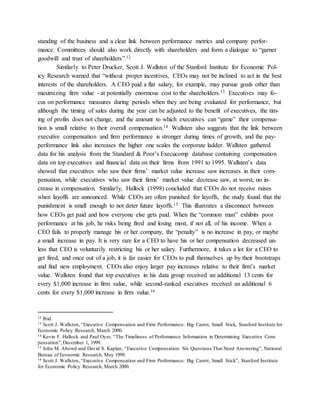
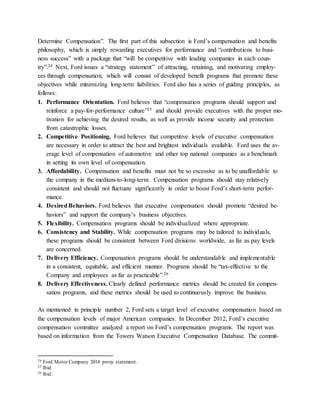
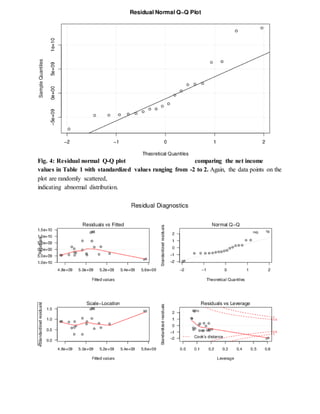
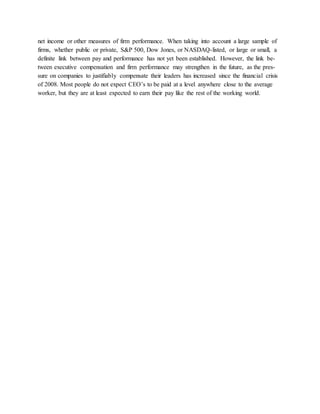
![c. Scale-Location: a plot of the square root of standardized residuals against the same fitted
values of graph 5a, also with a best-fitting line in red.
d. Residuals vs. Leverage: a plot of standardized residuals against “leverage”, which is a
measure of the influence that a data point has on the regression relationship. The dotted red
lines represent Cook’s distance, which measures the effect of deleting a given data point.
2. Net Income vs. CEO Stock-BasedCompensation
Is the relationship between net income and a CEO’s stock-based compensation any more signifi-
cant? The equation relating net income to CEO stock-based compensation is as follows:
Net_Income[t] = + 12818500 + 3.90969e-
05CEO_Stock_Compensation[t] -297448t + e[t]
For the CEO_Stock_Compensation variable, the t-statistic of 0.1299 is nearly a mirror of the
CEO_Total_Compensation variable’s t-statistic, while the p-value of 0.449083 is almost identi-
cal to the p-value of CEO_Total_Compensation. The R-squared value is 0.0567828, indicating at
least a minimal correlation between net income and stock-based compensation.
The amounts of stock-based compensation that the 20 CEO’s in the group received was,
like the amount of total compensation, highly variable. The CEO of Urban Outfitters received
$5,000 in stock pay, by far the lowest amount. Sprint’s CEO received the highest amount of
stock-based compensation, with a total of over $30 million. However, several other CEO’s in the
group received a greater percentage of their compensation in stock-based pay. The CEO’s of
Bank of America Corp. and JPMorgan Chase & Co. both received 84.8% of their pay in stocks,
options, and other stock-based incentives. Interestingly, the CEO of fellow banking firm BNY
Mellon was granted stock-based compensation totaling less than half of his total pay. It is indi-
cated in BNY Mellon’s 2014 proxy statement that the CEO, Gerald Hassell, was not granted any
amount of stock options in 2013. The proxy statement also indicated that Mr. Hassell had options
in his possession that have not yet been exercised.32 The CEO of Urban Outfitters was given the
lowest percentage of stock-based compensation in the group, at 7.3%, although the amounts of
both his total and stock-based compensation are insignificant relative to the rest of the group.
Otherwise, the CEO of Cablevision Systems Corp. received the lowest level of stock-based com-
pensation, percentage-wise, at 22.11%.
32 BNY Mellon 2014 proxy statement.](https://image.slidesharecdn.com/0cfc0e28-f64c-459b-878d-65b87a4837a9-150206150820-conversion-gate01/85/Accounting-Research-Paper-revised-17-320.jpg)


![[Whitepaper] The New Boardroom Imperative: Recruitment Marketing](https://cdn.slidesharecdn.com/ss_thumbnails/whitepaperthenewboardroomimperative-recruitmentmarketing-170526132130-thumbnail.jpg?width=640&height=640&fit=bounds)


