SlideShare a Scribd company logo
OECD‐
                      OECD‐FAO
            Agricultural Outlook  2011‐2020
            Agricultural Outlook  2011‐


                           Pavel Vavra

                   OECD Trade and Agriculture


The Outlook for EU Agriculture, COPA-COGECA, Brussels, 29 June, 2011


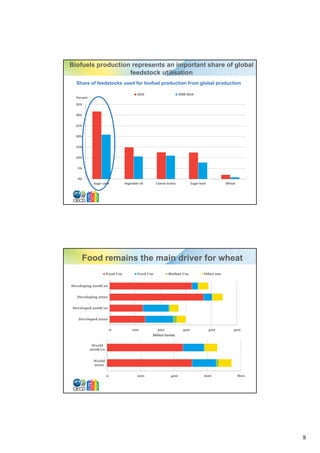
      OECD-FAO Agricultural Outlook

                                    • Agricultural Outlook ‐ a set of 
                                      conditional projections 
                                      published in an OECD‐FAO 
                                        bli h d i     OECD FAO
                                      annual report 
                                    • Comprehensive, dynamic partial 
                                      equilibrium model
                                    • The datasets are available at 
                                      www.agri‐outlook.org 
                                              i tl k


                            OECD Trade & Agriculture                     2


                                                                             1
Key macroeconomic assumptions

• Global economic recovery
  underway (fragile in OECD, but
  more robust in BRICs)

• 2.2% Inflation in OECD area but
  higher elsewhere

• Weak US dollar and higher oil
  prices

• Stable policy regimes


                               OECD Trade & Agriculture   3


              Slowdown in population growth


    Annual percentage change


                               OECD Trade & Agriculture   4


                                                              2
Urbanisation – a key driver
                                                               Rural Population   Urban Population

                                                9000
                                                8000
                                                7000
• Rural population numbers are
                                                6000
  expected to stagnate.


                                          ons
                                                5000


                                     Millio
                                                4000
• All additional population is to               3000

  live in urban areas                           2000
                                                1000
                                                  0
                                                   1965 1970 1975 1980 1985 1990 1995 2000 2005 2010 2015 2020


                                                4500
                                                4000
                                                3500
 • Move to urban areas to take                  3000
                                     Millions


                                                2500
   place mainly in developing                   2000
   countries                                    1500
                                                1000
                                                500
                                                  0
                                                   1965 1970 1975 1980 1985 1990 1995 2000 2005 2010 2015 2020

                                                               Developed urban    Developing Urban

                                    OECD Trade & Agriculture                                                5


             World oil prices to remain relatively high

       USD/Barrel
     120

     100

       80

       60

       40

       20

        0
         1985     1990     1995     2000                 2005          2010           2015           2020


                                    OECD Trade & Agriculture                                                6


                                                                                                                 3
Main commodity projections
• Commodity prices in real terms to remain above last
  decade average levels
   – Income, population and biofuels growth
   – Higher cost structure

• Latin America and Eastern Europe are the fastest growing
  production regions

• Developing countries driving the global demand and trade
  gains

• G
  Growing food deficits expected in Sub-Saharan countries
      i f d d fi it          t di S bS h            ti

• Meat, dairy products, vegetable oils and sugar should
  experience the highest increases in demand


                                    OECD Trade & Agriculture                     7


 Most commodity prices at higher average levels
    Percentage change in world prices in real terms relative to 2001-2010 base

  60


  50


  40


  30


  20


  10


   0


  -10


                                    OECD Trade & Agriculture                     8


                                                                                     4
Production shifts to developing countries
Share of global agricultural and fish production gains
Production gains between 2008/10 - 2020 valued at world reference prices (2004/06)


                                                                                     N.America
                                                                                        10%

                                                                      Oceania
                                                                        2%


                                                                                                         L.America
                                                                                                            21%
                                  Asia&Pacific
                                      45%


                                                                                                      W.Europe
                                                                                                         3%

                                                                                          E.Europe&C.Asia
                                                                                                7%
                                                                                  N.Africa&M.East
                                                                         S.S.Africa      3%
                                                                            9%


                                             0-15% over the decade        15-30% over the decade      +30% over the decade

                                                                     OECD Trade & Agriculture                                                      9


                 Production shifts to developing countries
Share of global agricultural and fish production gains                                     Sugar, vegetable oil and poultry production
Production gains between 2008/10 - 2020 valued at world reference prices (2004/06)         are expected to record the highest growths

                                                                                                         SMP
                                                                                                        WMP
                                                  N.America
                                                     10%                                               Cheese
                                                                                                       Butter
                                         Oceania
                                           2%
                                                                                                       Poultry
                                                                                                      Pigmeat
                                                                      L.America
                                                                                                         Beef
                                                                         21%
           Asia&Pacific
               45%                                                                                        Fish


                                                                                                        Sugar
                                                               W.Europe
                                                                  3%                               Veget. Oils
                                                        E.Europe&C.Asia
                                                        EE      &C A i                           Protein meals
                                                              7%                                      Oilseeds
                                                 N.Africa&M.East
                                           S.S.Africa 3%
                                              9%                                                          Rice
                                                                                                 Coarse grains
            0-15% over the decade         15-30% over the decade      +30% over the decade             Wheat

                                                                                                                 0    10     20     30     40


                                                                                                 Per cent change: 2020 compared to 2008-2010 average

                                                                     OECD Trade & Agriculture                                                     10


                                                                                                                                                       5
Large differences in milk production gains


                                   OECD Trade & Agriculture                                  11


Fish production growth driven by aquaculture
                                  Capture         Aquaculture
Million tonnes
180

160

140

120

100

80

60

40

20

  0
  2000       2002   2004   2006    2008        2010           2012   2014   2016   2018   2020


                                   OECD Trade & Agriculture                                  12


                                                                                                  6
Ethanol production growing steadily
  Feedstocks used for ethanol production over the projection period
160


140                                                                                         Other

 120                                                                                        Sugar beet


100                                                                                         Non agricultural
                                                                                            feedstock

  80                                                                                        Molasse


  60                                                                                        Wheat


  40                                                                                        Biomass-based


                                                                                            Sugar Cane
  20

                                                                                            Coarse grains
      -
Bnl         2008- 2011    2012   2013   2014   2015    2016      2017      2018 2019 2020
            2010


                                                OECD Trade & Agriculture                                    13


      Strong growth of global biodiesel production
            Feedstocks used for biodiesel production over the projection period
      Bnl
          40

                                                                                            Jatropha
          35

          30
                                                                                            Non
          25                                                                                agricultural
                                                                                            feedstock
          20
                                                                                            Biomass-
                                                                                            based
          15

          10
                                                                                            Vegetable oil

            5

            -
                2008-2010011 2012 2013 2014 2015 2016 2017 2018 2019 2020
                        2


                                                OECD Trade & Agriculture                                    14


                                                                                                                 7
Biofuels production represents an important share of global
                   feedstock utilisation
  Share of feedstocks used for biofuel production from global production

                                         2020                               2008‐2010
  Percent
  35%


  30%


  25%


  20%


  15%                                                                                   + 90 Mt
  10%


   5%


   0%
             Sugar cane          Vegetable oil           Coarse Grains              Sugar beet          Wheat


                                                 OECD Trade & Agriculture                                             15


     Food remains the main driver for wheat
                      Food Use            Feed Use                  Biofuel Use             Other use


Developing 2008/10
                                                                                + 34 Mt
   Developing 2020


 Developed 2008/10


   Developed 2020


                          0           100                 200                 300                400        500
                                                       Million tonnes

             World
            2008/10


             World
             2020


                      0                   200                         400                   600                 800


                                                 OECD Trade & Agriculture                                             16


                                                                                                                           8
…while feed and fuel push coarse grain demand up
                       Food Use          Feed Use               Biofuel Use               Other use


Developing 2008/10


  Developing 2020                                                                + 50 Mt
                                                                                 + 50 Mt
Developed 2008/10


   Developed 2020


                        0         100    200        300          400         500         600        700    800
                                                 Million tonnes                         + 90 Mt
               World
              2008/10


               World
               2020


                        0         200      400           600               800        1 000     1 200      1 400

                                                OECD Trade & Agriculture                                           17


              Driven by economic growth, meat consumption
               increases especially in developing countries
              Consumption of meat from 2008-10 average to 2020, per cent

              World                                                          Developing/Developed
                                                                       Developing
  Beef
                                                                       Developed
                                                                       D   l   d


  Pork


Poultry


 Sheep


          0       10        20      30     40                      0             10            20         30       40


                                                OECD Trade & Agriculture                                           18


                                                                                                                        9
Outlook for dairy products consumption


         Butter          Cheese                         SMP       WMP

                             OECD Trade & Agriculture                            19


Per capita consumption evolution differs by product
  Per capita consumption of WMP               Per capita consumption of cheese


                             OECD Trade & Agriculture                            20


                                                                                      10
Global trade to grow by 10-30%
Imports : Share of the import gains                                                                  Vegetable oils, rice and SMP
                                                                                                     trade growing the fastest
                                           N.America
                                              10%
                                      Oceania
                                                     L.America
                                                                                             SMP
                                        1%
                   Asia&Pacif                           9%                                  WMP
                       ic                                                                  Cheese
                      37%
                                                                                           Butter
                                                        W.Europe
                                                          15%
                                                                                           poultry
                                                    E.Europe&
                                                      C.Asia                              Pigmeat
                            S.S.Africa     N.Africa&    4%                                   Beef
                               9%           M.East
                                             15%
                                                                                              Fish
Exports: Share of the export gains
                                                                                            Sugar
                                                   N.America
                                                      13%
                                                                                      Veget. Oils
                                         Oceania
                                           4%                                      Protein meals
                                                                                          Oilseeds
                     Asia&Paci
                         fic
                        38%                                      L.America                    Rice
                                                                    27%
                                                                                   Coarse grains
                                     S.S.Africa                                            Wheat
                                        ‐1%

                                         E.Europe W.Europe                                           0       10           20      30         40
                            N.Africa&
                                         &C.Asia     6%
                             M.East                                                            Per cent change 2020 compared to 2008-2010 average
                                           11%
                               0%

                                                               OECD Trade & Agriculture                                                      21


             Sugar exports remain highly concentrated
                        and lead by Brazil

                                                                   2008‐10            2020
         Million tonnes r.s.e    .
       70

       60

       50

       40

       30

       20

       10

        0
               World                 Brazil          Thailand Australia                       Mexico              India        South 
                                                                                                                               Africa


                                                               OECD Trade & Agriculture                                                      22


                                                                                                                                                    11
While sugar imports are more diversified

                     OECD                                                    Emerging economies
     Million tonnes r.s.e.                                          Million tonnes r.s.e.
 6                                                           6
 5                                                           5
 4                                                           4
 3                                                           3
 2                                                           2
 1                                                           1
 0                                                           0
       European  United        Korea       Japan
                                                                          China Indonesia Russia      India
        Union    States
                                 2008‐10        2020


                                               OECD Trade & Agriculture                                       23


 Stochastic analysis of projected agricultural production
          Impact on world coarse grain prices
• Monte Carlo simulations on yields, oil and fertiliser prices, macroeconomic variables.
• 500 model runs show more upside potential for world coarse grains prices


                     10% percentile           baseline              median          90th percentile
          USD/t
       350

       300

       250

       200

       150

       100

         50

          0
              1975    1980   1985      1990     1995       2000           2005   2010   2015   2020


                                               OECD Trade & Agriculture                                       24


                                                                                                                   12
Key Market Drivers
                               Income changes impact mainly demand for meat and dairy products
                                 1 % additional income growth p.a.                             1% less income growth p.a.
     beef and veal
      sheep meat
            cheese
             butter
              sugar
     poultry meat
whole milk powder
whole milk powder
               pork
     coarse grains
             wheat
     vegetable oil
                rice

                  ‐2,5%      ‐2,0%     ‐1,5%       ‐1,0%     ‐0,5%       0,0%      0,5%     1,0%       1,5%        2,0%        2,5%
        Impact of a 1% increase/decrease of annual GDP growth on global commodity consumption (average over projection period)

                          Yield growth and changes have important impact on global commodity prices
                                       yields increase by 5%                              yields decrease by 5%
             wheat
                i
               rice
      coarse grains
     protein meals
      poultry meat
           oilseeds

                  ‐30%               ‐20%              ‐10%                  0%             10%                20%                30%
                         Impact of 5% increase/decrease in yields of cereals on world commodity prices (average over projection period)


                                                               OECD Trade & Agriculture                                                   25


                                         Key Market Drivers

 • Demand growth – above all in
   developing countries

 • C
   Convergence i consumption
               in       ti
   patterns

 • Developing countries raise meat
   consumption

 • Increased health and nutrition
   concerns

 • Supply adjusting to higher
   production costs

 • International investment


                                                               OECD Trade & Agriculture                                                   26


                                                                                                                                               13
Key issues and uncertainties

• Traditional uncertainties:
    – Weather and economic stability
    – Developments in trade and
      domestic policies


• Biofuels policies and biofuel
  developments

• Food security and climate
  change


•   Increased price volatility


                                  OECD Trade & Agriculture   27


                     OECD Trade and Agriculture


                 www.oecd.org/agriculture


                             Contact
                      tad.contact@oecd.org

                                  OECD Trade & Agriculture   28


                                                                  14

More Related Content

What's hot

Livestock in a Changing Landscape. Overview of Key Issues, Drivers, Consequen...
Livestock in a Changing Landscape. Overview of Key Issues, Drivers, Consequen...Livestock in a Changing Landscape. Overview of Key Issues, Drivers, Consequen...
Livestock in a Changing Landscape. Overview of Key Issues, Drivers, Consequen...
copppldsecretariat
 
Presentation 4 q12
Presentation 4 q12Presentation 4 q12
Presentation 4 q12
JBS RI
 
Ag slides
Ag slidesAg slides
Ag slides
quantinvestpl
 
Expected us gdp growth rate presentation
Expected us gdp growth rate presentationExpected us gdp growth rate presentation
Expected us gdp growth rate presentation
Victoria Rock
 
A spatial analysis: creating similarity domains for targeted research sites i...
A spatial analysis: creating similarity domains for targeted research sites i...A spatial analysis: creating similarity domains for targeted research sites i...
A spatial analysis: creating similarity domains for targeted research sites i...
Joanna Hicks
 
Mainstreaming agribusiness incubation for inclusive development
Mainstreaming agribusiness incubation for inclusive developmentMainstreaming agribusiness incubation for inclusive development
Mainstreaming agribusiness incubation for inclusive development
Kadin5
 
John Michael Staatz - Agricultural price volatility: causes, impacts & policy...
John Michael Staatz - Agricultural price volatility: causes, impacts & policy...John Michael Staatz - Agricultural price volatility: causes, impacts & policy...
John Michael Staatz - Agricultural price volatility: causes, impacts & policy...
Global Risk Forum GRFDavos
 
AIIC approach to promote agribusiness in Africa
AIIC approach to promote agribusiness in AfricaAIIC approach to promote agribusiness in Africa
AIIC approach to promote agribusiness in Africa
Agri-Busines Incubation (ABI) Program of ICRISAT
 
Livestock production and poverty alleviation in arid and semi-arid tropica...
Livestock production and poverty alleviation in arid and semi-arid tropica...Livestock production and poverty alleviation in arid and semi-arid tropica...
Livestock production and poverty alleviation in arid and semi-arid tropica...
ILRI
 
2012 GFPR Launch at IFPRI March 14 2013
2012 GFPR Launch at IFPRI March 14 20132012 GFPR Launch at IFPRI March 14 2013
2012 GFPR Launch at IFPRI March 14 2013
International Food Policy Research Institute (IFPRI)
 
monsanto 09-20-06
monsanto 09-20-06monsanto 09-20-06
monsanto 09-20-06
finance28
 
Sample 1
Sample 1Sample 1
Sample 1
Arnaud F
 
Rethinking US Agricultural Policy: Changing Course to Secure Farmer Livelihoo...
Rethinking US Agricultural Policy: Changing Course to Secure Farmer Livelihoo...Rethinking US Agricultural Policy: Changing Course to Secure Farmer Livelihoo...
Rethinking US Agricultural Policy: Changing Course to Secure Farmer Livelihoo...
National Family Farm Coalition
 
Wheat Research and Production in Sudan: Current Status and Trends
Wheat Research and Production in Sudan: Current Status and TrendsWheat Research and Production in Sudan: Current Status and Trends
Wheat Research and Production in Sudan: Current Status and Trends
CIMMYT
 
[Day 2] Center Presentation: ILRI
[Day 2] Center Presentation: ILRI[Day 2] Center Presentation: ILRI
[Day 2] Center Presentation: ILRI
csi2009
 
monsanto 01-24-05_low
monsanto 01-24-05_lowmonsanto 01-24-05_low
monsanto 01-24-05_low
finance28
 

What's hot (16)

Livestock in a Changing Landscape. Overview of Key Issues, Drivers, Consequen...
Livestock in a Changing Landscape. Overview of Key Issues, Drivers, Consequen...Livestock in a Changing Landscape. Overview of Key Issues, Drivers, Consequen...
Livestock in a Changing Landscape. Overview of Key Issues, Drivers, Consequen...
 
Presentation 4 q12
Presentation 4 q12Presentation 4 q12
Presentation 4 q12
 
Ag slides
Ag slidesAg slides
Ag slides
 
Expected us gdp growth rate presentation
Expected us gdp growth rate presentationExpected us gdp growth rate presentation
Expected us gdp growth rate presentation
 
A spatial analysis: creating similarity domains for targeted research sites i...
A spatial analysis: creating similarity domains for targeted research sites i...A spatial analysis: creating similarity domains for targeted research sites i...
A spatial analysis: creating similarity domains for targeted research sites i...
 
Mainstreaming agribusiness incubation for inclusive development
Mainstreaming agribusiness incubation for inclusive developmentMainstreaming agribusiness incubation for inclusive development
Mainstreaming agribusiness incubation for inclusive development
 
John Michael Staatz - Agricultural price volatility: causes, impacts & policy...
John Michael Staatz - Agricultural price volatility: causes, impacts & policy...John Michael Staatz - Agricultural price volatility: causes, impacts & policy...
John Michael Staatz - Agricultural price volatility: causes, impacts & policy...
 
AIIC approach to promote agribusiness in Africa
AIIC approach to promote agribusiness in AfricaAIIC approach to promote agribusiness in Africa
AIIC approach to promote agribusiness in Africa
 
Livestock production and poverty alleviation in arid and semi-arid tropica...
Livestock production and poverty alleviation in arid and semi-arid tropica...Livestock production and poverty alleviation in arid and semi-arid tropica...
Livestock production and poverty alleviation in arid and semi-arid tropica...
 
2012 GFPR Launch at IFPRI March 14 2013
2012 GFPR Launch at IFPRI March 14 20132012 GFPR Launch at IFPRI March 14 2013
2012 GFPR Launch at IFPRI March 14 2013
 
monsanto 09-20-06
monsanto 09-20-06monsanto 09-20-06
monsanto 09-20-06
 
Sample 1
Sample 1Sample 1
Sample 1
 
Rethinking US Agricultural Policy: Changing Course to Secure Farmer Livelihoo...
Rethinking US Agricultural Policy: Changing Course to Secure Farmer Livelihoo...Rethinking US Agricultural Policy: Changing Course to Secure Farmer Livelihoo...
Rethinking US Agricultural Policy: Changing Course to Secure Farmer Livelihoo...
 
Wheat Research and Production in Sudan: Current Status and Trends
Wheat Research and Production in Sudan: Current Status and TrendsWheat Research and Production in Sudan: Current Status and Trends
Wheat Research and Production in Sudan: Current Status and Trends
 
[Day 2] Center Presentation: ILRI
[Day 2] Center Presentation: ILRI[Day 2] Center Presentation: ILRI
[Day 2] Center Presentation: ILRI
 
monsanto 01-24-05_low
monsanto 01-24-05_lowmonsanto 01-24-05_low
monsanto 01-24-05_low
 

Similar to Pavel Vavra

Enhancing Resilience And Promoting Development In The Horn Of Africa
Enhancing Resilience And Promoting Development In The Horn Of AfricaEnhancing Resilience And Promoting Development In The Horn Of Africa
Enhancing Resilience And Promoting Development In The Horn Of Africa
essp2
 
Development strategies: middle income countries
Development strategies: middle income countriesDevelopment strategies: middle income countries
Development strategies: middle income countries
OECD Development Centre, Paris
 
Global business management - Topic 1: Global economy and international business
Global business management - Topic 1: Global economy and international businessGlobal business management - Topic 1: Global economy and international business
Global business management - Topic 1: Global economy and international business
Grenville Lannon
 
State of the World Economy
State of the World EconomyState of the World Economy
State of the World Economy
Private Healthcare Australia
 
Colin Welsh Presentation
Colin Welsh PresentationColin Welsh Presentation
Colin Welsh Presentation
AGCCevents
 
Meeting the Needs of South Africa’s Ag-Chem Market
Meeting the Needs of South Africa’s Ag-Chem MarketMeeting the Needs of South Africa’s Ag-Chem Market
Meeting the Needs of South Africa’s Ag-Chem Market
agbiz
 
EMERGING TRENDS and SCENARIOS for AFRICAN AGRICULTURE
EMERGING TRENDS and SCENARIOS for AFRICAN AGRICULTUREEMERGING TRENDS and SCENARIOS for AFRICAN AGRICULTURE
EMERGING TRENDS and SCENARIOS for AFRICAN AGRICULTURE
RUFORUM
 
Small famers and the supermarket revolution
Small famers and the supermarket revolution Small famers and the supermarket revolution
Small famers and the supermarket revolution
International Food Policy Research Institute (IFPRI)
 
Enhancing resilience and promoting development in the horn of africa
Enhancing resilience and promoting development in the horn of africa Enhancing resilience and promoting development in the horn of africa
Enhancing resilience and promoting development in the horn of africa
essp2
 
Poland Presentation
Poland PresentationPoland Presentation
Poland Presentation
kels
 
A Ringside View of the Pharma Industry by Ranjit Shahani
A Ringside View of the Pharma Industry by Ranjit ShahaniA Ringside View of the Pharma Industry by Ranjit Shahani
A Ringside View of the Pharma Industry by Ranjit Shahani
VALUExIndia
 
International Pensions & Population Growth
International Pensions & Population GrowthInternational Pensions & Population Growth
International Pensions & Population Growth
Open Knowledge
 
ReSAKSS Regional Analysis on Agricultural Expenditures and Agricultural Polic...
ReSAKSS Regional Analysis on Agricultural Expenditures and Agricultural Polic...ReSAKSS Regional Analysis on Agricultural Expenditures and Agricultural Polic...
ReSAKSS Regional Analysis on Agricultural Expenditures and Agricultural Polic...
African Regional Strategic Analysis and Knowledge Support System (ReSAKSS)
 
20 lilyan fulginiti
20   lilyan fulginiti20   lilyan fulginiti
20 lilyan fulginiti
jillbrown14
 
Agriculture renaissance 2010
Agriculture renaissance 2010Agriculture renaissance 2010
Agriculture renaissance 2010
Prabhu Pingali
 
Engineering Food and Cash from Cassava (EFCC):for sustainable rural developme...
Engineering Food and Cash from Cassava (EFCC):for sustainable rural developme...Engineering Food and Cash from Cassava (EFCC):for sustainable rural developme...
Engineering Food and Cash from Cassava (EFCC):for sustainable rural developme...
International Institute of Tropical Agriculture
 
Discovery of Crude Oil in Nigeria; A Blessing or a Curse
Discovery of Crude Oil in Nigeria; A Blessing or a CurseDiscovery of Crude Oil in Nigeria; A Blessing or a Curse
Discovery of Crude Oil in Nigeria; A Blessing or a Curse
bolawafadoju
 
Indonesia’S Agriculture Sector Development
Indonesia’S Agriculture Sector DevelopmentIndonesia’S Agriculture Sector Development
Indonesia’S Agriculture Sector Development
edunetwork
 
EU agricultural trade policy and agricultural trade with developing countries
EU agricultural trade policy and agricultural trade with developing countriesEU agricultural trade policy and agricultural trade with developing countries
EU agricultural trade policy and agricultural trade with developing countries
International Food Policy Research Institute (IFPRI)
 
Fifty Years of Distortions in Worls Food Markets
Fifty Years of Distortions in Worls Food Markets Fifty Years of Distortions in Worls Food Markets
Fifty Years of Distortions in Worls Food Markets
International Food Policy Research Institute (IFPRI)
 

Similar to Pavel Vavra (20)

Enhancing Resilience And Promoting Development In The Horn Of Africa
Enhancing Resilience And Promoting Development In The Horn Of AfricaEnhancing Resilience And Promoting Development In The Horn Of Africa
Enhancing Resilience And Promoting Development In The Horn Of Africa
 
Development strategies: middle income countries
Development strategies: middle income countriesDevelopment strategies: middle income countries
Development strategies: middle income countries
 
Global business management - Topic 1: Global economy and international business
Global business management - Topic 1: Global economy and international businessGlobal business management - Topic 1: Global economy and international business
Global business management - Topic 1: Global economy and international business
 
State of the World Economy
State of the World EconomyState of the World Economy
State of the World Economy
 
Colin Welsh Presentation
Colin Welsh PresentationColin Welsh Presentation
Colin Welsh Presentation
 
Meeting the Needs of South Africa’s Ag-Chem Market
Meeting the Needs of South Africa’s Ag-Chem MarketMeeting the Needs of South Africa’s Ag-Chem Market
Meeting the Needs of South Africa’s Ag-Chem Market
 
EMERGING TRENDS and SCENARIOS for AFRICAN AGRICULTURE
EMERGING TRENDS and SCENARIOS for AFRICAN AGRICULTUREEMERGING TRENDS and SCENARIOS for AFRICAN AGRICULTURE
EMERGING TRENDS and SCENARIOS for AFRICAN AGRICULTURE
 
Small famers and the supermarket revolution
Small famers and the supermarket revolution Small famers and the supermarket revolution
Small famers and the supermarket revolution
 
Enhancing resilience and promoting development in the horn of africa
Enhancing resilience and promoting development in the horn of africa Enhancing resilience and promoting development in the horn of africa
Enhancing resilience and promoting development in the horn of africa
 
Poland Presentation
Poland PresentationPoland Presentation
Poland Presentation
 
A Ringside View of the Pharma Industry by Ranjit Shahani
A Ringside View of the Pharma Industry by Ranjit ShahaniA Ringside View of the Pharma Industry by Ranjit Shahani
A Ringside View of the Pharma Industry by Ranjit Shahani
 
International Pensions & Population Growth
International Pensions & Population GrowthInternational Pensions & Population Growth
International Pensions & Population Growth
 
ReSAKSS Regional Analysis on Agricultural Expenditures and Agricultural Polic...
ReSAKSS Regional Analysis on Agricultural Expenditures and Agricultural Polic...ReSAKSS Regional Analysis on Agricultural Expenditures and Agricultural Polic...
ReSAKSS Regional Analysis on Agricultural Expenditures and Agricultural Polic...
 
20 lilyan fulginiti
20   lilyan fulginiti20   lilyan fulginiti
20 lilyan fulginiti
 
Agriculture renaissance 2010
Agriculture renaissance 2010Agriculture renaissance 2010
Agriculture renaissance 2010
 
Engineering Food and Cash from Cassava (EFCC):for sustainable rural developme...
Engineering Food and Cash from Cassava (EFCC):for sustainable rural developme...Engineering Food and Cash from Cassava (EFCC):for sustainable rural developme...
Engineering Food and Cash from Cassava (EFCC):for sustainable rural developme...
 
Discovery of Crude Oil in Nigeria; A Blessing or a Curse
Discovery of Crude Oil in Nigeria; A Blessing or a CurseDiscovery of Crude Oil in Nigeria; A Blessing or a Curse
Discovery of Crude Oil in Nigeria; A Blessing or a Curse
 
Indonesia’S Agriculture Sector Development
Indonesia’S Agriculture Sector DevelopmentIndonesia’S Agriculture Sector Development
Indonesia’S Agriculture Sector Development
 
EU agricultural trade policy and agricultural trade with developing countries
EU agricultural trade policy and agricultural trade with developing countriesEU agricultural trade policy and agricultural trade with developing countries
EU agricultural trade policy and agricultural trade with developing countries
 
Fifty Years of Distortions in Worls Food Markets
Fifty Years of Distortions in Worls Food Markets Fifty Years of Distortions in Worls Food Markets
Fifty Years of Distortions in Worls Food Markets
 

More from cropprotection

Chris Lythgo - Semiochemicals: Current review programme - initial comments an...
Chris Lythgo - Semiochemicals: Current review programme - initial comments an...Chris Lythgo - Semiochemicals: Current review programme - initial comments an...
Chris Lythgo - Semiochemicals: Current review programme - initial comments an...
cropprotection
 
Csaba Szentes - Micro-organisms: Part II: E-fate and ecotox
Csaba Szentes - Micro-organisms: Part II: E-fate and ecotoxCsaba Szentes - Micro-organisms: Part II: E-fate and ecotox
Csaba Szentes - Micro-organisms: Part II: E-fate and ecotox
cropprotection
 
Danièle Court Marques - Microorganisms - Part I: Toxicological Aspects
Danièle Court Marques - Microorganisms - Part I: Toxicological AspectsDanièle Court Marques - Microorganisms - Part I: Toxicological Aspects
Danièle Court Marques - Microorganisms - Part I: Toxicological Aspects
cropprotection
 
Stephanie Bopp - GD on aquatic ecotoxicology
Stephanie Bopp - GD on aquatic ecotoxicologyStephanie Bopp - GD on aquatic ecotoxicology
Stephanie Bopp - GD on aquatic ecotoxicology
cropprotection
 
Franz Streissl - Bee risk assessment
Franz Streissl - Bee risk assessmentFranz Streissl - Bee risk assessment
Franz Streissl - Bee risk assessment
cropprotection
 
Franz Streissl - The revision of the GD on terrestrial ecotoxicology
Franz Streissl - The revision of the GD on terrestrial ecotoxicologyFranz Streissl - The revision of the GD on terrestrial ecotoxicology
Franz Streissl - The revision of the GD on terrestrial ecotoxicology
cropprotection
 
Oriol Magrans - Environmental fate
Oriol Magrans - Environmental fateOriol Magrans - Environmental fate
Oriol Magrans - Environmental fate
cropprotection
 
Luc Mohimont - Probabilistic risk assessment
Luc Mohimont - Probabilistic risk assessmentLuc Mohimont - Probabilistic risk assessment
Luc Mohimont - Probabilistic risk assessment
cropprotection
 
Istvan Sebestyen - Cumulative risk-assessment
Istvan Sebestyen - Cumulative risk-assessmentIstvan Sebestyen - Cumulative risk-assessment
Istvan Sebestyen - Cumulative risk-assessment
cropprotection
 
Hans Steinkellner - Metabolites for dietary risk assessment
Hans Steinkellner - Metabolites for dietary risk assessmentHans Steinkellner - Metabolites for dietary risk assessment
Hans Steinkellner - Metabolites for dietary risk assessment
cropprotection
 
Istvan Sebestyen - Workers operators bystanders and residents
Istvan Sebestyen - Workers operators bystanders and residentsIstvan Sebestyen - Workers operators bystanders and residents
Istvan Sebestyen - Workers operators bystanders and residents
cropprotection
 
Wolfgang Reinert - Guidance on guidance document development
Wolfgang Reinert - Guidance on guidance document developmentWolfgang Reinert - Guidance on guidance document development
Wolfgang Reinert - Guidance on guidance document development
cropprotection
 
Luc Mohimont - Priorities of the PPR panel
Luc Mohimont - Priorities of the PPR panelLuc Mohimont - Priorities of the PPR panel
Luc Mohimont - Priorities of the PPR panel
cropprotection
 
Aija Kazocina - Update on risk assessment of MRLs
Aija Kazocina - Update on risk assessment of MRLsAija Kazocina - Update on risk assessment of MRLs
Aija Kazocina - Update on risk assessment of MRLs
cropprotection
 
Daniela Brocca - Pesticide residues in food: Monitoring programmes in Europe ...
Daniela Brocca - Pesticide residues in food: Monitoring programmes in Europe ...Daniela Brocca - Pesticide residues in food: Monitoring programmes in Europe ...
Daniela Brocca - Pesticide residues in food: Monitoring programmes in Europe ...
cropprotection
 
IBMA input and EFSA/PSC response at industry meeting April 2012
IBMA input and EFSA/PSC response at industry meeting April 2012IBMA input and EFSA/PSC response at industry meeting April 2012
IBMA input and EFSA/PSC response at industry meeting April 2012
cropprotection
 
Herman Fontier - Update on the evaluation of active substances
Herman Fontier - Update on the evaluation of active substancesHerman Fontier - Update on the evaluation of active substances
Herman Fontier - Update on the evaluation of active substances
cropprotection
 
Per Bergman - EFSA general priorities
Per Bergman - EFSA general prioritiesPer Bergman - EFSA general priorities
Per Bergman - EFSA general priorities
cropprotection
 
J.P Busnardo - ECPA industry feedback
J.P Busnardo - ECPA industry feedbackJ.P Busnardo - ECPA industry feedback
J.P Busnardo - ECPA industry feedback
cropprotection
 
Jeff Pim - Botanicals
Jeff Pim - BotanicalsJeff Pim - Botanicals
Jeff Pim - Botanicals
cropprotection
 

More from cropprotection (20)

Chris Lythgo - Semiochemicals: Current review programme - initial comments an...
Chris Lythgo - Semiochemicals: Current review programme - initial comments an...Chris Lythgo - Semiochemicals: Current review programme - initial comments an...
Chris Lythgo - Semiochemicals: Current review programme - initial comments an...
 
Csaba Szentes - Micro-organisms: Part II: E-fate and ecotox
Csaba Szentes - Micro-organisms: Part II: E-fate and ecotoxCsaba Szentes - Micro-organisms: Part II: E-fate and ecotox
Csaba Szentes - Micro-organisms: Part II: E-fate and ecotox
 
Danièle Court Marques - Microorganisms - Part I: Toxicological Aspects
Danièle Court Marques - Microorganisms - Part I: Toxicological AspectsDanièle Court Marques - Microorganisms - Part I: Toxicological Aspects
Danièle Court Marques - Microorganisms - Part I: Toxicological Aspects
 
Stephanie Bopp - GD on aquatic ecotoxicology
Stephanie Bopp - GD on aquatic ecotoxicologyStephanie Bopp - GD on aquatic ecotoxicology
Stephanie Bopp - GD on aquatic ecotoxicology
 
Franz Streissl - Bee risk assessment
Franz Streissl - Bee risk assessmentFranz Streissl - Bee risk assessment
Franz Streissl - Bee risk assessment
 
Franz Streissl - The revision of the GD on terrestrial ecotoxicology
Franz Streissl - The revision of the GD on terrestrial ecotoxicologyFranz Streissl - The revision of the GD on terrestrial ecotoxicology
Franz Streissl - The revision of the GD on terrestrial ecotoxicology
 
Oriol Magrans - Environmental fate
Oriol Magrans - Environmental fateOriol Magrans - Environmental fate
Oriol Magrans - Environmental fate
 
Luc Mohimont - Probabilistic risk assessment
Luc Mohimont - Probabilistic risk assessmentLuc Mohimont - Probabilistic risk assessment
Luc Mohimont - Probabilistic risk assessment
 
Istvan Sebestyen - Cumulative risk-assessment
Istvan Sebestyen - Cumulative risk-assessmentIstvan Sebestyen - Cumulative risk-assessment
Istvan Sebestyen - Cumulative risk-assessment
 
Hans Steinkellner - Metabolites for dietary risk assessment
Hans Steinkellner - Metabolites for dietary risk assessmentHans Steinkellner - Metabolites for dietary risk assessment
Hans Steinkellner - Metabolites for dietary risk assessment
 
Istvan Sebestyen - Workers operators bystanders and residents
Istvan Sebestyen - Workers operators bystanders and residentsIstvan Sebestyen - Workers operators bystanders and residents
Istvan Sebestyen - Workers operators bystanders and residents
 
Wolfgang Reinert - Guidance on guidance document development
Wolfgang Reinert - Guidance on guidance document developmentWolfgang Reinert - Guidance on guidance document development
Wolfgang Reinert - Guidance on guidance document development
 
Luc Mohimont - Priorities of the PPR panel
Luc Mohimont - Priorities of the PPR panelLuc Mohimont - Priorities of the PPR panel
Luc Mohimont - Priorities of the PPR panel
 
Aija Kazocina - Update on risk assessment of MRLs
Aija Kazocina - Update on risk assessment of MRLsAija Kazocina - Update on risk assessment of MRLs
Aija Kazocina - Update on risk assessment of MRLs
 
Daniela Brocca - Pesticide residues in food: Monitoring programmes in Europe ...
Daniela Brocca - Pesticide residues in food: Monitoring programmes in Europe ...Daniela Brocca - Pesticide residues in food: Monitoring programmes in Europe ...
Daniela Brocca - Pesticide residues in food: Monitoring programmes in Europe ...
 
IBMA input and EFSA/PSC response at industry meeting April 2012
IBMA input and EFSA/PSC response at industry meeting April 2012IBMA input and EFSA/PSC response at industry meeting April 2012
IBMA input and EFSA/PSC response at industry meeting April 2012
 
Herman Fontier - Update on the evaluation of active substances
Herman Fontier - Update on the evaluation of active substancesHerman Fontier - Update on the evaluation of active substances
Herman Fontier - Update on the evaluation of active substances
 
Per Bergman - EFSA general priorities
Per Bergman - EFSA general prioritiesPer Bergman - EFSA general priorities
Per Bergman - EFSA general priorities
 
J.P Busnardo - ECPA industry feedback
J.P Busnardo - ECPA industry feedbackJ.P Busnardo - ECPA industry feedback
J.P Busnardo - ECPA industry feedback
 
Jeff Pim - Botanicals
Jeff Pim - BotanicalsJeff Pim - Botanicals
Jeff Pim - Botanicals
 

Recently uploaded

Industrial Tech SW: Category Renewal and Creation
Industrial Tech SW:  Category Renewal and CreationIndustrial Tech SW:  Category Renewal and Creation
Industrial Tech SW: Category Renewal and Creation
Christian Dahlen
 
Profiles of Iconic Fashion Personalities.pdf
Profiles of Iconic Fashion Personalities.pdfProfiles of Iconic Fashion Personalities.pdf
Profiles of Iconic Fashion Personalities.pdf
TTop Threads
 
Call8328958814 satta matka Kalyan result satta guessing
Call8328958814 satta matka Kalyan result satta guessingCall8328958814 satta matka Kalyan result satta guessing
Call8328958814 satta matka Kalyan result satta guessing
➑➌➋➑➒➎➑➑➊➍
 
Maksym Vyshnivetskyi: PMO KPIs (UA) (#12)
Maksym Vyshnivetskyi: PMO KPIs (UA) (#12)Maksym Vyshnivetskyi: PMO KPIs (UA) (#12)
Maksym Vyshnivetskyi: PMO KPIs (UA) (#12)
Lviv Startup Club
 
Zodiac Signs and Food Preferences_ What Your Sign Says About Your Taste
Zodiac Signs and Food Preferences_ What Your Sign Says About Your TasteZodiac Signs and Food Preferences_ What Your Sign Says About Your Taste
Zodiac Signs and Food Preferences_ What Your Sign Says About Your Taste
my Pandit
 
Brian Fitzsimmons on the Business Strategy and Content Flywheel of Barstool S...
Brian Fitzsimmons on the Business Strategy and Content Flywheel of Barstool S...Brian Fitzsimmons on the Business Strategy and Content Flywheel of Barstool S...
Brian Fitzsimmons on the Business Strategy and Content Flywheel of Barstool S...
Neil Horowitz
 
Unveiling the Dynamic Personalities, Key Dates, and Horoscope Insights: Gemin...
Unveiling the Dynamic Personalities, Key Dates, and Horoscope Insights: Gemin...Unveiling the Dynamic Personalities, Key Dates, and Horoscope Insights: Gemin...
Unveiling the Dynamic Personalities, Key Dates, and Horoscope Insights: Gemin...
my Pandit
 
The Most Inspiring Entrepreneurs to Follow in 2024.pdf
The Most Inspiring Entrepreneurs to Follow in 2024.pdfThe Most Inspiring Entrepreneurs to Follow in 2024.pdf
The Most Inspiring Entrepreneurs to Follow in 2024.pdf
thesiliconleaders
 
The Genesis of BriansClub.cm Famous Dark WEb Platform
The Genesis of BriansClub.cm Famous Dark WEb PlatformThe Genesis of BriansClub.cm Famous Dark WEb Platform
The Genesis of BriansClub.cm Famous Dark WEb Platform
SabaaSudozai
 
2022 Vintage Roman Numerals Men Rings
2022 Vintage Roman  Numerals  Men  Rings2022 Vintage Roman  Numerals  Men  Rings
2022 Vintage Roman Numerals Men Rings
aragme
 
2024-6-01-IMPACTSilver-Corp-Presentation.pdf
2024-6-01-IMPACTSilver-Corp-Presentation.pdf2024-6-01-IMPACTSilver-Corp-Presentation.pdf
2024-6-01-IMPACTSilver-Corp-Presentation.pdf
hartfordclub1
 
Business storytelling: key ingredients to a story
Business storytelling: key ingredients to a storyBusiness storytelling: key ingredients to a story
Business storytelling: key ingredients to a story
Alexandra Fulford
 
Best practices for project execution and delivery
Best practices for project execution and deliveryBest practices for project execution and delivery
Best practices for project execution and delivery
CLIVE MINCHIN
 
Digital Marketing with a Focus on Sustainability
Digital Marketing with a Focus on SustainabilityDigital Marketing with a Focus on Sustainability
Digital Marketing with a Focus on Sustainability
sssourabhsharma
 
DearbornMusic-KatherineJasperFullSailUni
DearbornMusic-KatherineJasperFullSailUniDearbornMusic-KatherineJasperFullSailUni
DearbornMusic-KatherineJasperFullSailUni
katiejasper96
 
Income Tax exemption for Start up : Section 80 IAC
Income Tax  exemption for Start up : Section 80 IACIncome Tax  exemption for Start up : Section 80 IAC
Income Tax exemption for Start up : Section 80 IAC
CA Dr. Prithvi Ranjan Parhi
 
Dpboss Matka Guessing Satta Matta Matka Kalyan Chart Indian Matka
Dpboss Matka Guessing Satta Matta Matka Kalyan Chart Indian MatkaDpboss Matka Guessing Satta Matta Matka Kalyan Chart Indian Matka
Dpboss Matka Guessing Satta Matta Matka Kalyan Chart Indian Matka
➒➌➎➏➑➐➋➑➐➐Dpboss Matka Guessing Satta Matka Kalyan Chart Indian Matka
 
Observation Lab PowerPoint Assignment for TEM 431
Observation Lab PowerPoint Assignment for TEM 431Observation Lab PowerPoint Assignment for TEM 431
Observation Lab PowerPoint Assignment for TEM 431
ecamare2
 
❼❷⓿❺❻❷❽❷❼❽ Dpboss Matka Result Satta Matka Guessing Satta Fix jodi Kalyan Fin...
❼❷⓿❺❻❷❽❷❼❽ Dpboss Matka Result Satta Matka Guessing Satta Fix jodi Kalyan Fin...❼❷⓿❺❻❷❽❷❼❽ Dpboss Matka Result Satta Matka Guessing Satta Fix jodi Kalyan Fin...
❼❷⓿❺❻❷❽❷❼❽ Dpboss Matka Result Satta Matka Guessing Satta Fix jodi Kalyan Fin...
❼❷⓿❺❻❷❽❷❼❽ Dpboss Kalyan Satta Matka Guessing Matka Result Main Bazar chart
 
Satta Matka Dpboss Matka Guessing Kalyan Chart Indian Matka Kalyan panel Chart
Satta Matka Dpboss Matka Guessing Kalyan Chart Indian Matka Kalyan panel ChartSatta Matka Dpboss Matka Guessing Kalyan Chart Indian Matka Kalyan panel Chart
Satta Matka Dpboss Matka Guessing Kalyan Chart Indian Matka Kalyan panel Chart
➒➌➎➏➑➐➋➑➐➐Dpboss Matka Guessing Satta Matka Kalyan Chart Indian Matka
 

Recently uploaded (20)

Industrial Tech SW: Category Renewal and Creation
Industrial Tech SW:  Category Renewal and CreationIndustrial Tech SW:  Category Renewal and Creation
Industrial Tech SW: Category Renewal and Creation
 
Profiles of Iconic Fashion Personalities.pdf
Profiles of Iconic Fashion Personalities.pdfProfiles of Iconic Fashion Personalities.pdf
Profiles of Iconic Fashion Personalities.pdf
 
Call8328958814 satta matka Kalyan result satta guessing
Call8328958814 satta matka Kalyan result satta guessingCall8328958814 satta matka Kalyan result satta guessing
Call8328958814 satta matka Kalyan result satta guessing
 
Maksym Vyshnivetskyi: PMO KPIs (UA) (#12)
Maksym Vyshnivetskyi: PMO KPIs (UA) (#12)Maksym Vyshnivetskyi: PMO KPIs (UA) (#12)
Maksym Vyshnivetskyi: PMO KPIs (UA) (#12)
 
Zodiac Signs and Food Preferences_ What Your Sign Says About Your Taste
Zodiac Signs and Food Preferences_ What Your Sign Says About Your TasteZodiac Signs and Food Preferences_ What Your Sign Says About Your Taste
Zodiac Signs and Food Preferences_ What Your Sign Says About Your Taste
 
Brian Fitzsimmons on the Business Strategy and Content Flywheel of Barstool S...
Brian Fitzsimmons on the Business Strategy and Content Flywheel of Barstool S...Brian Fitzsimmons on the Business Strategy and Content Flywheel of Barstool S...
Brian Fitzsimmons on the Business Strategy and Content Flywheel of Barstool S...
 
Unveiling the Dynamic Personalities, Key Dates, and Horoscope Insights: Gemin...
Unveiling the Dynamic Personalities, Key Dates, and Horoscope Insights: Gemin...Unveiling the Dynamic Personalities, Key Dates, and Horoscope Insights: Gemin...
Unveiling the Dynamic Personalities, Key Dates, and Horoscope Insights: Gemin...
 
The Most Inspiring Entrepreneurs to Follow in 2024.pdf
The Most Inspiring Entrepreneurs to Follow in 2024.pdfThe Most Inspiring Entrepreneurs to Follow in 2024.pdf
The Most Inspiring Entrepreneurs to Follow in 2024.pdf
 
The Genesis of BriansClub.cm Famous Dark WEb Platform
The Genesis of BriansClub.cm Famous Dark WEb PlatformThe Genesis of BriansClub.cm Famous Dark WEb Platform
The Genesis of BriansClub.cm Famous Dark WEb Platform
 
2022 Vintage Roman Numerals Men Rings
2022 Vintage Roman  Numerals  Men  Rings2022 Vintage Roman  Numerals  Men  Rings
2022 Vintage Roman Numerals Men Rings
 
2024-6-01-IMPACTSilver-Corp-Presentation.pdf
2024-6-01-IMPACTSilver-Corp-Presentation.pdf2024-6-01-IMPACTSilver-Corp-Presentation.pdf
2024-6-01-IMPACTSilver-Corp-Presentation.pdf
 
Business storytelling: key ingredients to a story
Business storytelling: key ingredients to a storyBusiness storytelling: key ingredients to a story
Business storytelling: key ingredients to a story
 
Best practices for project execution and delivery
Best practices for project execution and deliveryBest practices for project execution and delivery
Best practices for project execution and delivery
 
Digital Marketing with a Focus on Sustainability
Digital Marketing with a Focus on SustainabilityDigital Marketing with a Focus on Sustainability
Digital Marketing with a Focus on Sustainability
 
DearbornMusic-KatherineJasperFullSailUni
DearbornMusic-KatherineJasperFullSailUniDearbornMusic-KatherineJasperFullSailUni
DearbornMusic-KatherineJasperFullSailUni
 
Income Tax exemption for Start up : Section 80 IAC
Income Tax  exemption for Start up : Section 80 IACIncome Tax  exemption for Start up : Section 80 IAC
Income Tax exemption for Start up : Section 80 IAC
 
Dpboss Matka Guessing Satta Matta Matka Kalyan Chart Indian Matka
Dpboss Matka Guessing Satta Matta Matka Kalyan Chart Indian MatkaDpboss Matka Guessing Satta Matta Matka Kalyan Chart Indian Matka
Dpboss Matka Guessing Satta Matta Matka Kalyan Chart Indian Matka
 
Observation Lab PowerPoint Assignment for TEM 431
Observation Lab PowerPoint Assignment for TEM 431Observation Lab PowerPoint Assignment for TEM 431
Observation Lab PowerPoint Assignment for TEM 431
 
❼❷⓿❺❻❷❽❷❼❽ Dpboss Matka Result Satta Matka Guessing Satta Fix jodi Kalyan Fin...
❼❷⓿❺❻❷❽❷❼❽ Dpboss Matka Result Satta Matka Guessing Satta Fix jodi Kalyan Fin...❼❷⓿❺❻❷❽❷❼❽ Dpboss Matka Result Satta Matka Guessing Satta Fix jodi Kalyan Fin...
❼❷⓿❺❻❷❽❷❼❽ Dpboss Matka Result Satta Matka Guessing Satta Fix jodi Kalyan Fin...
 
Satta Matka Dpboss Matka Guessing Kalyan Chart Indian Matka Kalyan panel Chart
Satta Matka Dpboss Matka Guessing Kalyan Chart Indian Matka Kalyan panel ChartSatta Matka Dpboss Matka Guessing Kalyan Chart Indian Matka Kalyan panel Chart
Satta Matka Dpboss Matka Guessing Kalyan Chart Indian Matka Kalyan panel Chart
 

Pavel Vavra

  • 1. OECD‐ OECD‐FAO Agricultural Outlook  2011‐2020 Agricultural Outlook  2011‐ Pavel Vavra OECD Trade and Agriculture The Outlook for EU Agriculture, COPA-COGECA, Brussels, 29 June, 2011 OECD-FAO Agricultural Outlook • Agricultural Outlook ‐ a set of  conditional projections  published in an OECD‐FAO  bli h d i OECD FAO annual report  • Comprehensive, dynamic partial  equilibrium model • The datasets are available at  www.agri‐outlook.org  i tl k OECD Trade & Agriculture 2 1
  • 2. Key macroeconomic assumptions • Global economic recovery underway (fragile in OECD, but more robust in BRICs) • 2.2% Inflation in OECD area but higher elsewhere • Weak US dollar and higher oil prices • Stable policy regimes OECD Trade & Agriculture 3 Slowdown in population growth Annual percentage change OECD Trade & Agriculture 4 2
  • 3. Urbanisation – a key driver Rural Population Urban Population 9000 8000 7000 • Rural population numbers are 6000 expected to stagnate. ons 5000 Millio 4000 • All additional population is to 3000 live in urban areas 2000 1000 0 1965 1970 1975 1980 1985 1990 1995 2000 2005 2010 2015 2020 4500 4000 3500 • Move to urban areas to take 3000 Millions 2500 place mainly in developing 2000 countries 1500 1000 500 0 1965 1970 1975 1980 1985 1990 1995 2000 2005 2010 2015 2020 Developed urban Developing Urban OECD Trade & Agriculture 5 World oil prices to remain relatively high USD/Barrel 120 100 80 60 40 20 0 1985 1990 1995 2000 2005 2010 2015 2020 OECD Trade & Agriculture 6 3
  • 4. Main commodity projections • Commodity prices in real terms to remain above last decade average levels – Income, population and biofuels growth – Higher cost structure • Latin America and Eastern Europe are the fastest growing production regions • Developing countries driving the global demand and trade gains • G Growing food deficits expected in Sub-Saharan countries i f d d fi it t di S bS h ti • Meat, dairy products, vegetable oils and sugar should experience the highest increases in demand OECD Trade & Agriculture 7 Most commodity prices at higher average levels Percentage change in world prices in real terms relative to 2001-2010 base 60 50 40 30 20 10 0 -10 OECD Trade & Agriculture 8 4
  • 5. Production shifts to developing countries Share of global agricultural and fish production gains Production gains between 2008/10 - 2020 valued at world reference prices (2004/06) N.America 10% Oceania 2% L.America 21% Asia&Pacific 45% W.Europe 3% E.Europe&C.Asia 7% N.Africa&M.East S.S.Africa 3% 9% 0-15% over the decade 15-30% over the decade +30% over the decade OECD Trade & Agriculture 9 Production shifts to developing countries Share of global agricultural and fish production gains Sugar, vegetable oil and poultry production Production gains between 2008/10 - 2020 valued at world reference prices (2004/06) are expected to record the highest growths SMP WMP N.America 10% Cheese Butter Oceania 2% Poultry Pigmeat L.America Beef 21% Asia&Pacific 45% Fish Sugar W.Europe 3% Veget. Oils E.Europe&C.Asia EE &C A i Protein meals 7% Oilseeds N.Africa&M.East S.S.Africa 3% 9% Rice Coarse grains 0-15% over the decade 15-30% over the decade +30% over the decade Wheat 0 10 20 30 40 Per cent change: 2020 compared to 2008-2010 average OECD Trade & Agriculture 10 5
  • 6. Large differences in milk production gains OECD Trade & Agriculture 11 Fish production growth driven by aquaculture Capture Aquaculture Million tonnes 180 160 140 120 100 80 60 40 20 0 2000 2002 2004 2006 2008 2010 2012 2014 2016 2018 2020 OECD Trade & Agriculture 12 6
  • 7. Ethanol production growing steadily Feedstocks used for ethanol production over the projection period 160 140 Other 120 Sugar beet 100 Non agricultural feedstock 80 Molasse 60 Wheat 40 Biomass-based Sugar Cane 20 Coarse grains - Bnl 2008- 2011 2012 2013 2014 2015 2016 2017 2018 2019 2020 2010 OECD Trade & Agriculture 13 Strong growth of global biodiesel production Feedstocks used for biodiesel production over the projection period Bnl 40 Jatropha 35 30 Non 25 agricultural feedstock 20 Biomass- based 15 10 Vegetable oil 5 - 2008-2010011 2012 2013 2014 2015 2016 2017 2018 2019 2020 2 OECD Trade & Agriculture 14 7
  • 8. Biofuels production represents an important share of global feedstock utilisation Share of feedstocks used for biofuel production from global production 2020 2008‐2010 Percent 35% 30% 25% 20% 15% + 90 Mt 10% 5% 0% Sugar cane Vegetable oil Coarse Grains Sugar beet Wheat OECD Trade & Agriculture 15 Food remains the main driver for wheat Food Use Feed Use Biofuel Use Other use Developing 2008/10 + 34 Mt Developing 2020 Developed 2008/10 Developed 2020 0 100 200 300 400 500 Million tonnes World 2008/10 World 2020 0 200 400 600 800 OECD Trade & Agriculture 16 8
  • 9. …while feed and fuel push coarse grain demand up Food Use Feed Use Biofuel Use Other use Developing 2008/10 Developing 2020 + 50 Mt + 50 Mt Developed 2008/10 Developed 2020 0 100 200 300 400 500 600 700 800 Million tonnes + 90 Mt World 2008/10 World 2020 0 200 400 600 800 1 000 1 200 1 400 OECD Trade & Agriculture 17 Driven by economic growth, meat consumption increases especially in developing countries Consumption of meat from 2008-10 average to 2020, per cent World Developing/Developed Developing Beef Developed D l d Pork Poultry Sheep 0 10 20 30 40 0 10 20 30 40 OECD Trade & Agriculture 18 9
  • 10. Outlook for dairy products consumption Butter Cheese SMP WMP OECD Trade & Agriculture 19 Per capita consumption evolution differs by product Per capita consumption of WMP Per capita consumption of cheese OECD Trade & Agriculture 20 10
  • 11. Global trade to grow by 10-30% Imports : Share of the import gains Vegetable oils, rice and SMP trade growing the fastest N.America 10% Oceania L.America SMP 1% Asia&Pacif 9% WMP ic Cheese 37% Butter W.Europe 15% poultry E.Europe& C.Asia Pigmeat S.S.Africa N.Africa& 4% Beef 9% M.East 15% Fish Exports: Share of the export gains Sugar N.America 13% Veget. Oils Oceania 4% Protein meals Oilseeds Asia&Paci fic 38% L.America Rice 27% Coarse grains S.S.Africa Wheat ‐1% E.Europe W.Europe 0 10 20 30 40 N.Africa& &C.Asia 6% M.East Per cent change 2020 compared to 2008-2010 average 11% 0% OECD Trade & Agriculture 21 Sugar exports remain highly concentrated and lead by Brazil 2008‐10 2020 Million tonnes r.s.e . 70 60 50 40 30 20 10 0 World Brazil Thailand Australia Mexico India South  Africa OECD Trade & Agriculture 22 11
  • 12. While sugar imports are more diversified OECD Emerging economies Million tonnes r.s.e. Million tonnes r.s.e. 6 6 5 5 4 4 3 3 2 2 1 1 0 0 European  United  Korea Japan China Indonesia Russia India Union States 2008‐10 2020 OECD Trade & Agriculture 23 Stochastic analysis of projected agricultural production Impact on world coarse grain prices • Monte Carlo simulations on yields, oil and fertiliser prices, macroeconomic variables. • 500 model runs show more upside potential for world coarse grains prices 10% percentile baseline median 90th percentile USD/t 350 300 250 200 150 100 50 0 1975 1980 1985 1990 1995 2000 2005 2010 2015 2020 OECD Trade & Agriculture 24 12
  • 13. Key Market Drivers Income changes impact mainly demand for meat and dairy products 1 % additional income growth p.a. 1% less income growth p.a. beef and veal sheep meat cheese butter sugar poultry meat whole milk powder whole milk powder pork coarse grains wheat vegetable oil rice ‐2,5% ‐2,0% ‐1,5% ‐1,0% ‐0,5% 0,0% 0,5% 1,0% 1,5% 2,0% 2,5% Impact of a 1% increase/decrease of annual GDP growth on global commodity consumption (average over projection period) Yield growth and changes have important impact on global commodity prices yields increase by 5% yields decrease by 5% wheat i rice coarse grains protein meals poultry meat oilseeds ‐30% ‐20% ‐10% 0% 10% 20% 30% Impact of 5% increase/decrease in yields of cereals on world commodity prices (average over projection period) OECD Trade & Agriculture 25 Key Market Drivers • Demand growth – above all in developing countries • C Convergence i consumption in ti patterns • Developing countries raise meat consumption • Increased health and nutrition concerns • Supply adjusting to higher production costs • International investment OECD Trade & Agriculture 26 13
  • 14. Key issues and uncertainties • Traditional uncertainties: – Weather and economic stability – Developments in trade and domestic policies • Biofuels policies and biofuel developments • Food security and climate change • Increased price volatility OECD Trade & Agriculture 27 OECD Trade and Agriculture www.oecd.org/agriculture Contact tad.contact@oecd.org OECD Trade & Agriculture 28 14