Download to read offline

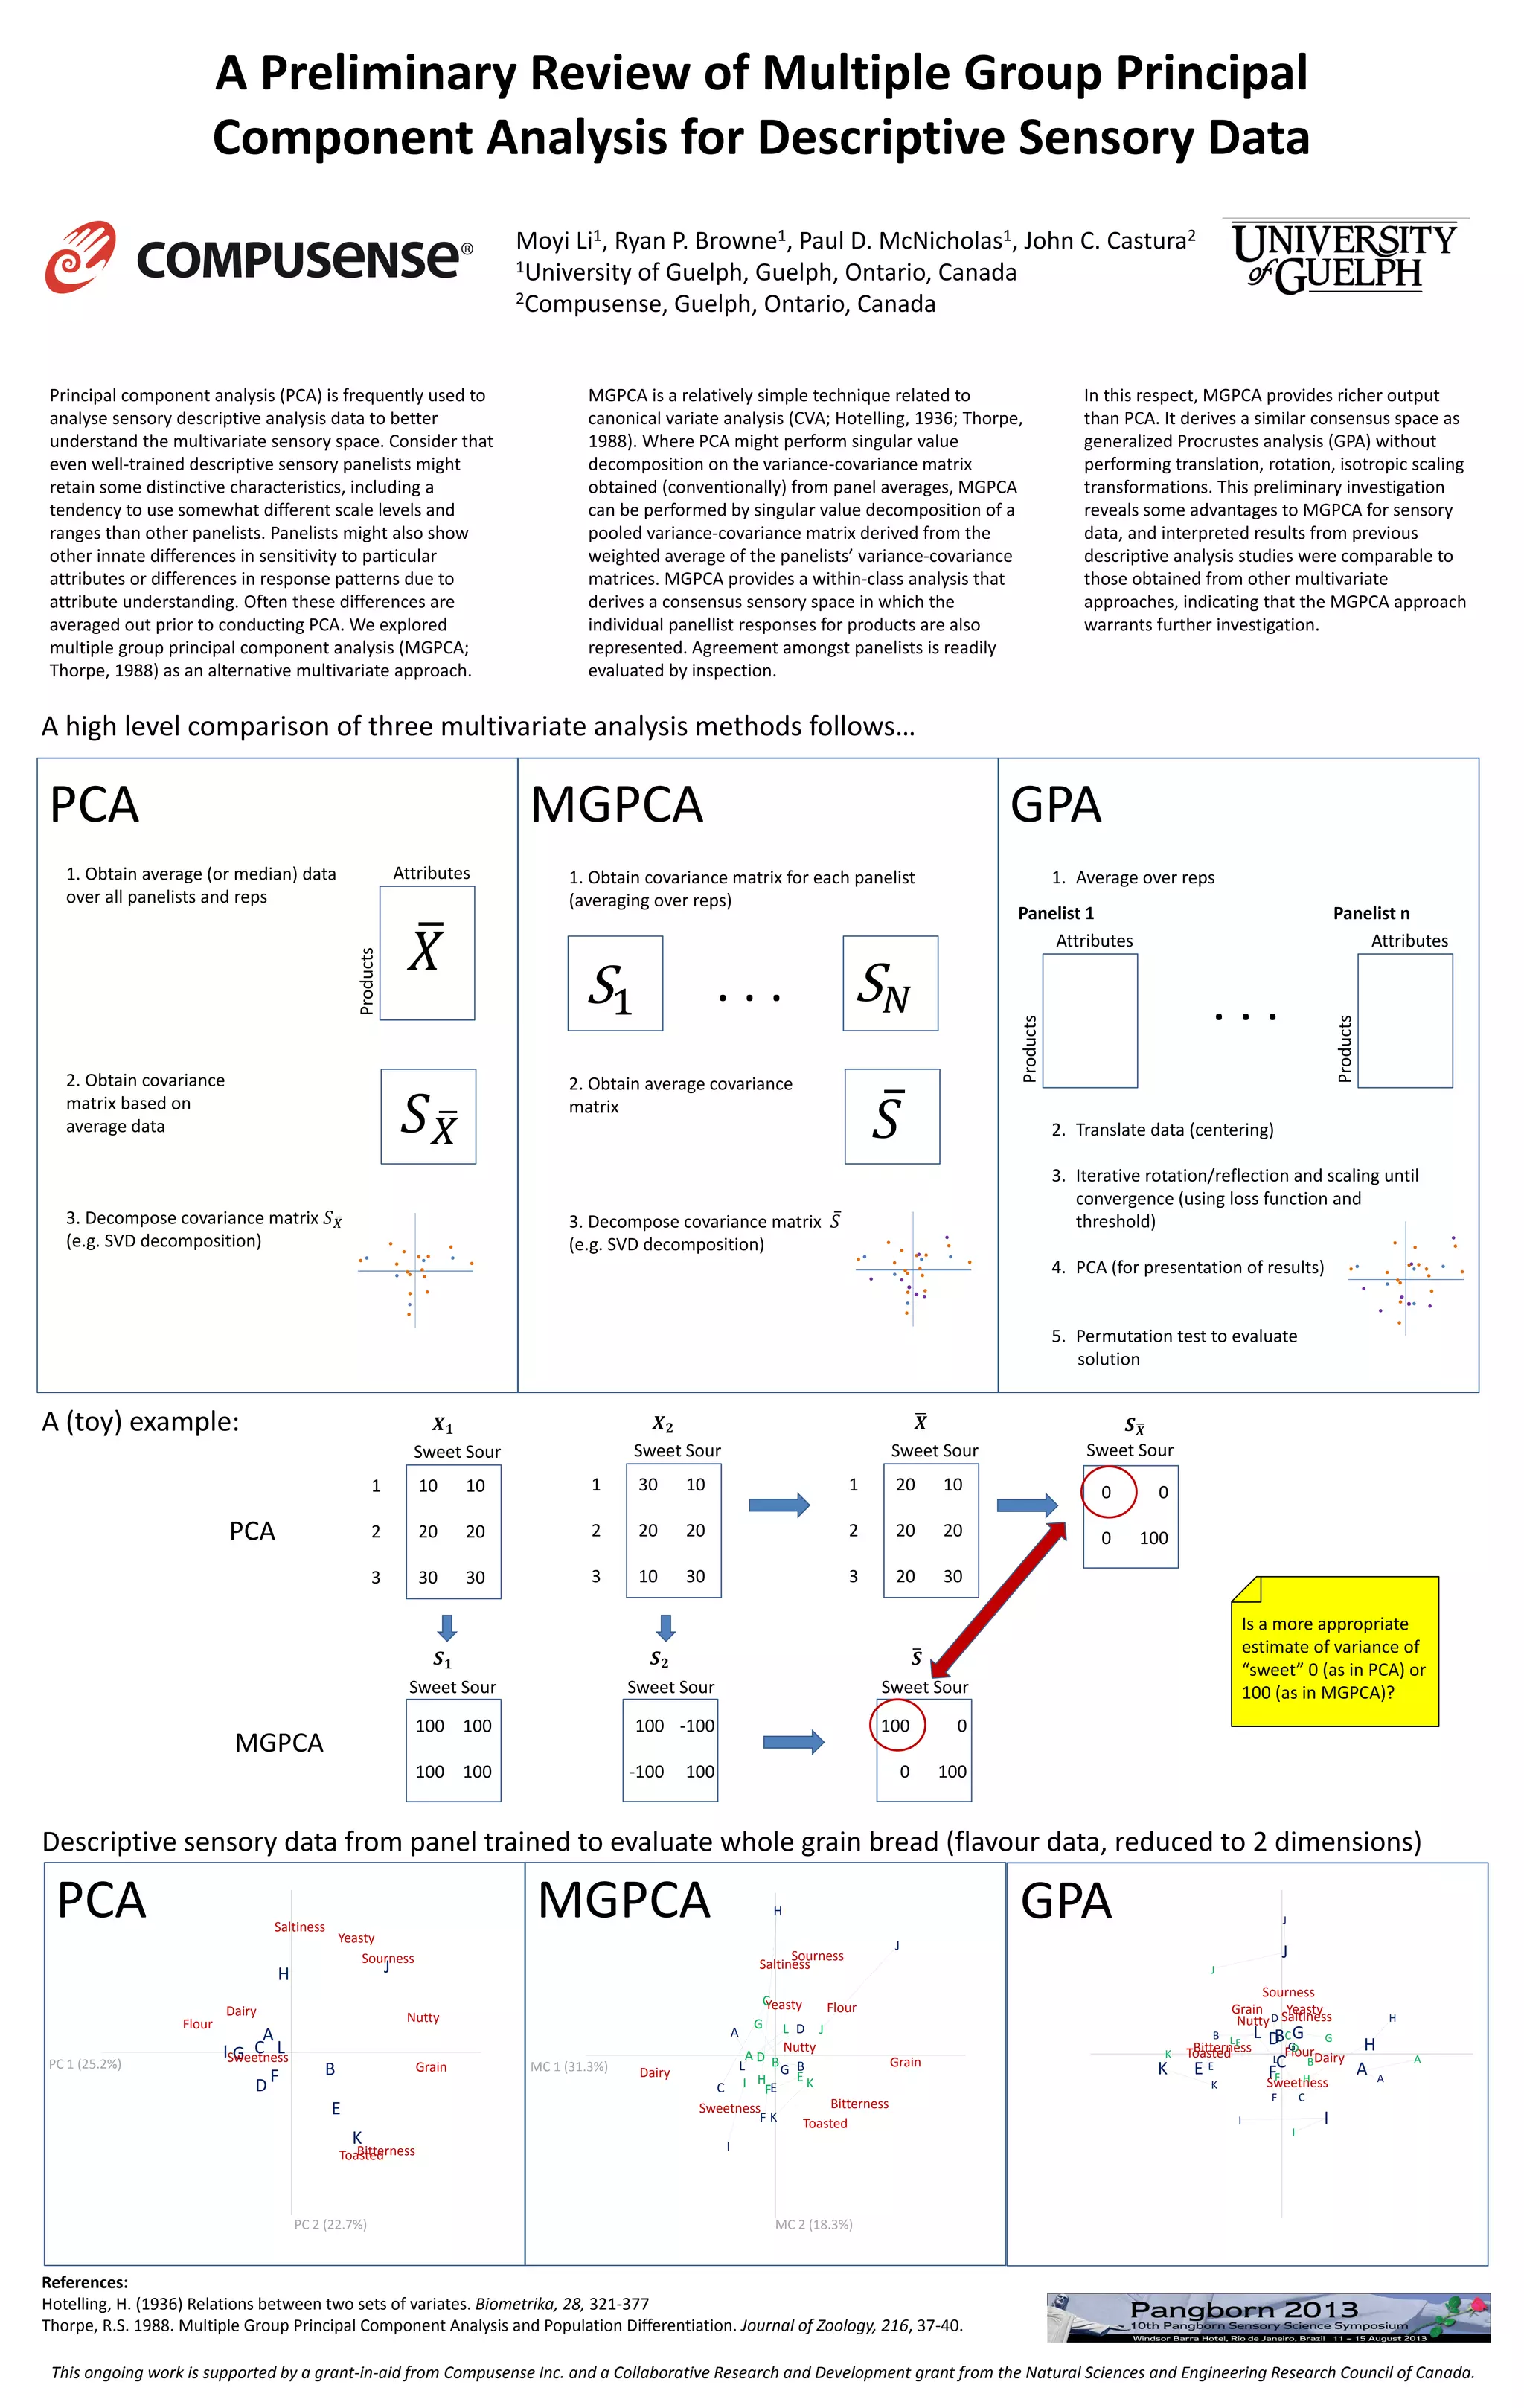

The document discusses a methodology for analyzing sensory descriptive data using multiple group principal component analysis (mgpca) as an alternative to traditional principal component analysis (PCA). It highlights the advantages of mgpca in accommodating differences among panelists and providing a richer output for understanding sensory attributes. The study suggests that mgpca merits further investigation for its potential benefits in sensory analysis.


