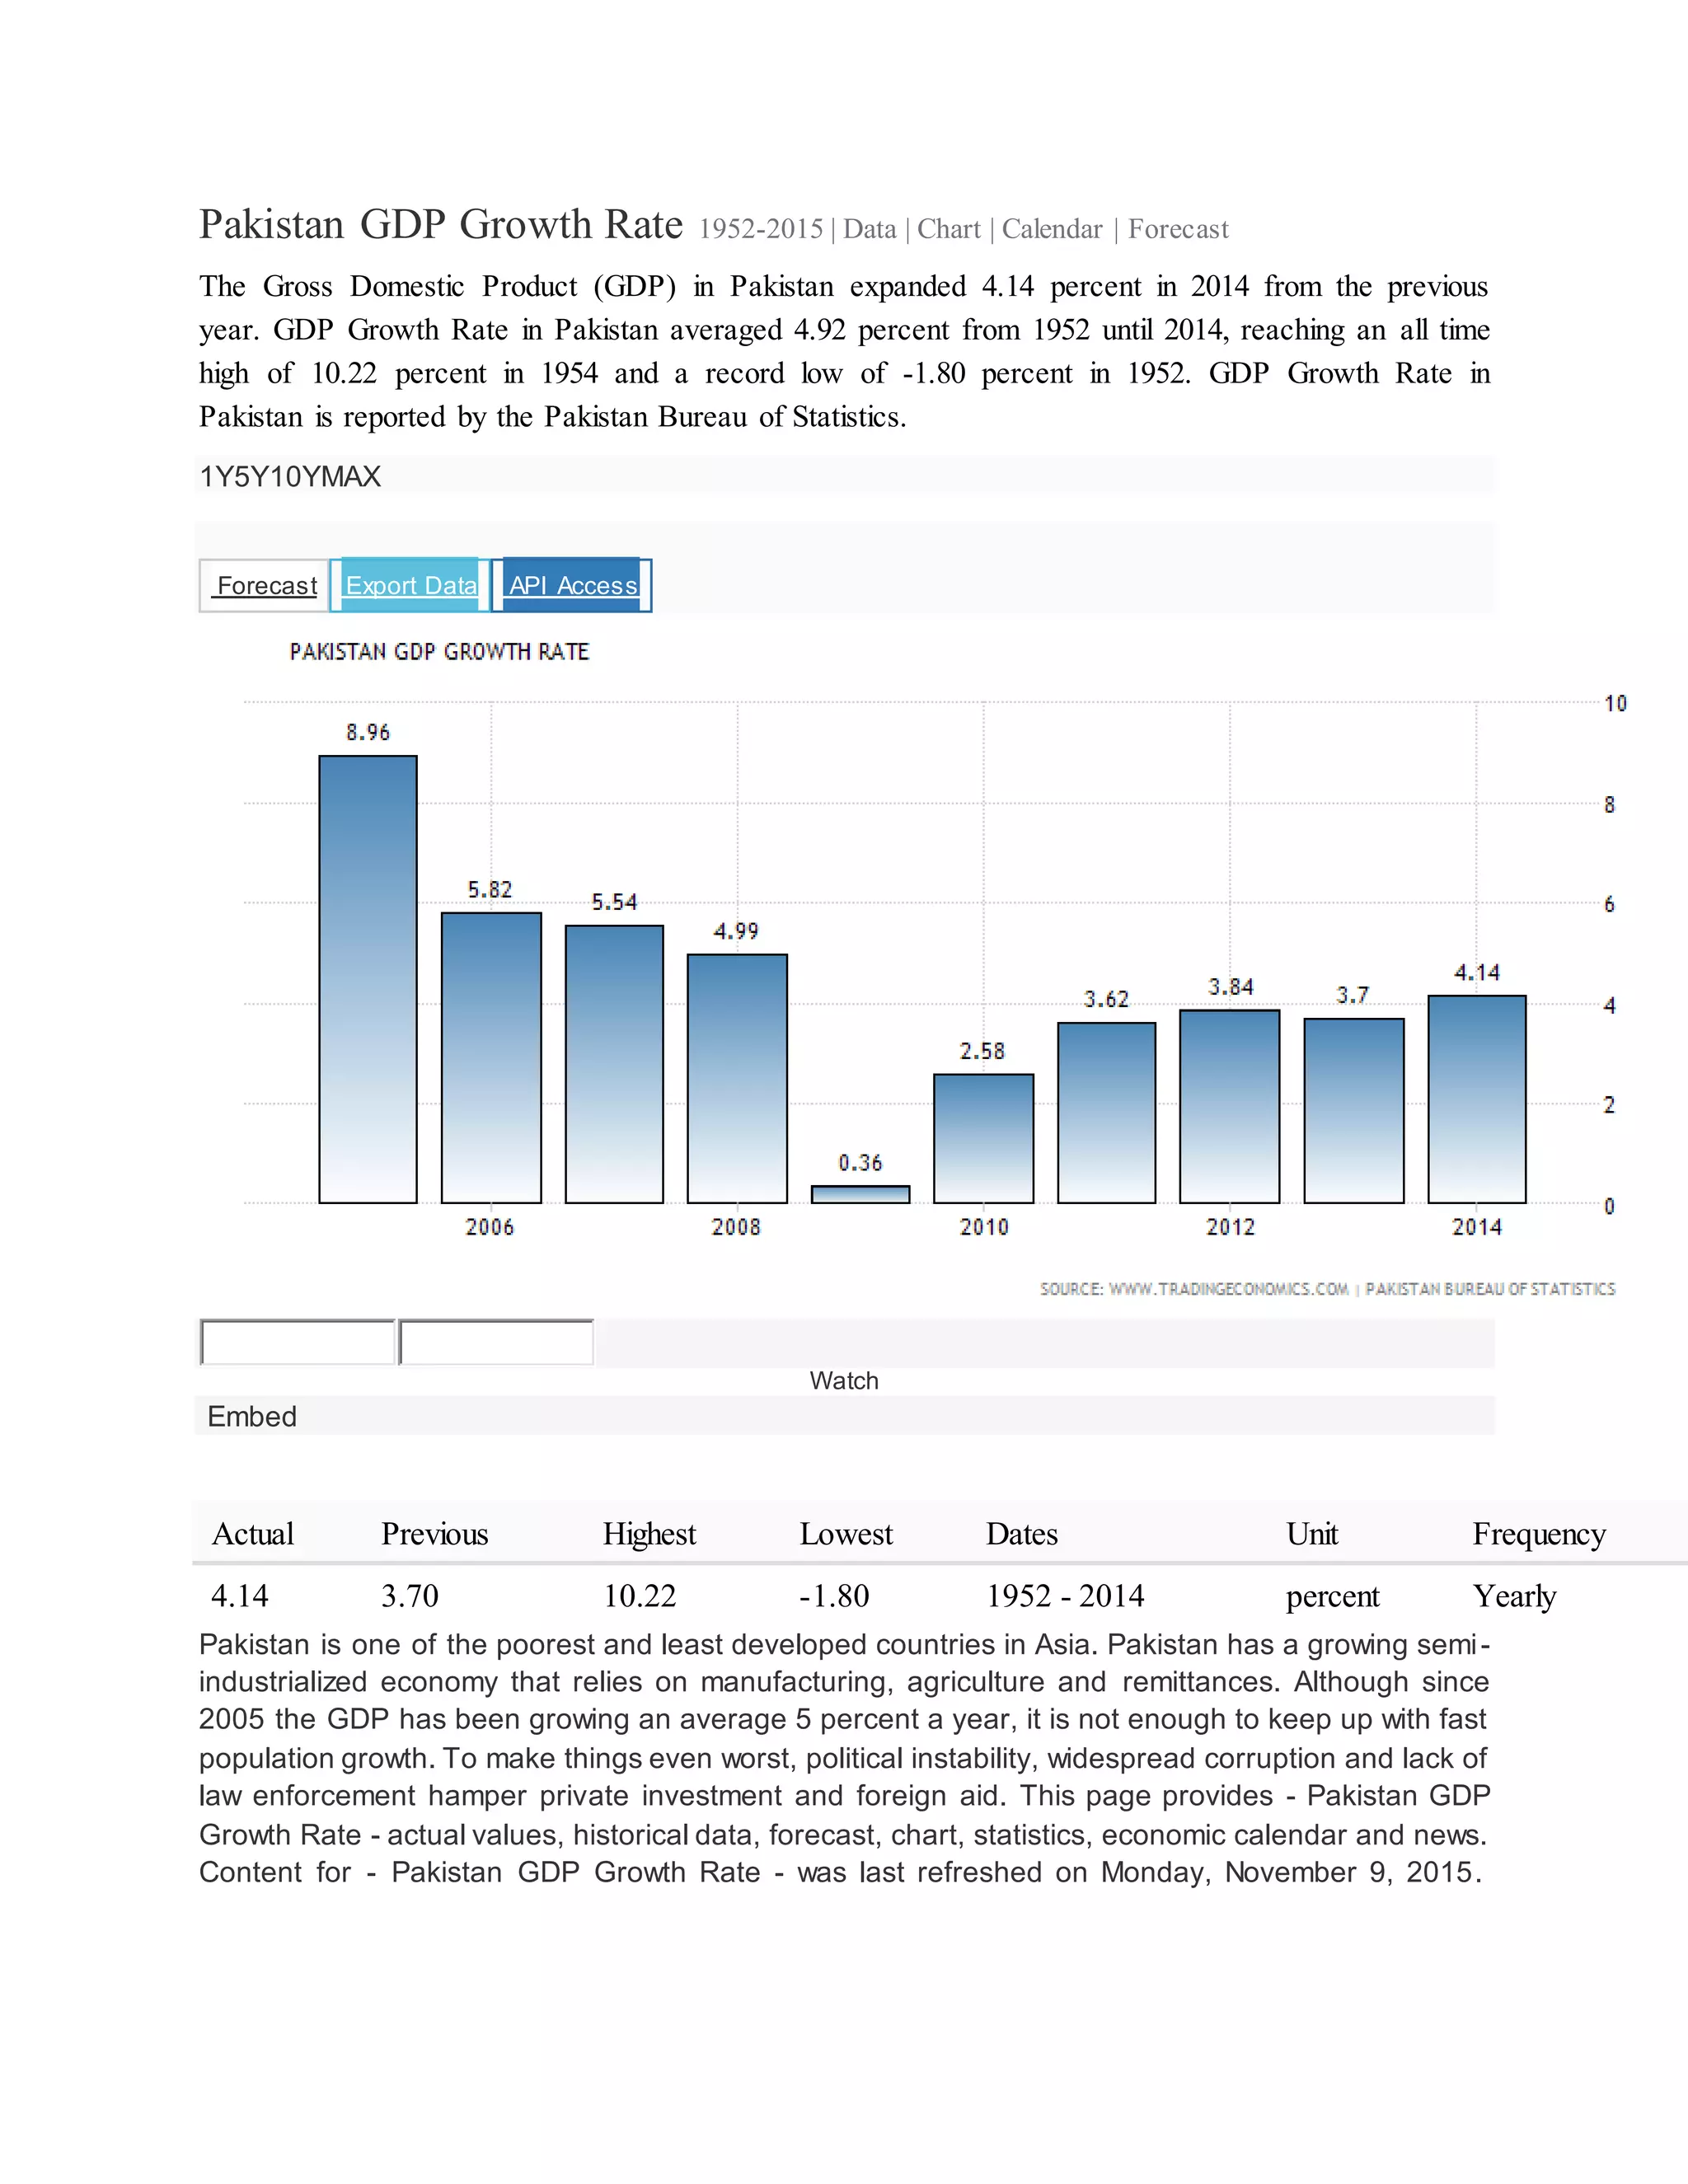
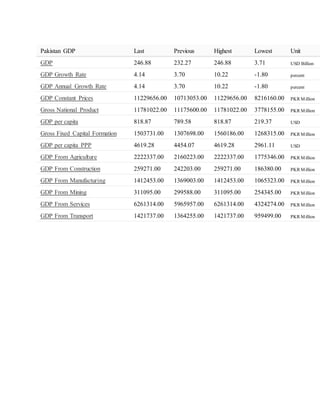
Pakistan GDP Growth Rate 1952-2015 | Data | Chart | Calendar | Forecast
The Gross Domestic Product (GDP) in Pakistan expanded 4.14 percent in 2014 from the previous
year. GDP Growth Rate in Pakistan averaged 4.92 percent from 1952 until 2014, reaching an all time
high of 10.22 percent in 1954 and a record low of -1.80 percent in 1952. GDP Growth Rate in
Pakistan is reported by the Pakistan Bureau of Statistics.
1Y5Y10YMAX
Forecast Export Data API Access
Watch
Embed
Actual Previous Highest Lowest Dates Unit Frequency
4.14 3.70 10.22 -1.80 1952 - 2014 percent Yearly
Pakistan is one of the poorest and least developed countries in Asia. Pakistan has a growing semi-
industrialized economy that relies on manufacturing, agriculture and remittances. Although since
2005 the GDP has been growing an average 5 percent a year, it is not enough to keep up with fast
population growth. To make things even worst, political instability, widespread corruption and lack of
law enforcement hamper private investment and foreign aid. This page provides - Pakistan GDP
Growth Rate - actual values, historical data, forecast, chart, statistics, economic calendar and news.
Content for - Pakistan GDP Growth Rate - was last refreshed on Monday, November 9, 2015.
Pakistan GDP Last Previous Highest Lowest Unit
GDP 246.88 232.27 246.88 3.71 USD Billion
GDP Growth Rate 4.14 3.70 10.22 -1.80 percent
GDP Annual Growth Rate 4.14 3.70 10.22 -1.80 percent
GDP Constant Prices 11229656.00 10713053.00 11229656.00 8216160.00 PKR Million
Gross National Product 11781022.00 11175600.00 11781022.00 3778155.00 PKR Million
GDP per capita 818.87 789.58 818.87 219.37 USD
Gross Fixed Capital Formation 1503731.00 1307698.00 1560186.00 1268315.00 PKR Million
GDP per capita PPP 4619.28 4454.07 4619.28 2961.11 USD
GDP From Agriculture 2222337.00 2160223.00 2222337.00 1775346.00 PKR Million
GDP From Construction 259271.00 242203.00 259271.00 186380.00 PKR Million
GDP From Manufacturing 1412453.00 1369003.00 1412453.00 1065323.00 PKR Million
GDP From Mining 311095.00 299588.00 311095.00 254345.00 PKR Million
GDP From Services 6261314.00 5965957.00 6261314.00 4324274.00 PKR Million
GDP From Transport 1421737.00 1364255.00 1421737.00 959499.00 PKR Million

Pakistan gdp growth rate

  • 1.
    Pakistan GDP GrowthRate 1952-2015 | Data | Chart | Calendar | Forecast The Gross Domestic Product (GDP) in Pakistan expanded 4.14 percent in 2014 from the previous year. GDP Growth Rate in Pakistan averaged 4.92 percent from 1952 until 2014, reaching an all time high of 10.22 percent in 1954 and a record low of -1.80 percent in 1952. GDP Growth Rate in Pakistan is reported by the Pakistan Bureau of Statistics. 1Y5Y10YMAX Forecast Export Data API Access Watch Embed Actual Previous Highest Lowest Dates Unit Frequency 4.14 3.70 10.22 -1.80 1952 - 2014 percent Yearly Pakistan is one of the poorest and least developed countries in Asia. Pakistan has a growing semi- industrialized economy that relies on manufacturing, agriculture and remittances. Although since 2005 the GDP has been growing an average 5 percent a year, it is not enough to keep up with fast population growth. To make things even worst, political instability, widespread corruption and lack of law enforcement hamper private investment and foreign aid. This page provides - Pakistan GDP Growth Rate - actual values, historical data, forecast, chart, statistics, economic calendar and news. Content for - Pakistan GDP Growth Rate - was last refreshed on Monday, November 9, 2015.
  • 2.
    Pakistan GDP LastPrevious Highest Lowest Unit GDP 246.88 232.27 246.88 3.71 USD Billion GDP Growth Rate 4.14 3.70 10.22 -1.80 percent GDP Annual Growth Rate 4.14 3.70 10.22 -1.80 percent GDP Constant Prices 11229656.00 10713053.00 11229656.00 8216160.00 PKR Million Gross National Product 11781022.00 11175600.00 11781022.00 3778155.00 PKR Million GDP per capita 818.87 789.58 818.87 219.37 USD Gross Fixed Capital Formation 1503731.00 1307698.00 1560186.00 1268315.00 PKR Million GDP per capita PPP 4619.28 4454.07 4619.28 2961.11 USD GDP From Agriculture 2222337.00 2160223.00 2222337.00 1775346.00 PKR Million GDP From Construction 259271.00 242203.00 259271.00 186380.00 PKR Million GDP From Manufacturing 1412453.00 1369003.00 1412453.00 1065323.00 PKR Million GDP From Mining 311095.00 299588.00 311095.00 254345.00 PKR Million GDP From Services 6261314.00 5965957.00 6261314.00 4324274.00 PKR Million GDP From Transport 1421737.00 1364255.00 1421737.00 959499.00 PKR Million