Downloaded 174 times


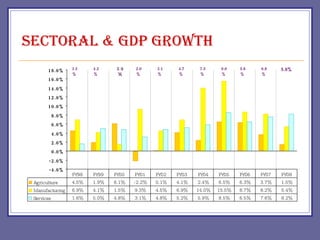


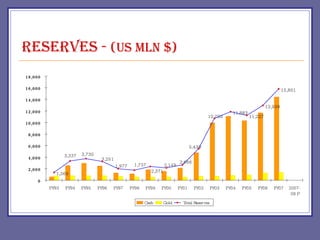

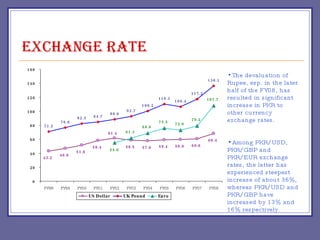


The document provides an overview of Pakistan's economy including key facts such as population, GDP growth rate, inflation rate, and economic sectors. It summarizes Pakistan's past economic performance with GDP growth over 5% for 9 of the last 18 years, with growth led by the services sector at 53% of GDP. It also notes trends in foreign investment, monetary assets growth, budget deficits, trade balances, remittances, debt levels, inflation, subsidies, reserves, and per capita income.


