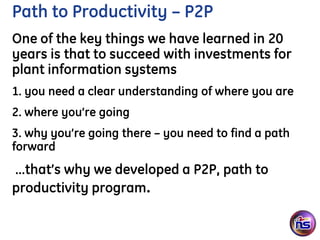
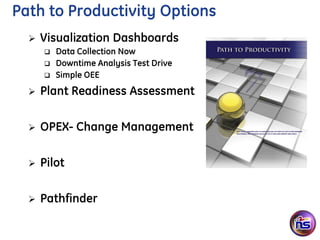
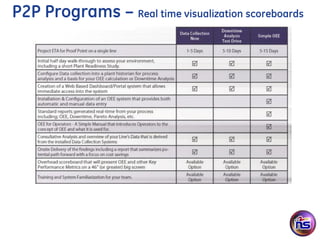
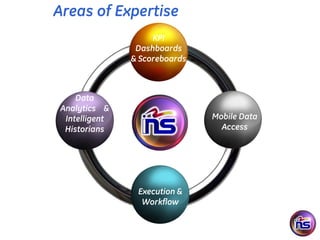
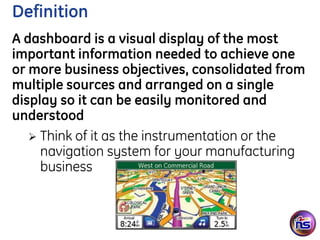
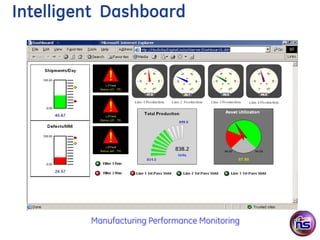
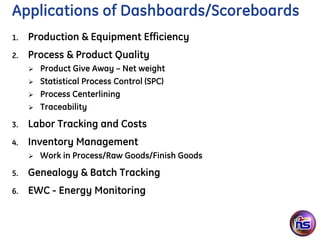
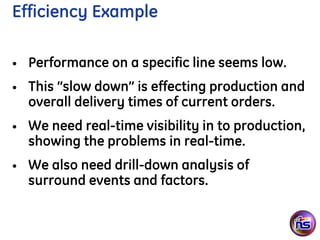
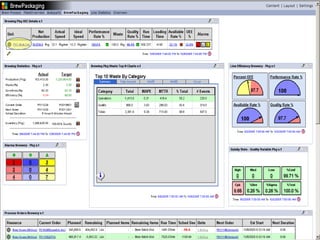
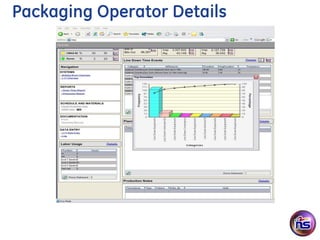
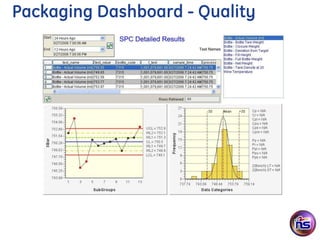
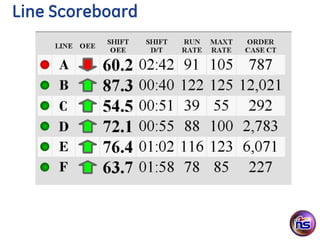
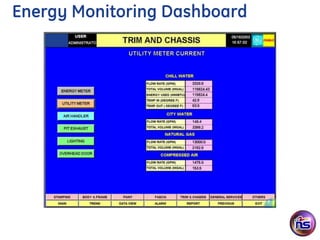
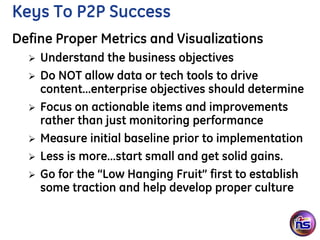
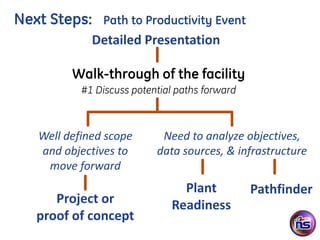
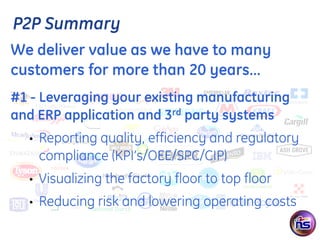
Presentor: James Cox


  P2P Program Presentation
     Path to Productivity
Path to Productivity – P2P
One of the key things we have learned in 20
years is that to succeed with investments for
plant information systems
1. you need a clear understanding of where you are
2. where you’re going
3. why you’re going there – you need to find a path
forward
…that’s why we developed a P2P, path to
productivity program.
Path to Productivity Options
     Visualization Dashboards
         Data Collection Now
         Downtime Analysis Test Drive
         Simple OEE
     Plant Readiness Assessment

     OPEX- Change Management

     Pilot

     Pathfinder
P2P Programs – Real time visualization scoreboards
Areas of Expertise
                     KPI
                 Dashboards
                & Scoreboards


     Data
 Analytics &
  Intelligent                   Mobile Data
  Historians                      Access


                 Execution &
                  Workflow
Definition
A dashboard is a visual display of the most
important information needed to achieve one
or more business objectives, consolidated from
multiple sources and arranged on a single
display so it can be easily monitored and
understood
    Think of it as the instrumentation or the
     navigation system for your manufacturing
     business
Intelligent Dashboard


         Manufacturing Performance Monitoring
Applications of Dashboards/Scoreboards
1.   Production & Equipment Efficiency
2.   Process & Product Quality
        Product Give Away – Net weight
        Statistical Process Control (SPC)
        Process Centerlining
        Traceability
3.   Labor Tracking and Costs
4.   Inventory Management
        Work in Process/Raw Goods/Finish Goods
5.   Genealogy & Batch Tracking
6.   EWC - Energy Monitoring
Efficiency Example

•   Performance on a specific line seems low.
•   This “slow down” is effecting production and
    overall delivery times of current orders.
•   We need real-time visibility in to production,
    showing the problems in real-time.
•   We also need drill-down analysis of
    surround events and factors.
Real World Examples

   Let’s Look at Some Manufacturing
          Company Dashboards
Packaging Operator Details
Packaging Dashboard - Quality
Line Scoreboard
Energy Monitoring Dashboard
Keys To P2P Success
Define Proper Metrics and Visualizations
     Understand the business objectives
     Do NOT allow data or tech tools to drive
      content…enterprise objectives should determine
     Focus on actionable items and improvements
      rather than just monitoring performance
     Measure initial baseline prior to implementation
     Less is more…start small and get solid gains.
     Go for the “Low Hanging Fruit” first to establish
      some traction and help develop proper culture
Next Steps:    Path to Productivity Event
             Detailed Presentation

         Walk-through of the facility
           #1 Discuss potential paths forward


   Well defined scope       Need to analyze objectives,
   and objectives to       data sources, & infrastructure
    move forward
                                Plant           Pathfinder
      Project or              Readiness
   proof of concept
P2P Summary
We deliver value as we have to many
customers for more than 20 years…
#1 - Leveraging your existing manufacturing
and ERP application and 3rd party systems
  •   Reporting quality, efficiency and regulatory
      compliance (KPI’s/OEE/SPC/CIP)
  •   Visualizing the factory floor to top floor
  •   Reducing risk and lowering operating costs
Questions


    James Cox
    (M) 636-448-8079
    jcox@ins3.com P2E plant automation
    Jim.cox@seeitmii.com SAP Mii

P2P Path To Productivity Linkedin

  • 1.
    Presentor: James Cox P2P Program Presentation Path to Productivity
  • 2.
    Path to Productivity– P2P One of the key things we have learned in 20 years is that to succeed with investments for plant information systems 1. you need a clear understanding of where you are 2. where you’re going 3. why you’re going there – you need to find a path forward …that’s why we developed a P2P, path to productivity program.
  • 3.
    Path to ProductivityOptions  Visualization Dashboards  Data Collection Now  Downtime Analysis Test Drive  Simple OEE  Plant Readiness Assessment  OPEX- Change Management  Pilot  Pathfinder
  • 4.
    P2P Programs –Real time visualization scoreboards
  • 5.
    Areas of Expertise KPI Dashboards & Scoreboards Data Analytics & Intelligent Mobile Data Historians Access Execution & Workflow
  • 6.
    Definition A dashboard isa visual display of the most important information needed to achieve one or more business objectives, consolidated from multiple sources and arranged on a single display so it can be easily monitored and understood  Think of it as the instrumentation or the navigation system for your manufacturing business
  • 7.
    Intelligent Dashboard Manufacturing Performance Monitoring
  • 8.
    Applications of Dashboards/Scoreboards 1. Production & Equipment Efficiency 2. Process & Product Quality  Product Give Away – Net weight  Statistical Process Control (SPC)  Process Centerlining  Traceability 3. Labor Tracking and Costs 4. Inventory Management  Work in Process/Raw Goods/Finish Goods 5. Genealogy & Batch Tracking 6. EWC - Energy Monitoring
  • 9.
    Efficiency Example • Performance on a specific line seems low. • This “slow down” is effecting production and overall delivery times of current orders. • We need real-time visibility in to production, showing the problems in real-time. • We also need drill-down analysis of surround events and factors.
  • 11.
    Real World Examples Let’s Look at Some Manufacturing Company Dashboards
  • 12.
  • 13.
  • 14.
  • 15.
  • 16.
    Keys To P2PSuccess Define Proper Metrics and Visualizations  Understand the business objectives  Do NOT allow data or tech tools to drive content…enterprise objectives should determine  Focus on actionable items and improvements rather than just monitoring performance  Measure initial baseline prior to implementation  Less is more…start small and get solid gains.  Go for the “Low Hanging Fruit” first to establish some traction and help develop proper culture
  • 17.
    Next Steps: Path to Productivity Event Detailed Presentation Walk-through of the facility #1 Discuss potential paths forward Well defined scope Need to analyze objectives, and objectives to data sources, & infrastructure move forward Plant Pathfinder Project or Readiness proof of concept
  • 18.
    P2P Summary We delivervalue as we have to many customers for more than 20 years… #1 - Leveraging your existing manufacturing and ERP application and 3rd party systems • Reporting quality, efficiency and regulatory compliance (KPI’s/OEE/SPC/CIP) • Visualizing the factory floor to top floor • Reducing risk and lowering operating costs
  • 19.
    Questions James Cox (M) 636-448-8079 jcox@ins3.com P2E plant automation Jim.cox@seeitmii.com SAP Mii