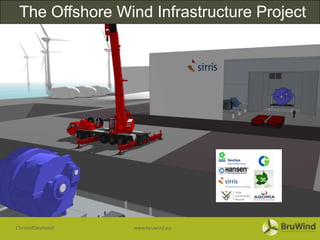
The Offshore Wind Infrastructure Project aims to develop advanced monitoring and testing infrastructure for offshore wind turbines. This includes lifetime component testing, structural health and performance monitoring, and wind measurements. The project seeks to generate data to improve understanding of component lifetime, wind climate conditions, and structural health. It also aims to develop enhanced operations and maintenance strategies. Monitoring systems would acquire vibration, acoustic emission, oil quality, current, temperature, and other data. Damage would be assessed through location, size, and type. Operations and maintenance decision making software would also be developed.
Performance Analysis of Faults Detection in Wind Turbine Generator Based on H...chokrio
Electrical energy production based on wind power has become the most popular renewable resources in the recent years because it gets reliable clean energy with minimum cost. The major challenge for wind turbines is the electrical and the mechanical failures which can occur at any time causing prospective breakdowns and damages and therefore it leads to machine downtimes and to energy production loss. To circumvent this problem, several tools and techniques have been developed and used to enhance fault detection and diagnosis to be found in the stator current signature for wind turbines generators. Among these methods, parametric or super-resolution frequency estimation methods, which provides typical spectrum estimation, can be useful for this purpose. Facing on the plurality of these algorithms, a comparative performance analysis is made to evaluate robustness based on different metrics: accuracy, dispersion, computation cost, perturbations and faults severity. Finally, simulation results in MATLAB with most occurring faults indicate that ESPRIT and R-MUSIC algorithms have high capability of correctly identifying the frequencies of fault characteristic components, a performance ranking had been carried out to demonstrate the efficiency of the studied methods in faults detecting.
Optimal combinaison of CFD modeling and statistical learning for short-term w...Jean-Claude Meteodyn
After almost three decades of active research, short-term wind power forecasting is now considered as a mature field. It has been widely and successfully put into operation within the past ten years. Meteodyn with over a decade of experience in wind engineering has contributed to this spread with tens of wind farm equipped with forecast solutions around the world. Our next-generation short-term forecasting solution has been designed to makes the most of both a tailored micro-scale CFD modeling and advanced statistical learning. In the frame of our model design, various options have been considered and evaluated taking into account both model performance and operational constraints. Two main approaches for wind power forecasting are usually considered in the literature (and sometimes opposed): “physical” and “statistical”. It is widely admitted that an optimal combination of both is necessary to build a high performance forecasting system. However, behind "optimal combination" resides a wide variety of design options. We propose here to shed some light on what performances one should expect from several modeling options for combining physics (mesoscale/CFD modeling) and statistics (grey/black box statistical learning, phase/magnitude correction, data filtering). Case studies are taken from real wind farms in various climate and terrain conditions.
Using the AC Drive Motor as a Transducer for detecting electrical and electro...Optima Control Solutions
Original citation:
Lane, Mark (2011) Using the AC Drive Motor as a Transducer for Detecting
Electrical and Electromechanical Faults. Masters thesis, University of
Huddersfield.
Full report available at: http://eprints.hud.ac.uk/10167/
Cuckoo search algorithm based for tunning both PI and FOPID controllers for ...IJECEIAES
Wind Energy has received great attention in this century. It influences the new power systems, adding new challenges to the power system expansion problem. Nowadays, double feed induction generator (DFIG) wind turbines are used majorly in wind farms, due to their advantages over other types. Therefore, the analysis of the system using this type has become very important. In this paper, a wind turbine modelling was introduced with suggested controllers, in order to enhance the system response, with respect to both pitch control and maximum output power. Cuckoo search algorithm (CSA), a meta-heuristic optimization technique, was implemented to determine the gains of a proportional-integral (PI) controller and fractional order proportional-integral-derivative (FOPID) controller to optimize the system, which considered three control loops: pitch, rotor-side converter, and grid-side converter control loop. Simulation results were determined using MATLAB/Simulink. The comparative analysis of the results showed that the PI Controller gave the simplest and the best response in case of the pitch and rotor-side control loops while the FOPID was the best when applied to the grid-side control loop. Based on the results and discussion, a suggestion of using a compination of each controller was introduced.
Real Time and Wireless Smart Faults Detection Device for Wind Turbineschokrio
In new energy development, wind power has boomed. It is due to the proliferation of wind parks and their operation in supplying the national electric grid with low cost and clean resources. Hence, there is an increased need to establish a proactive maintenance for wind turbine machines based on remote control and monitoring. That is necessary with a real-time wireless connection in offshore or inaccessible locations while the wired method has many flaws. The objective of this strategy is to prolong wind turbine lifetime and to increase productivity. The hardware of a remote control and monitoring system for wind turbine parks is designed. It takes advantage of GPRS or Wi-Max wireless module to collect data measurements from different wind machine sensors through IP based multi-hop communication. Computer simulations with Proteus ISIS and OPNET software tools have been conducted to evaluate the performance of the studied system. Study findings show that the designed device is suitable for application in a wind park.
In developing complex engineering systems, model-based design approaches often face critical challenges due to pervasive uncertainties and high computational expense. These challenges could be alleviated to a significant extent though informed modeling decisions, such as model substitution, parameter estimation, localized re-sampling, or grid refine- ment. Informed modeling decisions therefore necessitate (currently lacking) design frame- works that effectively integrate design automation and human decision-making. In this paper, we seek to address this necessity in the context of designing wind farm layouts, by taking an information flow perspective of this typical model-based design process. Specif- ically, we develop a visual representation of the uncertainties inherited and generated by models and the inter-model sensitivities. This framework is called the Visually-Informed Decision-Making Platform (VIDMAP) for wind farm design. The eFAST method is used for sensitivity analysis, in order to determine both the first-order and the total-order in- dices. The uncertainties in the independent inputs are quantified based on their observed variance. The uncertainties generated by the upstream models are quantified through a Monte Carlo simulation followed by probabilistic modeling of (i) the error in the output of the models (if high-fidelity estimates are available), or (ii) the deviation in the outputs estimated by different alternatives/versions of the model. The GUI in VIDMAP is cre- ated using value-proportional colors for each model block and inter-model connector, to respectively represent the uncertainty in the model output and the impact (downstream) of the information being relayed by the connector. Wind farm layout optimization (WFLO) serves as an excellent platform to develop and explore VIDMAP, where WFLO is generally performed using low fidelity models, as high-fidelity models (e.g. LES) tend to be compu- tationally prohibitive in this context. The final VIDMAP obtained sheds new light into the sensitivity of wind farm energy estimation on the different models and their associated uncertainties.
IDENTIFICATION OF TOWER AND BOOM-WAKES USING COLLOCATED ANEMOMETERS AND LIDAR...IAEME Publication
In this study the extent of tower and boom wake distortions were evaluated using collocated anemometers and Lidar measurement based on wind data from Amperbo, Namibia, where an existing latticed equilateral triangular communication tower was instrumented according to IEC specifications. Wind data analysed was 10-minute averaged, captured over a period of nine months (May to Sept. 2014). To enable further and independent investigation of flow modification within the vicinity of the tower, ZephIR 300 wind Lidar was installed at about 5.4 m from the foot of the tower. Wind data from pairs of collocated cup anemometers located at 16.88 m and 64.97 m above ground level (AGL) were analysed and compared to identify the range of directions that were affected by the waking of the entire tower physical structure. Mean speed and turbulence intensity (TI) were used in quantify the wake impact on the wind data observed using cup anemometers, showing a speed deficit of up to 49 % and order of magnitude increase in the TI for all the regions within the wake of the tower. Comparison with ZephIR 300 observed mean speed resulted in a speed deficit of up to 50 % which further confirmed the extent of tower distortion and wake boundaries. The Lidar also confirmed the speed-up effects and the asymmetric nature of the wake boundaries associated with the mounting booms. The results show that TI analysis has the potential to more accurately define the wake boundaries and wake distortion than traditional speed ratios analysis. The study shows that the severity of tower wake effects varies seasonally with winter months (June and July) recording the highest speed deficit when compared to December, a summer month. Root Mean Square Errors (RMSE) were further computed to ascertain the similarity degree of resource parameters from the two measurement techniques, resulting in peak values of RMSE in the wake affected regions. The TI approach consistently predicted larger wake boundaries than speed ratio analysis. Wind direction analysis clearly showed the 180° ambiguity of ZephIR 300 and the extent of deflection of the winds around the tower structure. Preliminary evaluation of wake impact on the resource parameter shows that removing the sectors affected by tower wakes leads to an increase in mean wind speed and a decrease in TI values.
Milsoft Utility Solution’s Arc Flash Analysis software facilitates faster and easier assessment of arc flash hazards and electrical incident analysis. Identify and analyze high risk arc flash areas in your electrical power system with greater flexibility by simulating and evaluating various mitigation methods in your arc flash study.
As the world's energy demand rises, so does the amount of renewable energy, particularly wind energy, in the supply. The life cycle of wind farms starting from manufacturing the components to decommission stage involve significant involvement of cost and the application of AI and data analytics are on reducing these costs are limited. With this conference talk, the audience expected to know some of the interesting applications of AI and data analytics on offshore wind. And, also highlight the future challenges and opportunities. This conference could be useful for students, academics and researcher who want to make next career in offshore wind but yet know where to start.
Development of a low cost test rig for standalone wecs subject to electrical ...ISA Interchange
In this paper, a contribution to the development of low-cost wind turbine (WT) test rig for stator fault diagnosis of wind turbine generator is proposed. The test rig is developed using a 2.5 kW, 1750 RPM DC motor coupled to a 1.5 kW, 1500 RPM self-excited induction generator interfaced with a WT mathematical model in LabVIEW. The performance of the test rig is benchmarked with already proven wind turbine test rigs. In order to detect the stator faults using non-stationary signals in self-excited induction generator, an online fault diagnostic technique of DWT-based multi-resolution analysis is proposed. It has been experimentally proven that for varying wind conditions wavelet decomposition allows good differentiation between faulty and healthy conditions leading to an effective diagnostic procedure for wind turbine condition monitoring.
In developing complex engineering systems, model-based design approaches often face critical challenges due to pervasive uncertainties and high computational expense. These challenges could be alleviated to a significant extent though informed modeling decisions, such as model substitution, parameter estimation, localized re-sampling, or grid refine- ment. Informed modeling decisions therefore necessitate (currently lacking) design frame- works that effectively integrate design automation and human decision-making. In this paper, we seek to address this necessity in the context of designing wind farm layouts, by taking an information flow perspective of this typical model-based design process. Specif- ically, we develop a visual representation of the uncertainties inherited and generated by models and the inter-model sensitivities. This framework is called the Visually-Informed Decision-Making Platform (VIDMAP) for wind farm design. The eFAST method is used for sensitivity analysis, in order to determine both the first-order and the total-order in- dices. The uncertainties in the independent inputs are quantified based on their observed variance. The uncertainties generated by the upstream models are quantified through a Monte Carlo simulation followed by probabilistic modeling of (i) the error in the output of the models (if high-fidelity estimates are available), or (ii) the deviation in the outputs estimated by different alternatives/versions of the model. The GUI in VIDMAP is cre- ated using value-proportional colors for each model block and inter-model connector, to respectively represent the uncertainty in the model output and the impact (downstream) of the information being relayed by the connector. Wind farm layout optimization (WFLO) serves as an excellent platform to develop and explore VIDMAP, where WFLO is generally performed using low fidelity models, as high-fidelity models (e.g. LES) tend to be compu- tationally prohibitive in this context. The final VIDMAP obtained sheds new light into the sensitivity of wind farm energy estimation on the different models and their associated uncertainties.
Compared to a time-based maintenance schedule, condition-based
maintenance provides better diagnostic information on the health condition
of the different wind turbine components and subsystems. Rather than using
an offline condition monitoring technique, which require the WT to be taken
out of service, online condition monitoring does not require any interruption
on the WT operation. The online condition monitoring system uses different
types of sensors such as vibration, acoustic, temperature, current/voltage etc.
Using a machine learning approach, we aim to establish a data driven fault
prognosis framework. Instead of traditional wired communications, wireless
communication systems such as wireless sensor network have the advantages
of easier installation and lower capital cost. We propose the use of WSN for
collecting and transmitting the condition monitoring data to enhance the
reliability of wind parks. Using data driven approach the collective health of
the WP can be represented based on the condition of the individual wind
turbines, which can be used for predicting the remaining useful life of the
system.
Business Valuation Principles for EntrepreneursBen Wann
This insightful presentation is designed to equip entrepreneurs with the essential knowledge and tools needed to accurately value their businesses. Understanding business valuation is crucial for making informed decisions, whether you're seeking investment, planning to sell, or simply want to gauge your company's worth.
LA HUG - Video Testimonials with Chynna Morgan - June 2024Lital Barkan
Have you ever heard that user-generated content or video testimonials can take your brand to the next level? We will explore how you can effectively use video testimonials to leverage and boost your sales, content strategy, and increase your CRM data.🤯
We will dig deeper into:
1. How to capture video testimonials that convert from your audience 🎥
2. How to leverage your testimonials to boost your sales 💲
3. How you can capture more CRM data to understand your audience better through video testimonials. 📊
Tata Group Dials Taiwan for Its Chipmaking Ambition in Gujarat’s DholeraAvirahi City Dholera
The Tata Group, a titan of Indian industry, is making waves with its advanced talks with Taiwanese chipmakers Powerchip Semiconductor Manufacturing Corporation (PSMC) and UMC Group. The goal? Establishing a cutting-edge semiconductor fabrication unit (fab) in Dholera, Gujarat. This isn’t just any project; it’s a potential game changer for India’s chipmaking aspirations and a boon for investors seeking promising residential projects in dholera sir.
Visit : https://www.avirahi.com/blog/tata-group-dials-taiwan-for-its-chipmaking-ambition-in-gujarats-dholera/
Unveiling the Secrets How Does Generative AI Work.pdfSam H
At its core, generative artificial intelligence relies on the concept of generative models, which serve as engines that churn out entirely new data resembling their training data. It is like a sculptor who has studied so many forms found in nature and then uses this knowledge to create sculptures from his imagination that have never been seen before anywhere else. If taken to cyberspace, gans work almost the same way.
Improving profitability for small businessBen Wann
In this comprehensive presentation, we will explore strategies and practical tips for enhancing profitability in small businesses. Tailored to meet the unique challenges faced by small enterprises, this session covers various aspects that directly impact the bottom line. Attendees will learn how to optimize operational efficiency, manage expenses, and increase revenue through innovative marketing and customer engagement techniques.
3.0 Project 2_ Developing My Brand Identity Kit.pptxtanyjahb
A personal brand exploration presentation summarizes an individual's unique qualities and goals, covering strengths, values, passions, and target audience. It helps individuals understand what makes them stand out, their desired image, and how they aim to achieve it.
Falcon stands out as a top-tier P2P Invoice Discounting platform in India, bridging esteemed blue-chip companies and eager investors. Our goal is to transform the investment landscape in India by establishing a comprehensive destination for borrowers and investors with diverse profiles and needs, all while minimizing risk. What sets Falcon apart is the elimination of intermediaries such as commercial banks and depository institutions, allowing investors to enjoy higher yields.
Affordable Stationery Printing Services in Jaipur | Navpack n PrintNavpack & Print
Looking for professional printing services in Jaipur? Navpack n Print offers high-quality and affordable stationery printing for all your business needs. Stand out with custom stationery designs and fast turnaround times. Contact us today for a quote!
5. The Offshore Wind Infrastructure Project Lidar Fix/Floating Climate Chamber Monitoring Systems Acquiring Knowledge of component lifetime Acquiring Knowledge of wind climate in wind farm, wakes, performance Acquiring Knowledge on Structural Health and Performance Monitoring O&M
67. Dynamic Monitoring Challenges How can the dynamic behaviour of a wind turbine be analyzed during operating conditions Existing operational modal analysis techniques are strictly speaking not applicable due to harmonic content of the aerodynamic loads The dynamic behavior of wind turbines is characterized by high aerodynamic damping and nearby modes How to deal with wind turbulences when pitch excitation is used for dynamic testing of operating wind turbines Proposed solutions developed by the VUB/AVRG and to be validated on wind turbines Operational Modal analysis using transmissibility measurements. This is a recently developed OMA techniques that makes no assumption about the nature of the loads The Polyreference Least Squares Frequency domain OMA approach well known for its clear stabilsation diagrams also for highly damped structures and nearby modes OMAX approach combines experimental modal analysis with operational modal analysis by considering both the excitation signal and the turbulence excitation as valuable data Figure from Applicability Limits of Operational Modal Analysis to Operational WindTurbinesD. Tcherniak+, S. Chauhan+, M.H. Hansen Figure from Full-scal modal wind turbine tests: comparing shaker excitation with wind excitation; In Proceedings of IMAC 28
68. Corrosion Monitoring Challenges Can corrosion be predicted for a complex structure like offshore wind turbines located in a harsh environment ? How accurate are these predictions and can the accuracy be improved ? How can the corrosion performance in the splash zone be optimized ? What is the potential for continuously monitoring the state of the CP system / the state of the monopile ? What alternative factors may cause unexpected corrosion. Proposed solutions developed by VUB Lifetime prediction based on a Potential Model, including CP performance. Expanding the capabilities of the model by measuring relevant parameters at the turbine location (O2, salinity, T, pH) + lab-scale experiments using these parameters to generate model input. Screening of potential proven coating alternatives Implementing the SURF corrosion sensor on a test location Focus on biofilms / microbial effects, interior of the pile…
69. Performance Monitoring Challenges Can power curves* obtained from SCADA data be used for fault prediction and diagnosis in wind turbines What is the most adequate approach to estimate and model the power curves of wind turbines Can the detected outliers be correlated with a specific fault Proposed solutions to be investigated Non-parametric modeling based on e.g. data mining approaches Parametric modeling using e.g. Least Squares estimation techniques On-line monitoring by e.g. residual approach, control charts, trend analysis Labeling SCADA data with status/fault codes Figures from On-line monitoring of power curves; Andrew Kusiak*, HaiyangZheng, Zhe Song; Renewable Energy 34 (2009) 1487–1493 *Measurement Power Curve according IEC 61400-12
70.
71. How can the dynamic behavior foundation and support structure be monitored and its design be improved
72. How accurate is prediction about the dynamic behavior of the foundation, tower and blades
73. How can the dynamic behavior wind turbine, tower and blades be monitored during operation
74. Can structural health monitoring be achieved from the measured load data and the identified dynamic behavior
81. Trend analysis and data miningFinally how can performance monitoring, structural health monitoring and wind data be combined in one improved O&M tool