The document provides information from the 2010 Census on population growth and demographic changes in the Charlotte region. Some key points:
- The population of the Metrolina region grew by 29% between 2000-2010 to over 2 million.
- Charlotte grew by 35% in the last decade, with almost half the growth occurring outside the I-485 beltway.
- Areas outside the city center like Southwest, South, North and Northeast Charlotte saw the largest population gains.
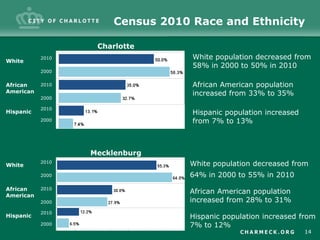
- The Hispanic population in Charlotte more than doubled to almost 96,000 between 2000-2010.