SlideShare a Scribd company logo
Vacancy Rates of 20 Walkable Neighborhoods vs.
                        Vacancy Rates of their Surrounding Cities
Neighborhood                           Total          Occupied               Vacant        Vacant %
City/County                           Units       Count        %       Count        %      Difference
Tribeca, New York                       10,125       9,128     90.2%        997       9.8%
New York city                        3,371,062   3,109,784     92.2%    261,278       7.8%       2.1%

Chinatown, SF                           6,258       5,677     90.7%        581       9.3%
San Francisco city                    376,942     345,811     91.7%     31,131       8.3%       1.0%

Old Westport, Kansas City               1,107         939     84.8%        168      15.2%
Kansas City city                      221,860     192,406     86.7%     29,454      13.3%       1.9%

Pearl District, Portland                2,313       2,139     92.5%        174       7.5%
Portland city                         265,439     248,546     93.6%     16,893       6.4%       1.2%

Dupont Circle, DC                      13,502      12,356     91.5%      1,146       8.5%
Washington city                       296,719     266,707     89.9%     30,012      10.1%       -1.6%

Pioneer Square, Seattle                   531         471     88.7%         60      11.3%
Seattle city                          308,516     283,510     91.9%     25,006       8.1%       3.2%

City Center East, Philadelphia         17,588      15,824     90.0%      1,764      10.0%
Philadelphia city                     670,171     599,736     89.5%     70,435      10.5%       -0.5%

Loop, Chicago                           22,754      17,315    76.1%      5,439      23.9%
Chicago city                         1,194,337   1,045,560    87.5%    148,777      12.5%      11.4%

Back Bay-Beacon Hill, Boston           20,070      17,690     88.1%      2,380      11.9%
Boston city                           272,481     252,699     92.7%     19,782       7.3%       4.6%

Lodo, Denver                            7,458       5,981     80.2%      1,477      19.8%
Denver city                           285,797     263,107     92.1%     22,690       7.9%      11.9%

Lower East Side, Milwaukee             10,035       8,828     88.0%      1,207      12.0%
Milwaukee city                        255,569     230,221     90.1%     25,348       9.9%       2.1%

Core, San Diego                         9,249       6,975     75.4%      2,274      24.6%
San Diego city                        516,033     483,092     93.6%     32,941       6.4%      18.2%

West End Historic District, Dallas        377         328     87.0%         49      13.0%
Dallas city                           516,639     458,057     88.7%     58,582      11.3%       1.7%

Federal Hill, Baltimore                 3,928       3,378     86.0%        550      14.0%
Baltimore city                        296,685     249,903     84.2%     46,782      15.8%       -1.8%
Neighborhood                            Total         Occupied               Vacant        Vacant %
City/County                             Units     Count        %       Count        %      Difference
Richmond Grove, Sacramento                1,346      1,172     87.1%        174     12.9%
Sacramento city                         190,911    174,624     91.5%     16,287       8.5%       4.4%

Five Points, Atlanta                      2,029     1,415     69.7%        614      30.3%
Atlanta city                            224,573   185,142     82.4%     39,431      17.6%      12.7%

Downtown, Cleveland                       5,534     4,194     75.8%      1,340      24.2%
Cleveland city                          207,536   167,490     80.7%     40,046      19.3%       4.9%

Downtown, San Antonio                     1,757     1,518     86.4%        239      13.6%
San Antonio city                        524,246   479,642     91.5%     44,604       8.5%       5.1%

Central Business District, Louisville     2,726     2,243     82.3%        483      17.7%
Jefferson County                        337,616   309,175     91.6%     28,441       8.4%       9.3%

Cherry, Charlotte                         1,350     1,099     81.4%        251      18.6%
Charlotte city                          319,918   289,860     90.6%     30,058       9.4%       9.2%

More Related Content

What's hot

Chicago Suburbs Office Insight - Q2 2016
Chicago Suburbs Office Insight - Q2 2016Chicago Suburbs Office Insight - Q2 2016
Chicago Suburbs Office Insight - Q2 2016
Hailey Harrington
 
Vancouver real estate rebgv stats package january 2011
Vancouver real estate rebgv stats package january 2011Vancouver real estate rebgv stats package january 2011
Vancouver real estate rebgv stats package january 2011
Matt Collinge
 
H W 2010 Q3 De 12 Mo
H W 2010 Q3 De 12 MoH W 2010 Q3 De 12 Mo
H W 2010 Q3 De 12 Mo
chipwags
 
Vancouver real estate stats package, june 2011
Vancouver real estate stats package, june 2011Vancouver real estate stats package, june 2011
Vancouver real estate stats package, june 2011
Matt Collinge
 
March 2099 Stats Real Estate Board Of Greater Vancouver
March 2099 Stats Real Estate Board Of Greater VancouverMarch 2099 Stats Real Estate Board Of Greater Vancouver
March 2099 Stats Real Estate Board Of Greater Vancouver
Christopher R Anderson
 
Scissors office supply(sino)
Scissors office supply(sino)Scissors office supply(sino)
Scissors office supply(sino)
roshelle15
 
Scissors office supply(buhisan)
Scissors office supply(buhisan)Scissors office supply(buhisan)
Scissors office supply(buhisan)
mylyn098
 
Scisor office supply
Scisor office supplyScisor office supply
Scisor office supply
elbertjune
 
REBGV Stats for December 2011 Courtesy Mike Stewart Vancouver Realtor
REBGV Stats for December 2011 Courtesy Mike Stewart Vancouver RealtorREBGV Stats for December 2011 Courtesy Mike Stewart Vancouver Realtor
REBGV Stats for December 2011 Courtesy Mike Stewart Vancouver Realtor
Mike Stewart
 

What's hot (9)

Chicago Suburbs Office Insight - Q2 2016
Chicago Suburbs Office Insight - Q2 2016Chicago Suburbs Office Insight - Q2 2016
Chicago Suburbs Office Insight - Q2 2016
 
Vancouver real estate rebgv stats package january 2011
Vancouver real estate rebgv stats package january 2011Vancouver real estate rebgv stats package january 2011
Vancouver real estate rebgv stats package january 2011
 
H W 2010 Q3 De 12 Mo
H W 2010 Q3 De 12 MoH W 2010 Q3 De 12 Mo
H W 2010 Q3 De 12 Mo
 
Vancouver real estate stats package, june 2011
Vancouver real estate stats package, june 2011Vancouver real estate stats package, june 2011
Vancouver real estate stats package, june 2011
 
March 2099 Stats Real Estate Board Of Greater Vancouver
March 2099 Stats Real Estate Board Of Greater VancouverMarch 2099 Stats Real Estate Board Of Greater Vancouver
March 2099 Stats Real Estate Board Of Greater Vancouver
 
Scissors office supply(sino)
Scissors office supply(sino)Scissors office supply(sino)
Scissors office supply(sino)
 
Scissors office supply(buhisan)
Scissors office supply(buhisan)Scissors office supply(buhisan)
Scissors office supply(buhisan)
 
Scisor office supply
Scisor office supplyScisor office supply
Scisor office supply
 
REBGV Stats for December 2011 Courtesy Mike Stewart Vancouver Realtor
REBGV Stats for December 2011 Courtesy Mike Stewart Vancouver RealtorREBGV Stats for December 2011 Courtesy Mike Stewart Vancouver Realtor
REBGV Stats for December 2011 Courtesy Mike Stewart Vancouver Realtor
 

Similar to Walkable Neighborhoods Vacancy Rates Excel

Open2012 fertility-entrepreneurship-ecosystem-down
Open2012 fertility-entrepreneurship-ecosystem-downOpen2012 fertility-entrepreneurship-ecosystem-down
Open2012 fertility-entrepreneurship-ecosystem-down
the nciia
 
Rebgv stats package%2_c_october_2011_%282%29
Rebgv stats package%2_c_october_2011_%282%29Rebgv stats package%2_c_october_2011_%282%29
Rebgv stats package%2_c_october_2011_%282%29
vancouverhomesteam
 
Stats Oct 11
Stats Oct 11Stats Oct 11
Stats Oct 11
Andrew Hudson
 
REBGV Stats for Sept 2011 Mike Stewart
REBGV Stats for Sept 2011 Mike StewartREBGV Stats for Sept 2011 Mike Stewart
REBGV Stats for Sept 2011 Mike Stewart
Mike Stewart
 
November 2011-rebgv-stats-adam scalena
November 2011-rebgv-stats-adam scalenaNovember 2011-rebgv-stats-adam scalena
November 2011-rebgv-stats-adam scalena
vancouverhomesteam
 
Vancouver real estate stats package, December 2011
Vancouver real estate stats package, December 2011Vancouver real estate stats package, December 2011
Vancouver real estate stats package, December 2011
Matt Collinge
 
2022-Q4-Ridership-APTA.pdf
2022-Q4-Ridership-APTA.pdf2022-Q4-Ridership-APTA.pdf
2022-Q4-Ridership-APTA.pdf
Burhan372344
 
NJ Future population changes in built out municipalities 7-2012
NJ Future population changes in built out municipalities 7-2012NJ Future population changes in built out municipalities 7-2012
NJ Future population changes in built out municipalities 7-2012
New Jersey Future
 
Nai Hunneman Market Review Q1 2012
Nai Hunneman Market Review Q1 2012Nai Hunneman Market Review Q1 2012
Nai Hunneman Market Review Q1 2012
Dgilkie
 
NAI Hunneman Market Review Q4 2012
NAI Hunneman Market Review Q4 2012NAI Hunneman Market Review Q4 2012
NAI Hunneman Market Review Q4 2012
Dgilkie
 
NAI Hunneman Market Review Q3 2012
NAI Hunneman Market Review Q3 2012NAI Hunneman Market Review Q3 2012
NAI Hunneman Market Review Q3 2012
Dgilkie
 
ACS 2013: 70 Largest Cities with the Highest Bicycle Commute Rates
ACS 2013: 70 Largest Cities with the Highest Bicycle Commute RatesACS 2013: 70 Largest Cities with the Highest Bicycle Commute Rates
ACS 2013: 70 Largest Cities with the Highest Bicycle Commute Rates
carolynbike
 
JLL Great Lakes Scorecard
JLL Great Lakes ScorecardJLL Great Lakes Scorecard
JLL Great Lakes Scorecard
Andrew Batson
 
Gta office market statistics q3 2011
Gta office market statistics q3 2011Gta office market statistics q3 2011
Gta office market statistics q3 2011
Chris Fyvie
 
2262015 Table 5 ­ Crime in the United States 2009http.docx
2262015 Table 5 ­ Crime in the United States 2009http.docx2262015 Table 5 ­ Crime in the United States 2009http.docx
2262015 Table 5 ­ Crime in the United States 2009http.docx
eugeniadean34240
 
Towns Ranked by High School Grad
Towns Ranked by High School GradTowns Ranked by High School Grad
Towns Ranked by High School Grad
Honolulu Civil Beat
 
U.S. States Median Rent
U.S. States Median RentU.S. States Median Rent
U.S. States Median Rent
Honolulu Civil Beat
 
Charlotte's stats
Charlotte's statsCharlotte's stats
Charlotte's stats
Cameron Boles
 
Local road rehabilitation program charts (1)
Local road rehabilitation program charts (1)Local road rehabilitation program charts (1)
Local road rehabilitation program charts (1)
Jeffrey C. Hicks
 
Q1 2013 North Peninsula Quarterly Report
Q1 2013 North Peninsula Quarterly ReportQ1 2013 North Peninsula Quarterly Report
Q1 2013 North Peninsula Quarterly Report
Deborah OReilly
 

Similar to Walkable Neighborhoods Vacancy Rates Excel (20)

Open2012 fertility-entrepreneurship-ecosystem-down
Open2012 fertility-entrepreneurship-ecosystem-downOpen2012 fertility-entrepreneurship-ecosystem-down
Open2012 fertility-entrepreneurship-ecosystem-down
 
Rebgv stats package%2_c_october_2011_%282%29
Rebgv stats package%2_c_october_2011_%282%29Rebgv stats package%2_c_october_2011_%282%29
Rebgv stats package%2_c_october_2011_%282%29
 
Stats Oct 11
Stats Oct 11Stats Oct 11
Stats Oct 11
 
REBGV Stats for Sept 2011 Mike Stewart
REBGV Stats for Sept 2011 Mike StewartREBGV Stats for Sept 2011 Mike Stewart
REBGV Stats for Sept 2011 Mike Stewart
 
November 2011-rebgv-stats-adam scalena
November 2011-rebgv-stats-adam scalenaNovember 2011-rebgv-stats-adam scalena
November 2011-rebgv-stats-adam scalena
 
Vancouver real estate stats package, December 2011
Vancouver real estate stats package, December 2011Vancouver real estate stats package, December 2011
Vancouver real estate stats package, December 2011
 
2022-Q4-Ridership-APTA.pdf
2022-Q4-Ridership-APTA.pdf2022-Q4-Ridership-APTA.pdf
2022-Q4-Ridership-APTA.pdf
 
NJ Future population changes in built out municipalities 7-2012
NJ Future population changes in built out municipalities 7-2012NJ Future population changes in built out municipalities 7-2012
NJ Future population changes in built out municipalities 7-2012
 
Nai Hunneman Market Review Q1 2012
Nai Hunneman Market Review Q1 2012Nai Hunneman Market Review Q1 2012
Nai Hunneman Market Review Q1 2012
 
NAI Hunneman Market Review Q4 2012
NAI Hunneman Market Review Q4 2012NAI Hunneman Market Review Q4 2012
NAI Hunneman Market Review Q4 2012
 
NAI Hunneman Market Review Q3 2012
NAI Hunneman Market Review Q3 2012NAI Hunneman Market Review Q3 2012
NAI Hunneman Market Review Q3 2012
 
ACS 2013: 70 Largest Cities with the Highest Bicycle Commute Rates
ACS 2013: 70 Largest Cities with the Highest Bicycle Commute RatesACS 2013: 70 Largest Cities with the Highest Bicycle Commute Rates
ACS 2013: 70 Largest Cities with the Highest Bicycle Commute Rates
 
JLL Great Lakes Scorecard
JLL Great Lakes ScorecardJLL Great Lakes Scorecard
JLL Great Lakes Scorecard
 
Gta office market statistics q3 2011
Gta office market statistics q3 2011Gta office market statistics q3 2011
Gta office market statistics q3 2011
 
2262015 Table 5 ­ Crime in the United States 2009http.docx
2262015 Table 5 ­ Crime in the United States 2009http.docx2262015 Table 5 ­ Crime in the United States 2009http.docx
2262015 Table 5 ­ Crime in the United States 2009http.docx
 
Towns Ranked by High School Grad
Towns Ranked by High School GradTowns Ranked by High School Grad
Towns Ranked by High School Grad
 
U.S. States Median Rent
U.S. States Median RentU.S. States Median Rent
U.S. States Median Rent
 
Charlotte's stats
Charlotte's statsCharlotte's stats
Charlotte's stats
 
Local road rehabilitation program charts (1)
Local road rehabilitation program charts (1)Local road rehabilitation program charts (1)
Local road rehabilitation program charts (1)
 
Q1 2013 North Peninsula Quarterly Report
Q1 2013 North Peninsula Quarterly ReportQ1 2013 North Peninsula Quarterly Report
Q1 2013 North Peninsula Quarterly Report
 

More from Kristen Carney

Census Datasets by Geography
Census Datasets by GeographyCensus Datasets by Geography
Census Datasets by Geography
Kristen Carney
 
Visualizations
VisualizationsVisualizations
Visualizations
Kristen Carney
 
Traffic Report Sample 2019
Traffic Report Sample 2019Traffic Report Sample 2019
Traffic Report Sample 2019
Kristen Carney
 
San Diego DMA Demographics
San Diego DMA DemographicsSan Diego DMA Demographics
San Diego DMA Demographics
Kristen Carney
 
Example Citations and Notes for Custom Data Pulls
Example Citations and Notes for Custom Data PullsExample Citations and Notes for Custom Data Pulls
Example Citations and Notes for Custom Data Pulls
Kristen Carney
 
Austin Tx Demographics - Census 2010
Austin Tx Demographics - Census 2010Austin Tx Demographics - Census 2010
Austin Tx Demographics - Census 2010
Kristen Carney
 
Vacancy Rates of Walkable Neighborhoods
Vacancy Rates of Walkable NeighborhoodsVacancy Rates of Walkable Neighborhoods
Vacancy Rates of Walkable Neighborhoods
Kristen Carney
 
Use MapWindow to Figure Out Census Tract by Cities
Use MapWindow to Figure Out Census Tract by CitiesUse MapWindow to Figure Out Census Tract by Cities
Use MapWindow to Figure Out Census Tract by Cities
Kristen Carney
 
Urban Planning Trends Tweets
Urban Planning Trends TweetsUrban Planning Trends Tweets
Urban Planning Trends Tweets
Kristen Carney
 
Twitter Cheatsheet
Twitter CheatsheetTwitter Cheatsheet
Twitter Cheatsheet
Kristen Carney
 
6 Free Rock Star Twitter Tools
6 Free Rock Star Twitter Tools6 Free Rock Star Twitter Tools
6 Free Rock Star Twitter Tools
Kristen Carney
 
Census 2010 Redistricting Data for Phoenix Park in Maricopa County, Arizona
Census 2010 Redistricting Data for Phoenix Park in Maricopa County, ArizonaCensus 2010 Redistricting Data for Phoenix Park in Maricopa County, Arizona
Census 2010 Redistricting Data for Phoenix Park in Maricopa County, Arizona
Kristen Carney
 
New TxDOT ENV Processes To Reduce Time to Deliver Projects by 50%
New TxDOT ENV Processes To Reduce Time to Deliver Projects by 50%New TxDOT ENV Processes To Reduce Time to Deliver Projects by 50%
New TxDOT ENV Processes To Reduce Time to Deliver Projects by 50%
Kristen Carney
 
How To Get People to Read Your Emails Sooner
How To Get People to Read Your Emails SoonerHow To Get People to Read Your Emails Sooner
How To Get People to Read Your Emails Sooner
Kristen Carney
 
Population by State: Census 2010 Data
Population by State: Census 2010 DataPopulation by State: Census 2010 Data
Population by State: Census 2010 Data
Kristen Carney
 
Local Government and Social Media
Local Government and Social MediaLocal Government and Social Media
Local Government and Social Media
Kristen Carney
 
TOD TIF Map - Dallas Texas
TOD TIF Map - Dallas TexasTOD TIF Map - Dallas Texas
TOD TIF Map - Dallas Texas
Kristen Carney
 
USDOT FHWA LEP Desk Reference
USDOT FHWA LEP Desk ReferenceUSDOT FHWA LEP Desk Reference
USDOT FHWA LEP Desk Reference
Kristen Carney
 
US Census 2010 Form
US Census 2010 FormUS Census 2010 Form
US Census 2010 Form
Kristen Carney
 
US Census 2000 Short Form
US Census 2000 Short FormUS Census 2000 Short Form
US Census 2000 Short Form
Kristen Carney
 

More from Kristen Carney (20)

Census Datasets by Geography
Census Datasets by GeographyCensus Datasets by Geography
Census Datasets by Geography
 
Visualizations
VisualizationsVisualizations
Visualizations
 
Traffic Report Sample 2019
Traffic Report Sample 2019Traffic Report Sample 2019
Traffic Report Sample 2019
 
San Diego DMA Demographics
San Diego DMA DemographicsSan Diego DMA Demographics
San Diego DMA Demographics
 
Example Citations and Notes for Custom Data Pulls
Example Citations and Notes for Custom Data PullsExample Citations and Notes for Custom Data Pulls
Example Citations and Notes for Custom Data Pulls
 
Austin Tx Demographics - Census 2010
Austin Tx Demographics - Census 2010Austin Tx Demographics - Census 2010
Austin Tx Demographics - Census 2010
 
Vacancy Rates of Walkable Neighborhoods
Vacancy Rates of Walkable NeighborhoodsVacancy Rates of Walkable Neighborhoods
Vacancy Rates of Walkable Neighborhoods
 
Use MapWindow to Figure Out Census Tract by Cities
Use MapWindow to Figure Out Census Tract by CitiesUse MapWindow to Figure Out Census Tract by Cities
Use MapWindow to Figure Out Census Tract by Cities
 
Urban Planning Trends Tweets
Urban Planning Trends TweetsUrban Planning Trends Tweets
Urban Planning Trends Tweets
 
Twitter Cheatsheet
Twitter CheatsheetTwitter Cheatsheet
Twitter Cheatsheet
 
6 Free Rock Star Twitter Tools
6 Free Rock Star Twitter Tools6 Free Rock Star Twitter Tools
6 Free Rock Star Twitter Tools
 
Census 2010 Redistricting Data for Phoenix Park in Maricopa County, Arizona
Census 2010 Redistricting Data for Phoenix Park in Maricopa County, ArizonaCensus 2010 Redistricting Data for Phoenix Park in Maricopa County, Arizona
Census 2010 Redistricting Data for Phoenix Park in Maricopa County, Arizona
 
New TxDOT ENV Processes To Reduce Time to Deliver Projects by 50%
New TxDOT ENV Processes To Reduce Time to Deliver Projects by 50%New TxDOT ENV Processes To Reduce Time to Deliver Projects by 50%
New TxDOT ENV Processes To Reduce Time to Deliver Projects by 50%
 
How To Get People to Read Your Emails Sooner
How To Get People to Read Your Emails SoonerHow To Get People to Read Your Emails Sooner
How To Get People to Read Your Emails Sooner
 
Population by State: Census 2010 Data
Population by State: Census 2010 DataPopulation by State: Census 2010 Data
Population by State: Census 2010 Data
 
Local Government and Social Media
Local Government and Social MediaLocal Government and Social Media
Local Government and Social Media
 
TOD TIF Map - Dallas Texas
TOD TIF Map - Dallas TexasTOD TIF Map - Dallas Texas
TOD TIF Map - Dallas Texas
 
USDOT FHWA LEP Desk Reference
USDOT FHWA LEP Desk ReferenceUSDOT FHWA LEP Desk Reference
USDOT FHWA LEP Desk Reference
 
US Census 2010 Form
US Census 2010 FormUS Census 2010 Form
US Census 2010 Form
 
US Census 2000 Short Form
US Census 2000 Short FormUS Census 2000 Short Form
US Census 2000 Short Form
 

Recently uploaded

Business storytelling: key ingredients to a story
Business storytelling: key ingredients to a storyBusiness storytelling: key ingredients to a story
Business storytelling: key ingredients to a story
Alexandra Fulford
 
Industrial Tech SW: Category Renewal and Creation
Industrial Tech SW:  Category Renewal and CreationIndustrial Tech SW:  Category Renewal and Creation
Industrial Tech SW: Category Renewal and Creation
Christian Dahlen
 
❼❷⓿❺❻❷❽❷❼❽ Dpboss Matka Result Satta Matka Guessing Satta Fix jodi Kalyan Fin...
❼❷⓿❺❻❷❽❷❼❽ Dpboss Matka Result Satta Matka Guessing Satta Fix jodi Kalyan Fin...❼❷⓿❺❻❷❽❷❼❽ Dpboss Matka Result Satta Matka Guessing Satta Fix jodi Kalyan Fin...
❼❷⓿❺❻❷❽❷❼❽ Dpboss Matka Result Satta Matka Guessing Satta Fix jodi Kalyan Fin...
❼❷⓿❺❻❷❽❷❼❽ Dpboss Kalyan Satta Matka Guessing Matka Result Main Bazar chart
 
Event Report - SAP Sapphire 2024 Orlando - lots of innovation and old challenges
Event Report - SAP Sapphire 2024 Orlando - lots of innovation and old challengesEvent Report - SAP Sapphire 2024 Orlando - lots of innovation and old challenges
Event Report - SAP Sapphire 2024 Orlando - lots of innovation and old challenges
Holger Mueller
 
Digital Marketing with a Focus on Sustainability
Digital Marketing with a Focus on SustainabilityDigital Marketing with a Focus on Sustainability
Digital Marketing with a Focus on Sustainability
sssourabhsharma
 
Dpboss Matka Guessing Satta Matta Matka Kalyan Chart Satta Matka
Dpboss Matka Guessing Satta Matta Matka Kalyan Chart Satta MatkaDpboss Matka Guessing Satta Matta Matka Kalyan Chart Satta Matka
Dpboss Matka Guessing Satta Matta Matka Kalyan Chart Satta Matka
➒➌➎➏➑➐➋➑➐➐Dpboss Matka Guessing Satta Matka Kalyan Chart Indian Matka
 
Satta Matka Dpboss Matka Guessing Kalyan Chart Indian Matka Kalyan panel Chart
Satta Matka Dpboss Matka Guessing Kalyan Chart Indian Matka Kalyan panel ChartSatta Matka Dpboss Matka Guessing Kalyan Chart Indian Matka Kalyan panel Chart
Satta Matka Dpboss Matka Guessing Kalyan Chart Indian Matka Kalyan panel Chart
➒➌➎➏➑➐➋➑➐➐Dpboss Matka Guessing Satta Matka Kalyan Chart Indian Matka
 
Best practices for project execution and delivery
Best practices for project execution and deliveryBest practices for project execution and delivery
Best practices for project execution and delivery
CLIVE MINCHIN
 
Organizational Change Leadership Agile Tour Geneve 2024
Organizational Change Leadership Agile Tour Geneve 2024Organizational Change Leadership Agile Tour Geneve 2024
Organizational Change Leadership Agile Tour Geneve 2024
Kirill Klimov
 
Zodiac Signs and Food Preferences_ What Your Sign Says About Your Taste
Zodiac Signs and Food Preferences_ What Your Sign Says About Your TasteZodiac Signs and Food Preferences_ What Your Sign Says About Your Taste
Zodiac Signs and Food Preferences_ What Your Sign Says About Your Taste
my Pandit
 
Authentically Social by Corey Perlman - EO Puerto Rico
Authentically Social by Corey Perlman - EO Puerto RicoAuthentically Social by Corey Perlman - EO Puerto Rico
Authentically Social by Corey Perlman - EO Puerto Rico
Corey Perlman, Social Media Speaker and Consultant
 
The 10 Most Influential Leaders Guiding Corporate Evolution, 2024.pdf
The 10 Most Influential Leaders Guiding Corporate Evolution, 2024.pdfThe 10 Most Influential Leaders Guiding Corporate Evolution, 2024.pdf
The 10 Most Influential Leaders Guiding Corporate Evolution, 2024.pdf
thesiliconleaders
 
2024-6-01-IMPACTSilver-Corp-Presentation.pdf
2024-6-01-IMPACTSilver-Corp-Presentation.pdf2024-6-01-IMPACTSilver-Corp-Presentation.pdf
2024-6-01-IMPACTSilver-Corp-Presentation.pdf
hartfordclub1
 
-- June 2024 is National Volunteer Month --
-- June 2024 is National Volunteer Month ---- June 2024 is National Volunteer Month --
-- June 2024 is National Volunteer Month --
NZSG
 
Digital Transformation Frameworks: Driving Digital Excellence
Digital Transformation Frameworks: Driving Digital ExcellenceDigital Transformation Frameworks: Driving Digital Excellence
Digital Transformation Frameworks: Driving Digital Excellence
Operational Excellence Consulting
 
Top mailing list providers in the USA.pptx
Top mailing list providers in the USA.pptxTop mailing list providers in the USA.pptx
Top mailing list providers in the USA.pptx
JeremyPeirce1
 
The APCO Geopolitical Radar - Q3 2024 The Global Operating Environment for Bu...
The APCO Geopolitical Radar - Q3 2024 The Global Operating Environment for Bu...The APCO Geopolitical Radar - Q3 2024 The Global Operating Environment for Bu...
The APCO Geopolitical Radar - Q3 2024 The Global Operating Environment for Bu...
APCO
 
Unveiling the Dynamic Personalities, Key Dates, and Horoscope Insights: Gemin...
Unveiling the Dynamic Personalities, Key Dates, and Horoscope Insights: Gemin...Unveiling the Dynamic Personalities, Key Dates, and Horoscope Insights: Gemin...
Unveiling the Dynamic Personalities, Key Dates, and Horoscope Insights: Gemin...
my Pandit
 
Understanding User Needs and Satisfying Them
Understanding User Needs and Satisfying ThemUnderstanding User Needs and Satisfying Them
Understanding User Needs and Satisfying Them
Aggregage
 
How to Implement a Real Estate CRM Software
How to Implement a Real Estate CRM SoftwareHow to Implement a Real Estate CRM Software
How to Implement a Real Estate CRM Software
SalesTown
 

Recently uploaded (20)

Business storytelling: key ingredients to a story
Business storytelling: key ingredients to a storyBusiness storytelling: key ingredients to a story
Business storytelling: key ingredients to a story
 
Industrial Tech SW: Category Renewal and Creation
Industrial Tech SW:  Category Renewal and CreationIndustrial Tech SW:  Category Renewal and Creation
Industrial Tech SW: Category Renewal and Creation
 
❼❷⓿❺❻❷❽❷❼❽ Dpboss Matka Result Satta Matka Guessing Satta Fix jodi Kalyan Fin...
❼❷⓿❺❻❷❽❷❼❽ Dpboss Matka Result Satta Matka Guessing Satta Fix jodi Kalyan Fin...❼❷⓿❺❻❷❽❷❼❽ Dpboss Matka Result Satta Matka Guessing Satta Fix jodi Kalyan Fin...
❼❷⓿❺❻❷❽❷❼❽ Dpboss Matka Result Satta Matka Guessing Satta Fix jodi Kalyan Fin...
 
Event Report - SAP Sapphire 2024 Orlando - lots of innovation and old challenges
Event Report - SAP Sapphire 2024 Orlando - lots of innovation and old challengesEvent Report - SAP Sapphire 2024 Orlando - lots of innovation and old challenges
Event Report - SAP Sapphire 2024 Orlando - lots of innovation and old challenges
 
Digital Marketing with a Focus on Sustainability
Digital Marketing with a Focus on SustainabilityDigital Marketing with a Focus on Sustainability
Digital Marketing with a Focus on Sustainability
 
Dpboss Matka Guessing Satta Matta Matka Kalyan Chart Satta Matka
Dpboss Matka Guessing Satta Matta Matka Kalyan Chart Satta MatkaDpboss Matka Guessing Satta Matta Matka Kalyan Chart Satta Matka
Dpboss Matka Guessing Satta Matta Matka Kalyan Chart Satta Matka
 
Satta Matka Dpboss Matka Guessing Kalyan Chart Indian Matka Kalyan panel Chart
Satta Matka Dpboss Matka Guessing Kalyan Chart Indian Matka Kalyan panel ChartSatta Matka Dpboss Matka Guessing Kalyan Chart Indian Matka Kalyan panel Chart
Satta Matka Dpboss Matka Guessing Kalyan Chart Indian Matka Kalyan panel Chart
 
Best practices for project execution and delivery
Best practices for project execution and deliveryBest practices for project execution and delivery
Best practices for project execution and delivery
 
Organizational Change Leadership Agile Tour Geneve 2024
Organizational Change Leadership Agile Tour Geneve 2024Organizational Change Leadership Agile Tour Geneve 2024
Organizational Change Leadership Agile Tour Geneve 2024
 
Zodiac Signs and Food Preferences_ What Your Sign Says About Your Taste
Zodiac Signs and Food Preferences_ What Your Sign Says About Your TasteZodiac Signs and Food Preferences_ What Your Sign Says About Your Taste
Zodiac Signs and Food Preferences_ What Your Sign Says About Your Taste
 
Authentically Social by Corey Perlman - EO Puerto Rico
Authentically Social by Corey Perlman - EO Puerto RicoAuthentically Social by Corey Perlman - EO Puerto Rico
Authentically Social by Corey Perlman - EO Puerto Rico
 
The 10 Most Influential Leaders Guiding Corporate Evolution, 2024.pdf
The 10 Most Influential Leaders Guiding Corporate Evolution, 2024.pdfThe 10 Most Influential Leaders Guiding Corporate Evolution, 2024.pdf
The 10 Most Influential Leaders Guiding Corporate Evolution, 2024.pdf
 
2024-6-01-IMPACTSilver-Corp-Presentation.pdf
2024-6-01-IMPACTSilver-Corp-Presentation.pdf2024-6-01-IMPACTSilver-Corp-Presentation.pdf
2024-6-01-IMPACTSilver-Corp-Presentation.pdf
 
-- June 2024 is National Volunteer Month --
-- June 2024 is National Volunteer Month ---- June 2024 is National Volunteer Month --
-- June 2024 is National Volunteer Month --
 
Digital Transformation Frameworks: Driving Digital Excellence
Digital Transformation Frameworks: Driving Digital ExcellenceDigital Transformation Frameworks: Driving Digital Excellence
Digital Transformation Frameworks: Driving Digital Excellence
 
Top mailing list providers in the USA.pptx
Top mailing list providers in the USA.pptxTop mailing list providers in the USA.pptx
Top mailing list providers in the USA.pptx
 
The APCO Geopolitical Radar - Q3 2024 The Global Operating Environment for Bu...
The APCO Geopolitical Radar - Q3 2024 The Global Operating Environment for Bu...The APCO Geopolitical Radar - Q3 2024 The Global Operating Environment for Bu...
The APCO Geopolitical Radar - Q3 2024 The Global Operating Environment for Bu...
 
Unveiling the Dynamic Personalities, Key Dates, and Horoscope Insights: Gemin...
Unveiling the Dynamic Personalities, Key Dates, and Horoscope Insights: Gemin...Unveiling the Dynamic Personalities, Key Dates, and Horoscope Insights: Gemin...
Unveiling the Dynamic Personalities, Key Dates, and Horoscope Insights: Gemin...
 
Understanding User Needs and Satisfying Them
Understanding User Needs and Satisfying ThemUnderstanding User Needs and Satisfying Them
Understanding User Needs and Satisfying Them
 
How to Implement a Real Estate CRM Software
How to Implement a Real Estate CRM SoftwareHow to Implement a Real Estate CRM Software
How to Implement a Real Estate CRM Software
 

Walkable Neighborhoods Vacancy Rates Excel

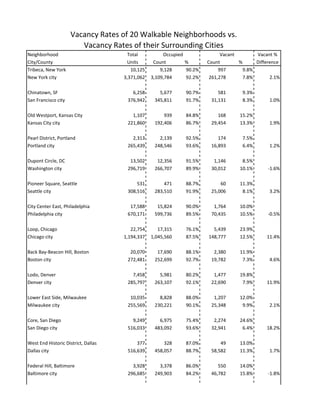
  • 1. Vacancy Rates of 20 Walkable Neighborhoods vs. Vacancy Rates of their Surrounding Cities Neighborhood Total Occupied Vacant Vacant % City/County Units Count % Count % Difference Tribeca, New York 10,125 9,128 90.2% 997 9.8% New York city 3,371,062 3,109,784 92.2% 261,278 7.8% 2.1% Chinatown, SF 6,258 5,677 90.7% 581 9.3% San Francisco city 376,942 345,811 91.7% 31,131 8.3% 1.0% Old Westport, Kansas City 1,107 939 84.8% 168 15.2% Kansas City city 221,860 192,406 86.7% 29,454 13.3% 1.9% Pearl District, Portland 2,313 2,139 92.5% 174 7.5% Portland city 265,439 248,546 93.6% 16,893 6.4% 1.2% Dupont Circle, DC 13,502 12,356 91.5% 1,146 8.5% Washington city 296,719 266,707 89.9% 30,012 10.1% -1.6% Pioneer Square, Seattle 531 471 88.7% 60 11.3% Seattle city 308,516 283,510 91.9% 25,006 8.1% 3.2% City Center East, Philadelphia 17,588 15,824 90.0% 1,764 10.0% Philadelphia city 670,171 599,736 89.5% 70,435 10.5% -0.5% Loop, Chicago 22,754 17,315 76.1% 5,439 23.9% Chicago city 1,194,337 1,045,560 87.5% 148,777 12.5% 11.4% Back Bay-Beacon Hill, Boston 20,070 17,690 88.1% 2,380 11.9% Boston city 272,481 252,699 92.7% 19,782 7.3% 4.6% Lodo, Denver 7,458 5,981 80.2% 1,477 19.8% Denver city 285,797 263,107 92.1% 22,690 7.9% 11.9% Lower East Side, Milwaukee 10,035 8,828 88.0% 1,207 12.0% Milwaukee city 255,569 230,221 90.1% 25,348 9.9% 2.1% Core, San Diego 9,249 6,975 75.4% 2,274 24.6% San Diego city 516,033 483,092 93.6% 32,941 6.4% 18.2% West End Historic District, Dallas 377 328 87.0% 49 13.0% Dallas city 516,639 458,057 88.7% 58,582 11.3% 1.7% Federal Hill, Baltimore 3,928 3,378 86.0% 550 14.0% Baltimore city 296,685 249,903 84.2% 46,782 15.8% -1.8%
  • 2. Neighborhood Total Occupied Vacant Vacant % City/County Units Count % Count % Difference Richmond Grove, Sacramento 1,346 1,172 87.1% 174 12.9% Sacramento city 190,911 174,624 91.5% 16,287 8.5% 4.4% Five Points, Atlanta 2,029 1,415 69.7% 614 30.3% Atlanta city 224,573 185,142 82.4% 39,431 17.6% 12.7% Downtown, Cleveland 5,534 4,194 75.8% 1,340 24.2% Cleveland city 207,536 167,490 80.7% 40,046 19.3% 4.9% Downtown, San Antonio 1,757 1,518 86.4% 239 13.6% San Antonio city 524,246 479,642 91.5% 44,604 8.5% 5.1% Central Business District, Louisville 2,726 2,243 82.3% 483 17.7% Jefferson County 337,616 309,175 91.6% 28,441 8.4% 9.3% Cherry, Charlotte 1,350 1,099 81.4% 251 18.6% Charlotte city 319,918 289,860 90.6% 30,058 9.4% 9.2%