Southeast Florida 5th Largest Metro Region in Nation
•
0 likes•330 views

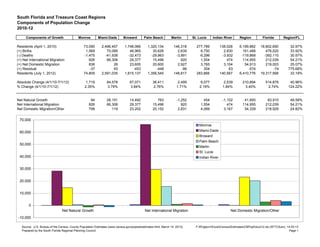
The document provides population data for regions in Florida from 2010-2012. It shows components of population change including births, deaths, domestic migration, and international migration. Some key points: - Miami-Dade, Broward, and Palm Beach counties saw population increases between 2.35-3.84% from 2010-2012. - Net natural growth and international migration contributed most to population growth across the regions, while domestic migration varied. - The Miami metropolitan area grew by over 198,000 people or 3.56% during this period, also led by natural growth and international migration.

Recommended
More Related Content
Viewers also liked
Viewers also liked (16)
Similar to Southeast Florida 5th Largest Metro Region in Nation
Similar to Southeast Florida 5th Largest Metro Region in Nation (20)
More from Roar Media
More from Roar Media (20)
Southeast Florida 5th Largest Metro Region in Nation
- 1. South Florida and Treasure Coast Regions Components of Population Change 2010-12 Components of Growth Monroe Miami-Dade Broward Palm Beach Martin St. Lucie Indian River Region Florida Region/FL Residents (April 1, 2010) 73,090 2,496,457 1,748,066 1,320,134 146,318 277,789 138,028 6,199,882 18,802,690 32.97% (+) Births 1,569 70,089 46,965 30,626 2,639 6,750 2,830 161,468 476,020 33.92% (-) Deaths -1,475 -41,938 -32,473 -29,863 -3,891 -6,296 -3,932 -119,868 -392,110 30.57% (+) Net International Migration 826 66,308 29,377 15,496 920 1,554 474 114,955 212,039 54.21% (+) Net Domestic Migration 836 26 23,655 20,600 2,927 3,765 3,104 54,913 219,003 25.07% (+) Residual -37 93 -453 -448 -96 304 63 -574 -74 775.68% Residents (July 1, 2012) 74,809 2,591,035 1,815,137 1,356,545 148,817 283,866 140,567 6,410,776 19,317,568 33.19% Absolute Change (4/1/10-7/1/12) 1,719 94,578 67,071 36,411 2,499 6,077 2,539 210,894 514,878 40.96% % Change (4/1/10-7/1/12) 2.35% 3.79% 3.84% 2.76% 1.71% 2.19% 1.84% 3.40% 2.74% 124.22% Net Natural Growth 94 28,151 14,492 763 -1,252 454 -1,102 41,600 83,910 49.58% Net International Migration 826 66,308 29,377 15,496 920 1,554 474 114,955 212,039 54.21% Net Domestic Migration/Other 799 119 23,202 20,152 2,831 4,069 3,167 54,339 218,929 24.82% 70,000 Monroe 60,000 Miami-Dade Broward Palm Beach 50,000 Martin St. Lucie 40,000 Indian River 30,000 20,000 10,000 0 Net Natural Growth Net International Migration Net Domestic Migration/Other -10,000 Source: U.S. Bureau of the Census, County Population Estimates (www.census.gov/popest/estimates.html, March 14, 2013). F:ROgburnExcelCensusEstimatesCBPopEstJul12.xls (SFTCSum), 14-03-13 Prepared by the South Florida Regional Planning Council. Page 1
- 2. Treasure Coast and Florida Components of Population Change 2010-12 Components of Growth Palm Beach Martin St. Lucie Indian River TC Florida TC/FL Residents (April 1, 2010) 1,320,134 146,318 277,789 138,028 1,882,269 18,802,690 10.01% (+) Births 30,626 2,639 6,750 2,830 42,845 476,020 9.00% (-) Deaths -29,863 -3,891 -6,296 -3,932 -43,982 -392,110 11.22% (+) Net International Migration 15,496 920 1,554 474 18,444 212,039 8.70% (+) Net Domestic Migration 20,600 2,927 3,765 3,104 30,396 219,003 13.88% (+) Residual -448 -96 304 63 -177 -74 239.19% Residents (July 1, 2012) 1,356,545 148,817 283,866 140,567 1,929,795 19,317,568 9.99% Absolute Change (4/1/10-7/1/12) 36,411 2,499 6,077 2,539 47,526 514,878 9.23% % Change (4/1/10-7/1/12) 2.76% 1.71% 2.19% 1.84% 2.52% 2.74% 92.21% Net Natural Growth 763 -1,252 454 -1,102 -1,137 83,910 -1.36% Net International Migration 15,496 920 1,554 474 18,444 212,039 8.70% Net Domestic Migration/Other 20,152 2,831 4,069 3,167 30,219 218,929 13.80% 25,000 Palm Beach Martin 20,000 St. Lucie Indian River 15,000 10,000 5,000 0 Net Natural Growth Net International Migration Net Domestic Migration/Other -5,000 Source: U.S. Bureau of the Census (March 14, 2013). F:ROgburnExcelCensusEstimatesCBPopEstJul12.xls (TCSum), 14-03-13 Prepared by the South Florida Regional Planning Council. Page 1
- 3. Miami-Fort Lauderdale-West Palm Beach Metropolitan Statistical Area Components of Population Change 2010-12 Components of Growth Miami-Dade Broward Palm Beach MSA Florida MSA/FL Residents (April 1, 2010) 2,496,457 1,748,066 1,320,134 5,564,657 18,802,690 29.60% (+) Births 70,089 46,965 30,626 147,680 476,020 31.02% (-) Deaths -41,938 -32,473 -29,863 -104,274 -392,110 26.59% (+) Net International Migration 66,308 29,377 15,496 111,181 212,039 52.43% (+) Net Domestic Migration 26 23,655 20,600 44,281 219,003 20.22% (+) Residual 93 -453 -448 -808 -74 1091.89% Residents (July 1, 2012) 2,591,035 1,815,137 1,356,545 5,762,717 19,317,568 29.83% Absolute Change (4/1/10-7/1/12) 94,578 67,071 36,411 198,060 514,878 38.47% % Change (4/1/10-7/1/12) 3.79% 3.84% 2.76% 3.56% 2.74% 129.98% Net Natural Growth 28,151 14,492 763 43,406 83,910 51.73% Net International Migration 66,308 29,377 15,496 111,181 212,039 52.43% Net Domestic Migration/Other 119 23,202 20,152 43,473 218,929 19.86% 70,000 Miami-Dade 60,000 Broward Palm Beach 50,000 40,000 30,000 20,000 10,000 0 Net Natural Growth Net International Migration Net Domestic Migration/Other Source: U.S. Bureau of the Census (March 14, 2013). F:ROgburnExcelCensusEstimatesCBPopEstJul12.xls (MSASum), 14-03-13 Prepared by the South Florida Regional Planning Council. Page 1
- 4. South Florida and Florida Components of Population Growth 2010-12 Components of Growth Broward Miami-Dade Monroe S Florida Florida SF/FL Residents (April 1, 2010) 1,748,066 2,496,457 73,090 4,317,613 18,802,690 22.96% (+) Births 46,965 70,089 1,569 118,623 476,020 24.92% (-) Deaths -32,473 -41,938 -1,475 -75,886 -392,110 19.35% (+) Net International Migration 29,377 66,308 826 96,511 212,039 45.52% (+) Net Domestic Migration 23,655 26 836 24,517 219,003 11.19% (+) Residual -453 93 -37 -397 -74 536.49% Residents (July 1, 2012) 1,815,137 2,591,035 74,809 4,480,981 19,317,568 23.20% Absolute Change (4/1/10-7/1/12) 67,071 94,578 1,719 163,368 514,878 31.73% % Change (4/1/10-7/1/12) 3.84% 3.79% 2.35% 3.78% 2.74% 138.18% Net Natural Growth 14,492 28,151 94 42,737 83,910 50.93% Net International Migration 29,377 66,308 826 96,511 212,039 45.52% Net Domestic Migration/Other 23,202 119 799 24,120 218,929 11.02% 70,000 Broward Miami-Dade 60,000 Monroe 50,000 40,000 30,000 20,000 10,000 0 Net Natural Growth Net International Migration Net Domestic Migration/Other Source: U.S. Bureau of the Census (March 14, 2013). F:ROgburnExcelCensusEstimatesCBPopEstJul12.xls (SFSum), 14-03-13 Prepared by the South Florida Regional Planning Council. Page 1
- 5. United States Components of Population Growth 2010-19 Beginning of (+) Net (+) Net (=) End of Period Period (+) Births (-) Deaths International Domestic (+) Residual Period Begin Period End Population Migration Migration Population 01-Apr-10 01-Jul-10 308,747,508 987,836 -598,716 189,597 0 0 309,326,225 01-Jul-10 01-Jul-11 309,326,225 3,977,039 -2,490,976 775,528 0 0 311,587,816 01-Jul-11 01-Jul-12 311,587,816 3,953,593 -2,513,173 885,804 0 0 313,914,040 01-Jul-12 01-Jul-13 313,914,040 0 0 0 0 0 313,914,040 01-Jul-13 01-Jul-14 0 0 0 0 0 0 0 01-Jul-14 01-Jul-15 0 0 0 0 0 0 0 01-Jul-15 01-Jul-16 0 0 0 0 0 0 0 01-Jul-16 01-Jul-17 0 0 0 0 0 0 0 01-Jul-17 01-Jul-18 0 0 0 0 0 0 0 01-Jul-18 01-Jul-19 0 0 0 0 0 0 0 01-Apr-10 01-Jul-19 308,747,508 8,918,468 -5,602,865 1,850,929 0 0 313,914,040 1,600,000 Jul/10-Jul/11 Jul/11-Jul/12 1,400,000 Jul/12-Jul/13 Jul/13-Jul/14 Jul/14-Jul/15 1,200,000 Jul/15-Jul/16 Jul/16-Jul/17 Jul/17-Jul/18 1,000,000 Jul/18-Jul/19 800,000 600,000 400,000 200,000 0 Net Natural Growth Net International Migration Net Domestic Migration / Other Source: U.S. Bureau of the Census (March 14, 2013). F:ROgburnExcelCensusEstimatesCBPopEstJul12.xls (US), 14-03-13 Prepared by the South Florida Regional Planning Council. Page 1
- 6. State of Florida Components of Population Growth 2010-19 Beginning of (+) Net (+) Net (=) End of Period Period (+) Births (-) Deaths International Domestic (+) Residual Period Begin Period End Population Migration Migration Population 01-Apr-10 01-Jul-10 18,802,690 52,204 -41,687 20,524 12,478 -242 18,845,967 01-Jul-10 01-Jul-11 18,845,967 211,739 -172,472 92,129 105,114 -215 19,082,262 01-Jul-11 01-Jul-12 19,082,262 212,077 -177,951 99,386 101,411 383 19,317,568 01-Jul-12 01-Jul-13 19,317,568 0 0 0 0 0 19,317,568 01-Jul-13 01-Jul-14 0 0 0 0 0 0 0 01-Jul-14 01-Jul-15 0 0 0 0 0 0 0 01-Jul-15 01-Jul-16 0 0 0 0 0 0 0 01-Jul-16 01-Jul-17 0 0 0 0 0 0 0 01-Jul-17 01-Jul-18 0 0 0 0 0 0 0 01-Jul-18 01-Jul-19 0 0 0 0 0 0 0 01-Apr-10 01-Jul-19 18,802,690 476,020 -392,110 212,039 219,003 -74 19,317,568 120,000 Jul/10-Jul/11 Jul/11-Jul/12 100,000 Jul/12-Jul/13 Jul/13-Jul/14 Jul/14-Jul/15 Jul/15-Jul/16 80,000 Jul/16-Jul/17 Jul/17-Jul/18 Jul/18-Jul/19 60,000 40,000 20,000 0 Net Natural Growth Net International Migration Net Domestic Migration / Other Source: U.S. Bureau of the Census (March 14, 2013). F:ROgburnExcelCensusEstimatesCBPopEstJul12.xls (FL), 14-03-13 Prepared by the South Florida Regional Planning Council. Page 1
- 7. South Florida and Treasure Coast Regions Components of Population Growth 2010-19 Beginning of (+) Net (+) Net (=) End of Period Period (+) Births (-) Deaths International Domestic (+) Residual Period Begin Period End Population Migration Migration Population 01-Apr-10 01-Jul-10 6,199,882 17,673 -12,764 11,197 2,295 6 6,218,289 01-Jul-10 01-Jul-11 6,218,289 71,863 -52,542 50,882 41,563 -809 6,329,246 01-Jul-11 01-Jul-12 6,329,246 71,932 -54,562 52,876 11,055 229 6,410,776 01-Jul-12 01-Jul-13 6,410,776 0 0 0 0 0 6,410,776 01-Jul-13 01-Jul-14 0 0 0 0 0 0 0 01-Jul-14 01-Jul-15 0 0 0 0 0 0 0 01-Jul-15 01-Jul-16 0 0 0 0 0 0 0 01-Jul-16 01-Jul-17 0 0 0 0 0 0 0 01-Jul-17 01-Jul-18 0 0 0 0 0 0 0 01-Jul-18 01-Jul-19 0 0 0 0 0 0 0 01-Apr-10 01-Jul-19 6,199,882 161,468 -119,868 114,955 54,913 -574 6,410,776 60,000 Jul/10-Jul/11 Jul/11-Jul/12 50,000 Jul/12-Jul/13 Jul/13-Jul/14 Jul/14-Jul/15 Jul/15-Jul/16 40,000 Jul/16-Jul/17 Jul/17-Jul/18 Jul/18-Jul/19 30,000 20,000 10,000 0 Net Natural Growth Net International Migration Net Domestic Migration / Other Source: U.S. Bureau of the Census (March 14, 2013). F:ROgburnExcelCensusEstimatesCBPopEstJul12.xls (SFTC), 14-03-13 Prepared by the South Florida Regional Planning Council. Page 1
- 8. Treasure Coast Region Components of Population Growth 2010-19 Beginning of (+) Net (+) Net (=) End of Period Period (+) Births (-) Deaths International Domestic (+) Residual Period Begin Period End Population Migration Migration Population 01-Apr-10 01-Jul-10 1,882,269 4,722 -4,759 1,741 3,623 -50 1,887,546 01-Jul-10 01-Jul-11 1,887,546 19,154 -19,197 8,171 9,246 -80 1,904,840 01-Jul-11 01-Jul-12 1,904,840 18,969 -20,026 8,532 17,527 -47 1,929,795 01-Jul-12 01-Jul-13 1,929,795 0 0 0 0 0 1,929,795 01-Jul-13 01-Jul-14 0 0 0 0 0 0 0 01-Jul-14 01-Jul-15 0 0 0 0 0 0 0 01-Jul-15 01-Jul-16 0 0 0 0 0 0 0 01-Jul-16 01-Jul-17 0 0 0 0 0 0 0 01-Jul-17 01-Jul-18 0 0 0 0 0 0 0 01-Jul-18 01-Jul-19 0 0 0 0 0 0 0 01-Apr-10 01-Jul-19 1,882,269 42,845 -43,982 18,444 30,396 -177 1,929,795 20,000 Jul/10-Jul/11 Jul/11-Jul/12 Jul/12-Jul/13 15,000 Jul/13-Jul/14 Jul/14-Jul/15 Jul/15-Jul/16 Jul/16-Jul/17 Jul/17-Jul/18 10,000 Jul/18-Jul/19 5,000 0 Net Natural Growth Net International Migration Net Domestic Migration / Other -5,000 Source: U.S. Bureau of the Census (March 14, 2013). F:ROgburnExcelCensusEstimatesCBPopEstJul12.xls (TC), 14-03-13 Prepared by the South Florida Regional Planning Council. Page 1
- 9. Miami-Fort Lauderdale-West Palm Beach Metropolitan Statistical Area Components of Population Growth 2010-19 Beginning of (+) Net (+) Net (=) End of Period Period (+) Births (-) Deaths International Domestic (+) Residual Period Begin Period End Population Migration Migration Population 01-Apr-10 01-Jul-10 5,564,657 16,171 -11,068 10,763 1,036 41 5,581,600 01-Jul-10 01-Jul-11 5,581,600 65,656 -45,739 49,301 38,236 -1,146 5,687,908 01-Jul-11 01-Jul-12 5,687,908 65,853 -47,467 51,117 5,009 297 5,762,717 01-Jul-12 01-Jul-13 5,762,717 0 0 0 0 0 5,762,717 01-Jul-13 01-Jul-14 0 0 0 0 0 0 0 01-Jul-14 01-Jul-15 0 0 0 0 0 0 0 01-Jul-15 01-Jul-16 0 0 0 0 0 0 0 01-Jul-16 01-Jul-17 0 0 0 0 0 0 0 01-Jul-17 01-Jul-18 0 0 0 0 0 0 0 01-Jul-18 01-Jul-19 0 0 0 0 0 0 0 01-Apr-10 01-Jul-19 5,564,657 147,680 -104,274 111,181 44,281 -808 5,762,717 60,000 Jul/10-Jul/11 Jul/11-Jul/12 Jul/12-Jul/13 50,000 Jul/13-Jul/14 Jul/14-Jul/15 Jul/15-Jul/16 Jul/16-Jul/17 40,000 Jul/17-Jul/18 Jul/18-Jul/19 30,000 20,000 10,000 0 Net Natural Growth Net International Migration Net Domestic Migration / Other Source: U.S. Bureau of the Census (March 14, 2013). F:ROgburnExcelCensusEstimatesCBPopEstJul12.xls (MSA), 14-03-13 Prepared by the South Florida Regional Planning Council. Page 1
- 10. South Florida Components of Population Growth 2010-19 Beginning of (+) Net (+) Net (=) End of Period Period (+) Births (-) Deaths International Domestic (+) Residual Period Begin Period End Population Migration Migration Population 01-Apr-10 01-Jul-10 4,317,613 12,951 -8,005 9,456 -1,328 56 4,330,743 01-Jul-10 01-Jul-11 4,330,743 52,709 -33,345 42,711 32,317 -729 4,424,406 01-Jul-11 01-Jul-12 4,424,406 52,963 -34,536 44,344 -6,472 276 4,480,981 01-Jul-12 01-Jul-13 4,480,981 0 0 0 0 0 4,480,981 01-Jul-13 01-Jul-14 0 0 0 0 0 0 0 01-Jul-14 01-Jul-15 0 0 0 0 0 0 0 01-Jul-15 01-Jul-16 0 0 0 0 0 0 0 01-Jul-16 01-Jul-17 0 0 0 0 0 0 0 01-Jul-17 01-Jul-18 0 0 0 0 0 0 0 01-Jul-18 01-Jul-19 0 0 0 0 0 0 0 01-Apr-10 01-Jul-19 4,317,613 118,623 -75,886 96,511 24,517 -397 4,480,981 50,000 Jul/10-Jul/11 Jul/11-Jul/12 Jul/12-Jul/13 40,000 Jul/13-Jul/14 Jul/14-Jul/15 Jul/15-Jul/16 Jul/16-Jul/17 30,000 Jul/17-Jul/18 Jul/18-Jul/19 20,000 10,000 0 Net Natural Growth Net International Migration Net Domestic Migration / Other -10,000 Source: U.S. Bureau of the Census (March 14, 2013). F:ROgburnExcelCensusEstimatesCBPopEstJul12.xls (SF), 14-03-13 Prepared by the South Florida Regional Planning Council. Page 1
- 11. Indian River County Components of Population Growth 2010-19 Beginning of (+) Net (+) Net (=) End of Period Period (+) Births (-) Deaths International Domestic (+) Residual Period Begin Period End Population Migration Migration Population 01-Apr-10 01-Jul-10 138,028 318 -435 65 270 -9 138,237 01-Jul-10 01-Jul-11 138,237 1,274 -1,699 195 821 91 138,919 01-Jul-11 01-Jul-12 138,919 1,238 -1,798 214 2,013 -19 140,567 01-Jul-12 01-Jul-13 140,567 0 0 0 0 0 140,567 01-Jul-13 01-Jul-14 0 0 0 0 0 0 0 01-Jul-14 01-Jul-15 0 0 0 0 0 0 0 01-Jul-15 01-Jul-16 0 0 0 0 0 0 0 01-Jul-16 01-Jul-17 0 0 0 0 0 0 0 01-Jul-17 01-Jul-18 0 0 0 0 0 0 0 01-Jul-18 01-Jul-19 0 0 0 0 0 0 0 01-Apr-10 01-Jul-19 138,028 2,830 -3,932 474 3,104 63 140,567 2,500 Jul/10-Jul/11 Jul/11-Jul/12 2,000 Jul/12-Jul/13 Jul/13-Jul/14 Jul/14-Jul/15 1,500 Jul/15-Jul/16 Jul/16-Jul/17 Jul/17-Jul/18 1,000 Jul/18-Jul/19 500 0 Net Natural Growth Net International Migration Net Domestic Migration / Other -500 -1,000 Source: U.S. Bureau of the Census (March 14, 2013). F:ROgburnExcelCensusEstimatesCBPopEstJul12.xls (IR), 14-03-13 Prepared by the South Florida Regional Planning Council. Page 1
- 12. St. Lucie County Components of Population Growth 2010-19 Beginning of (+) Net (+) Net (=) End of Period Period (+) Births (-) Deaths International Domestic (+) Residual Period Begin Period End Population Migration Migration Population 01-Apr-10 01-Jul-10 277,789 722 -663 185 749 -8 278,774 01-Jul-10 01-Jul-11 278,774 3,030 -2,768 669 1,038 351 281,094 01-Jul-11 01-Jul-12 281,094 2,998 -2,865 700 1,978 -39 283,866 01-Jul-12 01-Jul-13 283,866 0 0 0 0 0 283,866 01-Jul-13 01-Jul-14 0 0 0 0 0 0 0 01-Jul-14 01-Jul-15 0 0 0 0 0 0 0 01-Jul-15 01-Jul-16 0 0 0 0 0 0 0 01-Jul-16 01-Jul-17 0 0 0 0 0 0 0 01-Jul-17 01-Jul-18 0 0 0 0 0 0 0 01-Jul-18 01-Jul-19 0 0 0 0 0 0 0 01-Apr-10 01-Jul-19 277,789 6,750 -6,296 1,554 3,765 304 283,866 2,500 Jul/10-Jul/11 Jul/11-Jul/12 Jul/12-Jul/13 2,000 Jul/13-Jul/14 Jul/14-Jul/15 Jul/15-Jul/16 Jul/16-Jul/17 Jul/17-Jul/18 1,500 Jul/18-Jul/19 1,000 500 0 Net Natural Growth Net International Migration Net Domestic Migration / Other Source: U.S. Bureau of the Census (March 14, 2013). F:ROgburnExcelCensusEstimatesCBPopEstJul12.xls (SL), 14-03-13 Prepared by the South Florida Regional Planning Council. Page 1
- 13. Martin County Components of Population Growth 2010-19 Beginning of (+) Net (+) Net (=) End of Period Period (+) Births (-) Deaths International Domestic (+) Residual Period Begin Period End Population Migration Migration Population 01-Apr-10 01-Jul-10 146,318 300 -429 87 213 -12 146,477 01-Jul-10 01-Jul-11 146,477 1,185 -1,674 407 998 -78 147,315 01-Jul-11 01-Jul-12 147,315 1,154 -1,788 426 1,716 -6 148,817 01-Jul-12 01-Jul-13 148,817 0 0 0 0 0 148,817 01-Jul-13 01-Jul-14 0 0 0 0 0 0 0 01-Jul-14 01-Jul-15 0 0 0 0 0 0 0 01-Jul-15 01-Jul-16 0 0 0 0 0 0 0 01-Jul-16 01-Jul-17 0 0 0 0 0 0 0 01-Jul-17 01-Jul-18 0 0 0 0 0 0 0 01-Jul-18 01-Jul-19 0 0 0 0 0 0 0 01-Apr-10 01-Jul-19 146,318 2,639 -3,891 920 2,927 -96 148,817 2,000 Jul/10-Jul/11 Jul/11-Jul/12 1,500 Jul/12-Jul/13 Jul/13-Jul/14 Jul/14-Jul/15 Jul/15-Jul/16 1,000 Jul/16-Jul/17 Jul/17-Jul/18 Jul/18-Jul/19 500 0 Net Natural Growth Net International Migration Net Domestic Migration / Other -500 -1,000 Source: U.S. Bureau of the Census (March 14, 2013). F:ROgburnExcelCensusEstimatesCBPopEstJul12.xls (Ma), 14-03-13 Prepared by the South Florida Regional Planning Council. Page 1
- 14. Palm Beach County Components of Population Growth 2010-19 Beginning of (+) Net (+) Net (=) End of Period Period (+) Births (-) Deaths International Domestic (+) Residual Period Begin Period End Population Migration Migration Population 01-Apr-10 01-Jul-10 1,320,134 3,382 -3,232 1,404 2,391 -21 1,324,058 01-Jul-10 01-Jul-11 1,324,058 13,665 -13,056 6,900 6,389 -444 1,337,512 01-Jul-11 01-Jul-12 1,337,512 13,579 -13,575 7,192 11,820 17 1,356,545 01-Jul-12 01-Jul-13 1,356,545 0 0 0 0 0 1,356,545 01-Jul-13 01-Jul-14 0 0 0 0 0 0 0 01-Jul-14 01-Jul-15 0 0 0 0 0 0 0 01-Jul-15 01-Jul-16 0 0 0 0 0 0 0 01-Jul-16 01-Jul-17 0 0 0 0 0 0 0 01-Jul-17 01-Jul-18 0 0 0 0 0 0 0 01-Jul-18 01-Jul-19 0 0 0 0 0 0 0 01-Apr-10 01-Jul-19 1,320,134 30,626 -29,863 15,496 20,600 -448 1,356,545 14,000 Jul/10-Jul/11 Jul/11-Jul/12 12,000 Jul/12-Jul/13 Jul/13-Jul/14 Jul/14-Jul/15 10,000 Jul/15-Jul/16 Jul/16-Jul/17 Jul/17-Jul/18 8,000 Jul/18-Jul/19 6,000 4,000 2,000 0 Net Natural Growth Net International Migration Net Domestic Migration / Other Source: U.S. Bureau of the Census (March 14, 2013). F:ROgburnExcelCensusEstimatesCBPopEstJul12.xls (PB), 14-03-13 Prepared by the South Florida Regional Planning Council. Page 1
- 15. Broward County Components of Population Growth 2010-19 Beginning of (+) Net (+) Net (=) End of Period Period (+) Births (-) Deaths International Domestic (+) Residual Period Begin Period End Population Migration Migration Population 01-Apr-10 01-Jul-10 1,748,066 5,239 -3,567 2,769 432 -11 1,752,928 01-Jul-10 01-Jul-11 1,752,928 20,834 -14,319 13,049 12,997 -533 1,784,956 01-Jul-11 01-Jul-12 1,784,956 20,892 -14,587 13,559 10,226 91 1,815,137 01-Jul-12 01-Jul-13 1,815,137 0 0 0 0 0 1,815,137 01-Jul-13 01-Jul-14 0 0 0 0 0 0 0 01-Jul-14 01-Jul-15 0 0 0 0 0 0 0 01-Jul-15 01-Jul-16 0 0 0 0 0 0 0 01-Jul-16 01-Jul-17 0 0 0 0 0 0 0 01-Jul-17 01-Jul-18 0 0 0 0 0 0 0 01-Jul-18 01-Jul-19 0 0 0 0 0 0 0 01-Apr-10 01-Jul-19 1,748,066 46,965 -32,473 29,377 23,655 -453 1,815,137 16,000 Jul/10-Jul/11 14,000 Jul/11-Jul/12 Jul/12-Jul/13 Jul/13-Jul/14 12,000 Jul/14-Jul/15 Jul/15-Jul/16 Jul/16-Jul/17 10,000 Jul/17-Jul/18 Jul/18-Jul/19 8,000 6,000 4,000 2,000 0 Net Natural Growth Net International Migration Net Domestic Migration / Other Source: U.S. Bureau of the Census (March 14, 2013). F:ROgburnExcelCensusEstimatesCBPopEstJul12.xls (Br), 14-03-13 Prepared by the South Florida Regional Planning Council. Page 1
- 16. Miami-Dade County Components of Population Growth 2010-19 Beginning of (+) Net (+) Net (=) End of Period Period (+) Births (-) Deaths International Domestic (+) Residual Period Begin Period End Population Migration Migration Population 01-Apr-10 01-Jul-10 2,496,457 7,550 -4,269 6,590 -1,787 73 2,504,614 01-Jul-10 01-Jul-11 2,504,614 31,157 -18,364 29,352 18,850 -169 2,565,440 01-Jul-11 01-Jul-12 2,565,440 31,382 -19,305 30,366 -17,037 189 2,591,035 01-Jul-12 01-Jul-13 2,591,035 0 0 0 0 0 2,591,035 01-Jul-13 01-Jul-14 0 0 0 0 0 0 0 01-Jul-14 01-Jul-15 0 0 0 0 0 0 0 01-Jul-15 01-Jul-16 0 0 0 0 0 0 0 01-Jul-16 01-Jul-17 0 0 0 0 0 0 0 01-Jul-17 01-Jul-18 0 0 0 0 0 0 0 01-Jul-18 01-Jul-19 0 0 0 0 0 0 0 01-Apr-10 01-Jul-19 2,496,457 70,089 -41,938 66,308 26 93 2,591,035 40,000 Jul/10-Jul/11 Jul/11-Jul/12 Jul/12-Jul/13 30,000 Jul/13-Jul/14 Jul/14-Jul/15 Jul/15-Jul/16 Jul/16-Jul/17 20,000 Jul/17-Jul/18 Jul/18-Jul/19 10,000 0 Net Natural Growth Net International Migration Net Domestic Migration / Other -10,000 -20,000 Source: U.S. Bureau of the Census (March 14, 2013). F:ROgburnExcelCensusEstimatesCBPopEstJul12.xls (MD), 14-03-13 Prepared by the South Florida Regional Planning Council. Page 1
- 17. Monroe County Components of Population Growth 2010-19 Beginning of (+) Net (+) Net (=) End of Period Period (+) Births (-) Deaths International Domestic (+) Residual Period Begin Period End Population Migration Migration Population 01-Apr-10 01-Jul-10 73,090 162 -169 97 27 -6 73,201 01-Jul-10 01-Jul-11 73,201 718 -662 310 470 -27 74,010 01-Jul-11 01-Jul-12 74,010 689 -644 419 339 -4 74,809 01-Jul-12 01-Jul-13 74,809 0 0 0 0 0 74,809 01-Jul-13 01-Jul-14 0 0 0 0 0 0 0 01-Jul-14 01-Jul-15 0 0 0 0 0 0 0 01-Jul-15 01-Jul-16 0 0 0 0 0 0 0 01-Jul-16 01-Jul-17 0 0 0 0 0 0 0 01-Jul-17 01-Jul-18 0 0 0 0 0 0 0 01-Jul-18 01-Jul-19 0 0 0 0 0 0 0 01-Apr-10 01-Jul-19 73,090 1,569 -1,475 826 836 -37 74,809 500 Jul/10-Jul/11 450 Jul/11-Jul/12 Jul/12-Jul/13 400 Jul/13-Jul/14 Jul/14-Jul/15 Jul/15-Jul/16 350 Jul/16-Jul/17 Jul/17-Jul/18 300 Jul/18-Jul/19 250 200 150 100 50 0 Net Natural Growth Net International Migration Net Domestic Migration / Other Source: U.S. Bureau of the Census (March 14, 2013). F:ROgburnExcelCensusEstimatesCBPopEstJul12.xls (Mo), 14-03-13 Prepared by the South Florida Regional Planning Council. Page 1