Physician-To-Population Ratio Model Limiting Access To Healthcare #4
Kaufman_et_al-2015-The_Journal_of_Rural_Health
1. ORIGINAL ARTICLE
The Rising Rate of Rural Hospital Closures
Brystana G. Kaufman, MSPH;1
Sharita R. Thomas, MPP;1
Randy K. Randolph, MRP;1
Julie R. Perry;1
Kristie W. Thompson, MA;1
George M. Holmes, PhD;1,2
& George H. Pink, PhD1,2
1 North Carolina Rural Health Research Program, Cecil G. Sheps Center for Health Services Research, University of North Carolina, Chapel Hill,
North Carolina
2 Department of Health Policy and Management, Gillings School of Global Public Health, University of North Carolina, Chapel Hill, North Carolina
Disclosures: The specific content is the sole
responsibility of the authors. The authors report
no conflicts of interest in the design and
conduct of the study; in the collection, analysis,
and interpretation of the data; and in the
preparation, editing, or censuring of the
manuscript.
Funding: This work was funded through a
cooperative agreement with the federal Office
of Rural Health Policy, Health Resources and
Services Administration, US Department of
Health and Human Services (PHS Grant No.
U1GRH07633).
For further information, contact: Kristie
Thompson, MA, NC Rural Health Research
Program, Cecil G. Sheps Center for Health
Services Research, University of North Carolina
at Chapel Hill, CB 7590, Chapel Hill, NC
27599-7590; e-mail:
Kristie_Thompson@unc.edu.
doi: 10.1111/jrh.12128
Abstract
Purpose: Since 2010, the rate of rural hospital closures has increased signifi-
cantly. This study is a preliminary look at recent closures and a formative step
in research to understand the causes and the impact on rural communities.
Methods: The 2009 financial performance and market characteristics of rural
hospitals that closed from 2010 through 2014 were compared to rural hospitals
that remained open during the same period, stratified by critical access hospi-
tals (CAHs) and other rural hospitals (ORHs). Differences were tested using
Pearson’s chi-square (categorical variables) and Wilcoxon rank test of medi-
ans. The relationships between negative operating margin and (1) market fac-
tors and (2) utilization/staffing factors were explored using logistic regression.
Findings: In 2009, CAHs that subsequently closed from 2010 through 2014
had, in general, lower levels of profitability, liquidity, equity, patient volume,
and staffing. In addition, ORHs that closed had smaller market shares and op-
erated in markets with smaller populations compared to ORHs that remained
open. Odds of unprofitability were associated with both market and utilization
factors. Although half of the closed hospitals ceased providing health services
altogether, the remainder have since converted to an alternative health care
delivery model.
Conclusions: Financial and market characteristics appear to be associated
with closure of rural hospitals from 2010 through 2014, suggesting that it is
possible to identify hospitals at risk of closure. As closure rates show no sign of
abating, it is important to study the drivers of distress in rural hospitals, as well
as the potential for alternative health care delivery models.
Key words access to care, economics, health care financing, hospitals, policy.
The rate of rural hospital closures is accelerating. In 2013
and 2014, the number of rural, short-term acute hospi-
tal closures was more than twice the number in 2011
and 2012. Based on our estimates of the 47 communities
served by these closed hospitals, over 1.7 million people
are now at greater risk of negative health and economic
hardship due to the loss of local acute care services. The
impact of rural hospital closures is of particular concern
because residents of rural communities are typically older
and poorer, more dependent on public insurance pro-
grams, and in worse health than urban residents.1-3
Poli-
cymakers, researchers, and rural residents are concerned
and interested in determining why these hospitals are
closing, whether the rate will continue to climb, and what
effects there could be on local health care providers and
the communities they serve.
Although rural hospital closures have been promi-
nent in many recent news stories, they are not a new
phenomenon—rural areas have been losing hospitals for
decades. After the Medicare Prospective Payment Sys-
tem (PPS) for inpatient services was implemented in
1983, the risk of negative impact on rural hospitals was
identified.4-6
Interest in closures was sufficiently strong
that the US Health and Human Services Office of the
The Journal of Rural Health 00 (2015) 1–9 c 2015 National Rural Health Association 1
2. The Rising Rate of Rural Hospital Closures Kaufman et al.
Inspector General published annual updates of hospital
closures in the late 1980s and early 1990s. Lillie-Blanton
et al5
were among the first to examine rural and ur-
ban closures in the late 1980s and found that the odds
of closure in rural and urban areas differed significantly
for private nonprofit hospitals. Poley and Ricketts6
exam-
ined rural hospital closures and found that, during the
1990s, a total of 460 general hospitals across the United
States closed; of these, 35% were located in rural ar-
eas. As the rate of hospital closures increased throughout
the 1990s, studies consistently found that smaller hospi-
tals were more likely to close, putting rural hospitals at
greater risk for closure.5,7,8
Concerns about the financial viability of small rural
hospitals led to the implementation of the Medicare Ru-
ral Hospital Flexibility Program (Flex Program) of 1997,
which allows facilities designated as critical access hospi-
tals (CAHs) to be paid on a reasonable cost basis for inpa-
tient and outpatient services. At least 1 study of CAHs
found that the Flex Program prevented the closure of
many rural hospitals.7
As the rate of closures diminished
during the 2000s, attention to the causes and effects of
closures decreased. Although cost-based reimbursement
may still provide a protective effect, the health care in-
dustry is facing a rapidly changing regulatory and eco-
nomic environment, largely due to the implementation
of the Affordable Care Act (ACA). These additional pres-
sures along with the recent upturn in closure rates have
renewed concern for the viability of rural hospitals in an
era of population health, where focus has shifted to value.
The causes of the recent upturn in rural hospital clo-
sures are not yet well understood. This study is a look
at recent closures and a formative step in research to
understand the phenomenon and the impact on rural
communities. More specifically, this study compares the
financial and market characteristics of rural hospitals that
closed from 2010 through 2014 to rural hospitals that re-
mained open during the same period. In addition, market
and utilization factors that are associated with profitabil-
ity during this time period are explored.
Factors Associated With Hospital
Closure
Previous studies of rural hospital closures have found that
associated factors can be grouped into 2 general cate-
gories: internal (hospital) factors and external (market)
factors.7-18
Hospital factors associated with rural hospi-
tal closures include poor financial health, aging facilities,
low occupancy rates, difficulty recruiting and retaining
health care professionals, fewer medical services, and a
small proportion of outpatient revenue.8-10
Each of these
factors reduces profitability, which is one of the most con-
sistent predictors of closure and financial distress.7,11
Market factors associated with rural hospital closures
include socioeconomic factors as well as measures of
competition. Hospitals in markets with high proportions
of Medicaid or racial and ethnic minority residents, as
well as markets with high poverty or uninsured rates,
have higher risk of closure.7,12,13
Measures of competi-
tion associated with closure and distress include indus-
try concentration, distance to competitors, and market
share.13-15
Although for-profit hospitals were more likely
to close in the past, rates of closures and ownership
changes for public facilities may be increasing.9,10,14,16
Study Data and Methods
Sample of Closed and Open Rural Hospitals
For this study, rural hospitals were defined as short-term,
nonfederal general facilities located outside Metropoli-
tan Core-Based Statistical Areas (CBSAs) or within
Metropolitan areas and having Rural-Urban Commuting
Area (RUCA) codes of 4 or greater or with CAH status;
this is the definition used by the federal Office of Rural
Health Policy,i
among other federal programs.
Critical Access Hospitals and Other Rural
Hospitals
Because CAHs are different from other rural hospi-
tals (ORHs) in many respects, rural hospitals were clas-
sified into 2 subgroups for this analysis: CAHsii
and
ORHs, which include PPS, Medicare-Dependent Hospitals
(MDHs),iii
Sole Community Hospitals (SCHs),iv
and Rural
Referral Centers (RRCs). Eligibility for the CAH, MDH,
SCH, and RRC designations is based on several factors,
including size and location.17
Definition of Closure
“Closure” was defined as the cessation of acute inpa-
tient services by a hospital. Thirty-three potential clo-
sures from 2010 through 2013 were identified from CMS
Provider of Services (POS) data. To confirm closure, web-
sites (hospital, local news, and social media) and newspa-
per databases (America’s News) were searched. In some
cases, hospital representatives were contacted. Thirty of
the 33 closures in the POS data were confirmed. For clo-
sures in 2014, secondary data were not yet available;
thus the only possible method was search of websites
and newspaper databases. Seventeen rural hospital clo-
sures were identified through the end of 2014. A total of
2 The Journal of Rural Health 00 (2015) 1–9 c 2015 National Rural Health Association
3. Kaufman et al. The Rising Rate of Rural Hospital Closures
47 rural hospital closures from January 2010 through De-
cember 2014 were confirmed.18
Sample for Comparison of Hospital Variables
The hospital characteristics of rural hospitals that closed
between January 2010 and December 2014 were com-
pared to hospitals that remained open during the same
period. Stable financial, utilization, and staffing ratios re-
quire a full year of data: of the 2,413 total observations,
65 were excluded because the 2009 Medicare Cost Report
had fewer than 360 days in the reporting period. The final
sample for this analysis included 42 closed rural hospitals
(27 ORHs and 15 CAHs) and 2,306 open rural hospitals
(1,061 ORHs and 1,245 CAHs).
Sample for Comparison of Market Variables
Market characteristics of rural hospitals that closed in
2010 through 2014 were compared to those that re-
mained open during the same period. There was no mar-
ket information for 2 of the closed hospitals during the
study period. Thus, the sample for comparison of market
variables included 45 closed rural hospitals (30 ORH and
15 CAH) and 2,368 open rural hospitals (1,095 ORH and
1,273 CAH).
Study Variables
Hospital Variables
There are many dimensions to a hospital’s financial con-
dition, so several financial ratios are commonly needed
to assess performance and condition of hospitals.19
These
measures, outlined in Table 1, include various measures
of profitability, liquidity, capital structure, revenue, uti-
lization, and staffing.
Market Variables
To describe the characteristics of the community served
by the hospital, measures of population, socioeconomic
status, distance to other hospitals, and market share were
calculated. Hospital market areas were composed using
Medicare discharge counts by ZIP code from the CMS
Hospital Service Area File. A ZIP code is included in the
market if, when sorted in descending number of that hos-
pital’s Medicare discharges, it is among the ZIP codes that
comprise the first 75% of that hospital’s Medicare dis-
charges or if it contributes at least 3% of that hospital’s
Medicare admissions for the year. Except for hospitals in
Alaska and Hawaii, ZIP codes more than 150 miles from
the hospital are disqualified from being in its market. The
market areas are not specified to be mutually exclusive,
exhaustive or contiguous. Low population or low Medi-
care population ZIP code areas in otherwise dense areas
are more likely to be excluded from a market based on
this definition.
Averages for market variables were calculated as
the population-weighted average of the ZIP code data
(Nielsen-Claritas PopFacts). We determined the distance
from each rural hospital to the next closest operating
hospital using straight-line distance between coordinates
geocoded from CMS addresses. The status of Medicaid
expansion19
was a state-level variable.
Methods
The final analytical file combined the Hospital Cost Re-
port Information System (HCRIS; financial and utiliza-
tion) data, the POS data file (size, location, address), the
Hospital Service Area File (patient origin, market vari-
ables), and the Nielsen-Claritas PopFacts database. The
postclosure use of closed hospitals was determined by
searching websites (hospital, television news, and social
media), newspaper databases, and through direct contact
with hospital representatives (telephone call or e-mail).
Data were categorized into the 2 previously described
groups based on payment methodology: CAH and ORH.
Within each group, we compared closed and open rural
hospitals in 2009, the year immediately prior to the study
period of 2010-2014. Differences between the groups
were tested using Pearson’s chi-square (categorical vari-
ables) and Wilcoxon rank test of medians (continuous);
0.05 was used as the probability of Type I error.
Because previous research has identified the limi-
tations of logistic analysis with rare (<5%) events,20
we modeled the more common event of negative op-
erating margin, which is a strong predictor of future
closure.17,21-24
We used logistic regression to evaluate the
relationship between negative operating margin and (1)
market variables and (2) utilization/staffing variables for
the 2009-2013 hospital-year observations. Each group
was modeled separately because market factors influence
profitability, in part, through utilization factors. Percent
unemployed was excluded due to the high correlation
with percent poverty (rho = 0.57).
Study Results
Description of Closed Hospitals
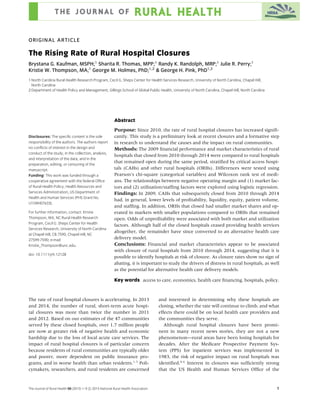
Figure 1 presents the location of all 47 rural hospital clo-
sures from January 2010 through December 2014. Based
on census regions, the majority occurred in the South
(64%), while only 9 occurred in the Midwest (19%)
The Journal of Rural Health 00 (2015) 1–9 c 2015 National Rural Health Association 3
4. The Rising Rate of Rural Hospital Closures Kaufman et al.
Table 1 Definitions of Hospital Variables
Variable Operational Definition
Profitability variables
Operating margin Operating income / Operating revenue Measures the control of operating expenses
relative to operating revenue (net patient and
other revenue). A positive value indicates
operating expenses are less than operating
revenue (an operating profit).
Total margin Net income / Total revenue Measures the control of expenses relative to
revenues. A positive value indicates total
expenses are less than total revenues (a profit).
Liquidity variables
Current ratio Current assets / Current liabilities Measures the number of times short-term
obligations can be paid using short-term
assets. Values greater than 1 indicate current
assets are greater than current liabilities.
Days cash on hand [(Cash + Marketable securities + Unrestricted
investments) / (Total expenses – Depreciation)] /
Days in period
Measures the number of days an organization
could operate if no cash were collected or
received.
Capital structure variables
Equity financing Net assets / Total assets Measures the percentage of total assets financed
by equity.
Debt service coverage [Net income + depreciation + income expense] /
[Short-term notes and loans payable × (days in
production / 365) + Interest expense]
Measures the cash inflow per dollar of principal
payments and interest expense. A positive
value greater than 1 indicates cash flow greater
than current fixed charge payments.
Revenue variables
Outpatient to total revenue Total outpatient revenue / Total patient revenue Measures the percentage of total revenues for
outpatient services (including, e.g., Rural
Health Clinics). A value greater than 50%
indicates that the majority of total patient
revenues is for outpatient services.
Medicare inpatient payer mix Medicare inpatient days / (Total inpatient days –
Nursery bed days – NF/Swing bed days)
Measures the percentage of total inpatient days
that is provided to Medicare patients. A value
greater than 50% indicates that the majority of
inpatient days is for Medicare patients. Very
high values may indicate lack of financial
diversification due to high dependence on
Medicare reimbursement.
Medicare outpatient payer mix Hospital outpatient Medicare charges / Hospital total
outpatient charges
Measures the percentage of total outpatient
charges that is for Medicare patients. A value
greater than 50% indicates that the majority of
outpatient charges is for Medicare patients.
Utilization variables
Acute ADC Inpatient acute care bed days / Days in period A high value indicates high use of acute care beds.
Occupancy rate Inpatient days of care / Bed days available
Obstetrics volume Labor, delivery, and nursery charges / Total charges
Surgery volume Surgery and recovery charges / Total charges
Staffing variables
Number of FTEs FTEs are the full-time equivalent positions
Average salary per FTE Salary expense / Number of FTEs
Source: The Critical Access Hospitals Financial Indicators Report, 11th Issue. Flex Monitoring Team, Oct 2014.
and 4 each in the Northeast (8.5%) and West (8.5%).
Roughly two-thirds of closures occurred in Medicaid non-
expansion states (66%). Seventeen closures were CAHs
and 30 were ORHs. Twenty-six of the 47 closed hospitals
no longer provided any health services, and the rest con-
tinued to provide some type of health care to their com-
munity. Generally, the converted facilities provided 1 of
3 types of services: emergency or urgent care (N = 10),
outpatient or primary care (N = 7), and skilled nursing or
rehabilitation services (N = 4).
4 The Journal of Rural Health 00 (2015) 1–9 c 2015 National Rural Health Association
5. Kaufman et al. The Rising Rate of Rural Hospital Closures
Figure 1 Location of All Rural Hospitals That Closed Between January 2010 and December 2014.
Source: Authors’ search for closed hospitals and analysis of the Centers for Medicare and Medicaid Services POS data file for the 4th Quarter of 2013,
Hospital Cost Report data file for the 2nd Quarter of 2014, and PSF for the 2nd Quarter of 2014; the US Census Bureau’s CBSA for 2013; the US Department
of Agriculture, Economic Research Service’s RUCA Codes for 2013; and Pitney-Bowes Location Intelligence MapMarker USA v26.1.
Hospital Factors (see Table 1 for
definitions)
Profitability
As shown in Table 2, the 2009 operating margin and total
margin were both significantly lower in closed hospitals
compared to open hospitals. Furthermore, the differences
were considerable in magnitude (5-9 percentage points):
the median closed hospitals had a substantial negative op-
erating and total margin, while the median open hospitals
had a small positive operating and total margin.
Liquidity
The 2009 current ratio and days’ cash on hand were
significantly lower in closed hospitals compared to open
hospitals. The median closed CAH had a current ratio less
than 1.0 (current assets are less than current liabilities),
while the median open CAH had a relatively healthy
current ratio of 2.27. However, the median closed ORH
and CAH had only enough days’ cash on hand to oper-
ate for 8.33 days and 14.67 days, respectively. Thus, low
hospital liquidity in 2009 was associated with increased
risk of subsequent closure.
Capital Structure
In 2009, closed hospitals had higher debt levels than open
hospitals. The 2009 equity financing ratio and debt ser-
vice coverage were significantly lower in closed hospitals
compared to open hospitals. Furthermore, the median
closed ORH had a negative debt service coverage ratio
(cash flow was less than current fixed charge payments),
while the median open ORH had a relatively healthy debt
service coverage ratio of 3.35.
Revenue
Outpatient to total revenue (the percentage of total rev-
enues for outpatient services, including Rural Health
Clinics, free-standing clinics, and home health clinics)
was significantly lower in closed CAHs than in open
CAHs. Medicare inpatient payer mix was significantly
higher among closed ORHs than in open ORHs.
The Journal of Rural Health 00 (2015) 1–9 c 2015 National Rural Health Association 5
6. The Rising Rate of Rural Hospital Closures Kaufman et al.
Table 2 The 2009 Medians of Hospital Variables for Rural Hospitals That Closed and Remained Open From 2010 Through 2014
Medians for ORHs Medians for CAHs
Closed Open P Value Closed Open P Value
Profitability:
1. Operating margin −7.41% 2.00% .0054 −7.56% 0.46% .0194
2. Total margin −6.14% 1.94% .0054 −3.85% 1.84% .0690
Liquidity:
3. Current ratio 1.34 2.23 .1740 0.95 2.27 .0001
4. Days cash on hand 8.33 54.93 .0035 14.67 65.43 .0043
Capital structure:
5. Equity financing 0.17 0.58 .0320 0.12 0.58 .0043
6. Debt service coverage −0.78 3.35 .0042 0.91 2.69 .1628
Revenue:
7. Outpatient / total revenue 61% 59% .4243 58% 71% .0043
8. Medicare inpatient payer mix 65% 54% .0035 81% 73% .4340
9. Medicare outpatient payer mix 20% 21% .3323 37% 36% .4358
Utilization:
10. Acute ADC 8.50 25.93 <.0001 3.94 4.21 .7951
11. Occupancy rate 20.25% 39.64% <.0001 17.29% 19.21% .1951
12. Obstetrics volume <.01% 0.97% .0002 <.01% <.01% .0295
13. Surgery volume 7.25% 10.22% .0321 1.21% 5.61% .0043
Staffing:
14. Number of FTEs 105 383 .0001 141 141 .7951
15. Average salary per FTE 42,468 48,187 .0035 37,681 45,130 .0194
N = 27 N = 1061 N = 15∗
N = 1245
∗
One CAH closure was paid under PPS in 2009.
Source: Authors’ analysis of the Centers for Medicare and Medicaid Services POS data file for the 4th Quarter of 2013 and Hospital Cost Report data file
for the 2nd Quarter of 2014.
Utilization
Closed hospitals, closed ORHs in particular, had lower uti-
lization. Acute average daily census and occupancy rate
were both lower in closed ORHs than in open ORHs. Ob-
stetrics volume (the percentage of total charges that were
for obstetrics patients) was lower in closed ORHs, and
surgery volume (the percentage of total charges that was
for surgery patients) was lower in closed CAHs.
Staffing
The 2009 number of hospital full-time equivalents (FTEs)
was significantly lower in closed ORHs compared to open
ORHs. Average salary per FTE was significantly lower
among both closed CAHs and ORHs compared to open
hospitals.
Market Factors
Table 3 compares the medians of market variables be-
tween the open and closed rural hospitals. In gen-
eral, differences in market factors between open and
closed hospitals were smaller than differences in hospital
factors. The markets of open and closed hospitals had
a similar proportion of population age 65 and older,
poverty rate, and unemployment rate. However, closed
ORHs had lower population markets and lower market
shares than ORHs that remained open. Closed CAHs were
nearer to a larger (more than 100 beds) hospital than
CAHs that remained open.
Factors Associated With Unprofitability
The relationships between negative operating margin and
(1) market factors and (2) utilization/staffing factors for
the years 2009 to 2013 were explored using 2 logistic re-
gression models. As shown in Table 4, each market factor
is significant in the logistic analysis (P < .01). Odds of
unprofitability increase with proportion of residents over
age 65, proportion of households in poverty, and popu-
lation density. An increase in total population of 10,000
reduces odds by 4%. Controlling for other market fac-
tors, a 10-mile increase in distance to the nearest hospital
or the nearest hospital with more than 100 beds increases
odds of unprofitability by 8% and 2%, respectively. In the
utilization/staffing analysis, odds of unprofitability are
6 The Journal of Rural Health 00 (2015) 1–9 c 2015 National Rural Health Association
7. Kaufman et al. The Rising Rate of Rural Hospital Closures
Table 3 The 2009 Medians of Market Variables for Rural Hospitals That Closed and Remained Open From 2010 Through 2014
Medians for ORHs Medians for CAHs
Closed Open P Value Closed Open P Value
Population:
1. Total population 34,402 74,757 <.0001 16,742 19,510 .800
2. % Population age 65 and older 16.7% 15.3% .060 15.7% 16.7% .440
Socioeconomic status:
3. % Families below poverty 13.0% 11.1% .140 14.3% 9.5% .190
4. % Unemployed 5.8% 6.0% .710 5.5% 5.2% .070
Distance:
5. Nearest hospital (miles) 14.4 16.8 .060 13.0 18.1 .070
6. Nearest hospital with more than 100 beds (miles) 25.0 28.8 .460 28.4 35.2 <.0001
Market share 17.4% 26.5% <.0001 19.9% 23.0% .440
N = 30 N = 1,095 N = 15∗
N = 1,273
∗
One CAH closure was paid under PPS in 2009.
Source: Authors’ analysis of the Centers for Medicare and Medicaid Services POS data file for the 4th Quarter of 2013, Hospital Service Area Files for
2008-2013; Nielsen-Claritas Pop-Facts Databases for 2008-2014; and Pitney-Bowes Location Intelligence MapMarker USA v26.1.
Table 4 Factors Associated With Negative Operating Margin from 2009 Through 2013
Market Factors Associated With Utilization Factors Associated With
Negative Operating Margin (N = 11,555) Negative Operating Margin (N = 11,538)
Independent Variable Odds Ratio Confidence Interval Independent Variable Odds Ratio Confidence Interval
Total population (per 10,000) 0.96∗∗
(0.95-0.96) Outpatient / Total revenue 0.18∗∗
(0.13-0.24)
Population density 1.01∗∗
(1.01-1.02) Medicare inpatient payer mix 1.01 (0.71-1.45)
% Population age 65 and older 1.05∗∗
(1.04-1.06) Medicare outpatient payer mix 0.55∗∗
(0.37-0.84)
% Families below poverty 1.04∗∗
(1.04-1.05) Acute ADC 0.99∗∗
(0.99-1.00)
Patient to hospital (per 10 miles) 0.93∗∗
(0.88-0.98) Occupancy rate 0.99∗∗
(0.98-0.99)
Nearest hospital (per 10 miles) 1.08∗∗
(1.03-1.13) Obstetrics volume 0.91∗∗
(0.87-0.95)
Nearest hospital with more than 100
beds (per 10 miles)
1.02∗∗
(1.01-1.03) Surgery volume 0.96∗∗
(0.95-0.96)
Market share (%) 0.98∗∗
(0.98-0.98) Number of FTEs 1 (1.00-1.00)
Average salary per FTE 1 (1.00-1.00)
Constant 0.33∗∗
(0.25-0.43) Constant 7.40∗∗
(5.21-10.51)
∗∗
P < .01.
reduced as proportions of revenues from outpatient, ob-
stetrics, and surgery increase (OR = 0.18, 0.91, and 0.96,
respectively), suggesting the importance of these 3 ser-
vice lines in remaining profitable. Similarly, higher occu-
pancy rates and acute average daily census each reduce
the odds of unprofitability (OR = 0.99 and 0.99). Neither
of the staffing variables is significant.
Discussion
Closure of acute inpatient facilities is a serious but not
a wholly unexpected outcome at this point in the evo-
lution of the health care system. Potential contributors to
the increased rate of closure include population decreases
in rural communities, lower rates of inpatient utilization,
the ACA, and other elements of market reform.25
Simi-
lar to findings in prior literature, hospitals that closed in
the 2010-2014 period were struggling financially in 2009.
These results are consistent with media reports that re-
cent closures of rural hospitals are motivated, in part, by
poor financial performance. Hospitals with higher out-
patient, surgery and obstetric volumes are more likely
to be profitable and remain open. Surprisingly, the me-
dian market demographics of closed hospitals are similar
to those of open hospitals, although hospitals that serve
communities with a higher percentage of elderly or poor
residents are more likely to have a negative operating
margin.
This study is a preliminary look at the rising rate
of rural hospital closures. We do not yet have a clear
The Journal of Rural Health 00 (2015) 1–9 c 2015 National Rural Health Association 7
8. The Rising Rate of Rural Hospital Closures Kaufman et al.
understanding of the causes or outcomes of this phe-
nomenon, as many potential drivers are confounded. For
example, although closing hospitals are more likely to be
located in a state not expanding Medicaid, they are also
more likely to be in the South, which historically has
lower profitability.26
Separating the relative importance
of these multiple factors is important to understanding
the issue, but it is challenging with a relatively small
number of closures.
While understanding the causes of closure in rural
hospitals is important, another urgent need is to exam-
ine alternative models for the delivery of health ser-
vices in rural communities. In this study, 3 types of al-
ternative health care models were identified as common
strategies following the closure of inpatient facilities, in-
cluding emergency or urgent care facilities, outpatient
centers, and skilled nursing facilities. These models may
mitigate the negative impact of hospital closure on ru-
ral communities by improving access to health services,
providing employment, and reconceiving the rural health
paradigm.
After the closure of inpatient services, alternative
health care delivery models offer the potential to re-
tain local access to some health care services as well as
soften the economic impact of closure on the commu-
nity. Among the 47 communities experiencing hospital
closure, 10 continue to receive emergency or urgent care
services from the converted facility. In the other service
areas, residents are estimated to be 13 aerial miles, on
average, farther away from emergency care. In addition,
hospitals are often the largest or the second largest em-
ployer in their communities, so the closure of the only
hospital in the county can have negative economic effects
on a rural community.27,28
Though a postclosure health
care model may retain some employees, the short- and
long-term economic and health impacts of conversion
from inpatient facility to an alternative model have not
been explored.
Further knowledge about the financial viability of al-
ternative models would be valuable for hospital adminis-
trators considering closure of inpatient facilities. In the
wake of closure, these entities are particularly likely
to face challenges recruiting providers. Previous studies
have found that communities where the hospital has
closed have difficulty recruiting and retaining physicians
and other providers.29
Additional challenges may include
maximizing value-based payment strategies and retaining
market share despite a limited range of services. Finally,
it may be beneficial to redesign rural health care policy
and reimbursement within a post-ACA environment, for
example, improving telehealth payment strategies.
As closure rates show no sign of abating, it is important
to study the drivers of financial distress in rural hospitals,
as well as the potential for alternative health care delivery
models. Continued monitoring of hospital closures will be
important as policy makers debate payment reforms and
their effects on the economic and medical well-being of
rural communities.
Data Sources
POS data file for the 4th Quarter of 2013; US Department
of Health and Human Services, Centers for Medicare
and Medicaid Services, Office of Information Services.
Hospital Cost Report data file for the 2nd Quarter of 2014;
HCRIS; US Department of Health and Human Services,
Centers for Medicare and Medicaid Services.
Provider-Specific File (PSF) for the 2nd Quarter of 2014;
HCRIS; US Department of Health and Human Services,
Centers for Medicare and Medicaid Services.
Hospital Service Area Files for 2008-2013; US Depart-
ment of Health and Human Services, Centers for Medi-
care and Medicaid Services, Office of Information Ser-
vices.
CBSAs for 2013; US Office of Management and Budget
and US Census Bureau; 2013.
RUCA Codes for 2013; US Department of Agriculture,
Economic Research Service; 2013.
Pop-Facts Databases for 2008-2014; Nielsen-Claritas;
2008-2014.
MapMarker USA v26.1; Pitney-Bowes Location Intelli-
gence; January 2014.
Endnotes
i. Defining the rural population: http://www.hrsa.gov/
ruralhealth/policy/definition_of_rural.html.
ii. CAHs have no more than 25 beds, have a maximum
average length of stay of 4 days, and are a minimum
distance from another facility or are deemed a “neces-
sary provider,” whereas ORHs do not face these spe-
cific requirements.
iii. Medicare-dependent, small rural hospitals are defined
by 42 CFR § 412.108.
iv. SCHs are defined by 42 CFR § 412.92.
References
1. National Rural Health Snapshot; 2010. Available at:
http://www.ruralhealthweb.org/go/left/about-rural-
health. Accessed October 15, 2014.
2. Newkirk V, Damico A. The Affordable Care Act and Insurance
Coverage in Rural Areas. Issue Brief; 2014. Available at:
http://kff.org/uninsured/issue-brief/the-affordable-care-
act-and-insurance-coverage-in-rural-areas/. Accessed
April 1, 2015.
8 The Journal of Rural Health 00 (2015) 1–9 c 2015 National Rural Health Association
9. Kaufman et al. The Rising Rate of Rural Hospital Closures
3. The 2014 Update of the Rural-Urban Chartbook; 2014.
Available at: http://www.ruralhealthresearch.
org/publications/940. Accessed April 1, 2015.
4. Rosko MD, Broyles RW. Unintended consequences of
prospective payment: erosion of hospital financial
position and cost shifting. Health Care Manage Rev.
1984;9(3):35-43.
5. Mullner RM, McNeil D. Rural and urban hospital
closures: a comparison. Health Aff (Millwood).
1986;5(3):131-141.
6. Mullner RM, Whiteis DS. Rural community hospital
closure and health policy. Health Policy. 1988;10(2):
123-135.
7. Liu L-L, Jervis KJ, Younis MZ, Forgione DA. Hospital
financial distress, recovery and closures: managerial
incentives and political costs. Journal of Public Budgeting,
Accounting & Financial Management. 2011;23(1):31-68.
8. Chan B, Feldman R, Manning WG. The effects of group
size and group economic factors on collaboration: a study
of the financial performance of rural hospitals in
consortia. Health Serv Res. 1999;34(1 Pt 1):9-31.
9. Williams D, Hadley J, Pettengill J. Profits, community
role, and hospital closure: an urban and rural analysis.
Med Care. 1992;30(2):174-187.
10. Ciliberto F, Lindrooth RC. Exit from the hospital industry.
Econ. Inq. 2007;45(1):71-81.
11. Lynn M, Wertheim P. Key financial ratios can foretell
hospital closures. Healthcare Fin Manag. 1993;7(11):66-70.
12. Ko M, Derose KP, Needleman J, Ponce NA. Whose social
capital matters? The case of U.S. urban public hospital
closures and conversions to private ownership. Soc Sci
Med. 2014;114:188-196.
13. Hsia RY, Kellermann AL, Shen YC. Factors associated
with closures of emergency departments in the United
States. JAMA. 2011;305(19):1978-1985.
14. Succi MJ, Lee SY, Alexander JA. Effects of market
position and competition on rural hospital closures.
Health Serv Res. 1997;31(6):679-699.
15. McCue MJ, Clement JP. Assessing the characteristics of
hospital bond defaults. Med Care. 1996;34(11):1121-1134.
16. Needleman J, Ko M. The Health Care Safety Net in a
Post-Reform World, Chapter 9. Rutgers, NJ: The State
University; 2012.
17. Trussel J, Patrick P, DelliFraine J, Davis L. Rural Hospital
Financial Conditions: Evaluating Financial Distress in Rural
Pennsylvania Hospitals & An Analysis of Rural Hospital
Financial Conditions. Rural Assistance Center: Harrisburg,
PA: Center For Rural Pennsylvania; 2010.
18. Rural Hospital Closures; 2014. Available at: http://www.
shepscenter.unc.edu/programs-projects/rural-health/
rural-hospital-closures/. Accessed January 16, 2014.
19. Status of State action on the Medicaid expansion decision
as of December 17, 2014. Available at: http://kff.org/
health-reform/state-indicator/state-activity-around-
expanding-medicaid-under-the-affordable-care-act/.
Accessed January 16, 2015.
20. King G, Zeng L. Logistic regression in rare events data.
Political Analysis. 2001;9(2):137-163.
21. Ly DP, Jha AK, Epstein AM. The association between
hospital margins, quality of care, and closure or other
change in operating status. J Gen Intern Med.
2011;26(11):1291-1296.
22. McCue MJ. The use of cash flow to analyze financial
distress in California hospitals. Hosp Health Serv Adm.
1991;36(2):223-241.
23. Kane NM. Hospital profits, a misleading measure of
financial health. J Am Health Policy. 1991;1(1):27-35.
24. Kim TH. Factors associated with financial distress of
nonprofit hospitals. Health Care Manag (Frederick).
2010;29(1):52-62.
25. O’Donnell J, Ungar L. Rural hospitals in critical condition.
USA Today. 2014.
26. Pink G, Freeman V, Randolph R, Holmes G. Geographic
Variation in the Profitability of Critical Access Hospitals.
Findings Brief. Chapel Hill, NC: NC Rural Health Research
Program; 2013.
27. Holmes GM, Slifkin RT, Randolph RK, Poley S. The effect
of rural hospital closures on community economic health.
Health Serv Res. 2006;41(2):467-485.
28. American Hospital Association. Trendwatch: The Opport-
unities and Challenges for Rural Hospitals in an Era of Health
Reform. Chicago, IL: American Hospital Association;
2011.
29. Reif SS, DesHarnais S, Bernard S. Community
perceptions of the effects of rural hospital closure on
access to care. J Rural Health. 1999;15(2):202-209.
The Journal of Rural Health 00 (2015) 1–9 c 2015 National Rural Health Association 9