ACHARYA n.G. RANGAAGRICULTURAL UNIVERSITY
S.V. AGRICULTURAL COLLEGE, TIRUPATI
DEPARTMENT OF AGRONOMY
:ORGANIC FARMING – PRINCIPLES AND FUTURE PROSPECTS
COURSE TITLE: PRINCIPLES AND PRACTICES OF SOIL
FERTILITY AND NUTRIENT MANAGEMENT
SUBMITTED TO
Dr. A. V. NAGAVANI
PROFESSOR
SUBMITTED BY
C. Akhil Sai
TAM/2024 -01 1
3.
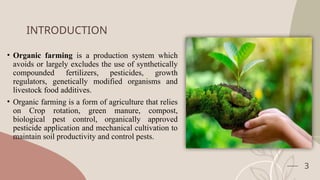
INTRODUCTION
• Organic farmingis a production system which
avoids or largely excludes the use of synthetically
compounded fertilizers, pesticides, growth
regulators, genetically modified organisms and
livestock food additives.
• Organic farming is a form of agriculture that relies
on Crop rotation, green manure, compost,
biological pest control, organically approved
pesticide application and mechanical cultivation to
maintain soil productivity and control pests.
3
Need For OrganicFarming
5
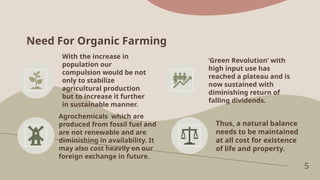
With the increase in
population our
compulsion would be not
only to stabilize
agricultural production
but to increase it further
in sustainable manner.
‘Green Revolution’ with
high input use has
reached a plateau and is
now sustained with
diminishing return of
falling dividends.
Agrochemicals which are
produced from fossil fuel and
are not renewable and are
diminishing in availability. It
may also cost heavily on our
foreign exchange in future.
Thus, a natural balance
needs to be maintained
at all cost for existence
of life and property.
6.
Scope of OrganicFarming
6
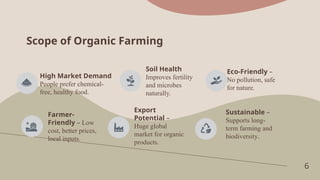
High Market Demand
People prefer chemical-
free, healthy food.
Soil Health
Improves fertility
and microbes
naturally.
Eco-Friendly –
No pollution, safe
for nature.
Farmer-
Friendly – Low
cost, better prices,
local inputs.
Export
Potential –
Huge global
market for organic
products.
Sustainable –
Supports long-
term farming and
biodiversity.
7.
7
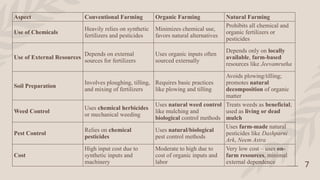
Aspect Conventional FarmingOrganic Farming Natural Farming
Use of Chemicals
Heavily relies on synthetic
fertilizers and pesticides
Minimizes chemical use,
favors natural alternatives
Prohibits all chemical and
organic fertilizers or
pesticides
Use of External Resources
Depends on external
sources for fertilizers
Uses organic inputs often
sourced externally
Depends only on locally
available, farm-based
resources like Jeevamrutha
Soil Preparation
Involves ploughing, tilling,
and mixing of fertilizers
Requires basic practices
like plowing and tilling
Avoids plowing/tilling;
promotes natural
decomposition of organic
matter
Weed Control
Uses chemical herbicides
or mechanical weeding
Uses natural weed control
like mulching and
biological control methods
Treats weeds as beneficial;
used as living or dead
mulch
Pest Control
Relies on chemical
pesticides
Uses natural/biological
pest control methods
Uses farm-made natural
pesticides like Dashparni
Ark, Neem Astra
Cost
High input cost due to
synthetic inputs and
machinery
Moderate to high due to
cost of organic inputs and
labor
Very low cost – uses on-
farm resources, minimal
external dependence
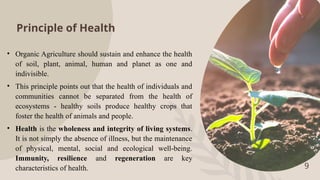
Principle of Health
•Organic Agriculture should sustain and enhance the health
of soil, plant, animal, human and planet as one and
indivisible.
• This principle points out that the health of individuals and
communities cannot be separated from the health of
ecosystems - healthy soils produce healthy crops that
foster the health of animals and people.
• Health is the wholeness and integrity of living systems.
It is not simply the absence of illness, but the maintenance
of physical, mental, social and ecological well-being.
Immunity, resilience and regeneration are key
characteristics of health. 9
10.
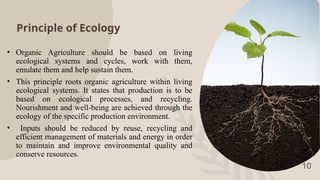
Principle of Ecology
•Organic Agriculture should be based on living
ecological systems and cycles, work with them,
emulate them and help sustain them.
• This principle roots organic agriculture within living
ecological systems. It states that production is to be
based on ecological processes, and recycling.
Nourishment and well-being are achieved through the
ecology of the specific production environment.
• Inputs should be reduced by reuse, recycling and
efficient management of materials and energy in order
to maintain and improve environmental quality and
conserve resources.
10
11.
Principle of Fairness
•Organic agriculture should build on relationships that
ensure fairness with regard to the common
environment and life opportunities.
• Fairness is characterized by equity, respect, justice and
stewardship of the shared world, both among people
and in their relations to other living beings.
• This principle emphasizes that those involved in
organic agriculture ensures fairness at all levels and to
all parties - farmers, workers, processors, distributors,
traders and consumers.
11
12.
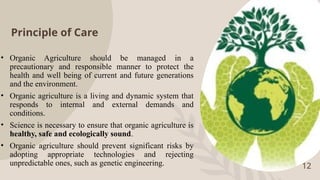
Principle of Care
•Organic Agriculture should be managed in a
precautionary and responsible manner to protect the
health and well being of current and future generations
and the environment.
• Organic agriculture is a living and dynamic system that
responds to internal and external demands and
conditions.
• Science is necessary to ensure that organic agriculture is
healthy, safe and ecologically sound.
• Organic agriculture should prevent significant risks by
adopting appropriate technologies and rejecting
unpredictable ones, such as genetic engineering. 12
13.
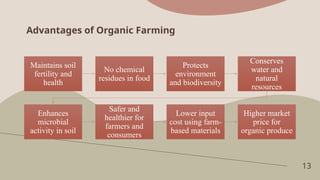
Advantages of OrganicFarming
13
Maintains soil
fertility and
health
No chemical
residues in food
Protects
environment
and biodiversity
Conserves
water and
natural
resources
Enhances
microbial
activity in soil
Safer and
healthier for
farmers and
consumers
Lower input
cost using farm-
based materials
Higher market
price for
organic produce
14.
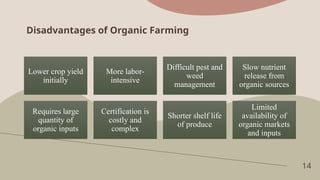
Disadvantages of OrganicFarming
14
Lower crop yield
initially
More labor-
intensive
Difficult pest and
weed
management
Slow nutrient
release from
organic sources
Requires large
quantity of
organic inputs
Certification is
costly and
complex
Shorter shelf life
of produce
Limited
availability of
organic markets
and inputs
15.
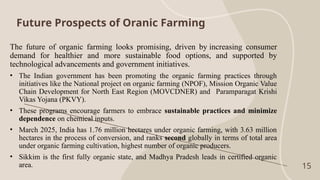
Future Prospects ofOranic Farming
15
The future of organic farming looks promising, driven by increasing consumer
demand for healthier and more sustainable food options, and supported by
technological advancements and government initiatives.
• The Indian government has been promoting the organic farming practices through
initiatives like the National project on organic farming (NPOF), Mission Organic Value
Chain Development for North East Region (MOVCDNER) and Paramparagat Krishi
Vikas Yojana (PKVY).
• These programs encourage farmers to embrace sustainable practices and minimize
dependence on chemical inputs.
• March 2025, India has 1.76 million hectares under organic farming, with 3.63 million
hectares in the process of conversion, and ranks second globally in terms of total area
under organic farming cultivation, highest number of organic producers.
• Sikkim is the first fully organic state, and Madhya Pradesh leads in certified organic
area.
16.
16
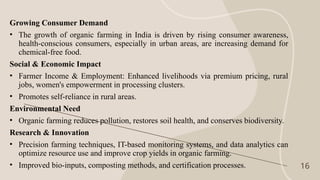
Growing Consumer Demand
•The growth of organic farming in India is driven by rising consumer awareness,
health-conscious consumers, especially in urban areas, are increasing demand for
chemical-free food.
Social & Economic Impact
• Farmer Income & Employment: Enhanced livelihoods via premium pricing, rural
jobs, women's empowerment in processing clusters.
• Promotes self-reliance in rural areas.
Environmental Need
• Organic farming reduces pollution, restores soil health, and conserves biodiversity.
Research & Innovation
• Precision farming techniques, IT-based monitoring systems, and data analytics can
optimize resource use and improve crop yields in organic farming.
• Improved bio-inputs, composting methods, and certification processes.
17.
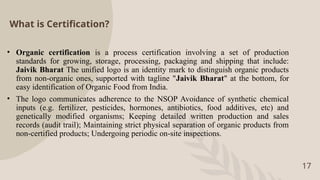
What is Certification?
•Organic certification is a process certification involving a set of production
standards for growing, storage, processing, packaging and shipping that include:
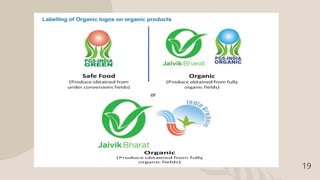
Jaivik Bharat The unified logo is an identity mark to distinguish organic products
from non-organic ones, supported with tagline "Jaivik Bharat" at the bottom, for
easy identification of Organic Food from India.
• The logo communicates adherence to the NSOP Avoidance of synthetic chemical
inputs (e.g. fertilizer, pesticides, hormones, antibiotics, food additives, etc) and
genetically modified organisms; Keeping detailed written production and sales
records (audit trail); Maintaining strict physical separation of organic products from
non-certified products; Undergoing periodic on-site inspections.
17
18.
Purpose of certification
18
•Certification is essentially aimed at regulating production/processing as per
National Standards for Organic Production (NSOP) and facilitating the sale of
original and quality organic products to consumers.
Certification systems
India has two organic certification systems in place. Although both the systems are
based upon common national standards but adopt different approach for verification
and documentation.
a. National Programme for Organic Production (NPOP) for export and
b. Participatory Guarantee System for India (PGS-India) for domestic and local
markets.
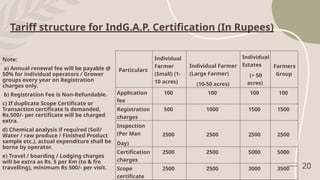
Tariff structure forIndG.A.P. Certification (In Rupees)
Note:
a) Annual renewal fee will be payable @
50% for individual operators / Grower
groups every year on Registration
charges only.
b) Registration Fee is Non-Refundable.
c) If duplicate Scope Certificate or
Transaction certificate is demanded,
Rs.500/- per certificate will be charged
extra.
d) Chemical analysis if required (Soil/
Water / raw produce / Finished Product
sample etc.), actual expenditure shall be
borne by operator.
e) Travel / boarding / Lodging charges
will be extra as Rs. 5 per Km (to & fro
travelling), minimum Rs 500/- per visit. 20
Particulars
Individual
Farmer
(Small) (1-
10 acres)
Individual Farmer
(Large Farmer)
(10-50 acres)
Individual
Estates
(> 50
acres)
Farmers
Group
Application
fee
100 100 100 100
Registration
charges
500 1000 1500 1500
Inspection
(Per Man
Day)
2500 2500 2500 2500
Certification
charges
2500 2500 5000 5000
Scope
certificate
2500 2500 3000 3500
22
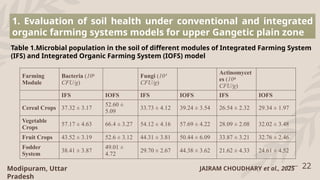
Farming
Module
Bacteria (10⁶
CFU/g)
Fungi (10³
CFU/g)
Actinomycet
es(10⁴
CFU/g)
IFS IOFS IFS IOFS IFS IOFS
Cereal Crops 37.32 ± 3.17
52.60 ±
5.09
33.73 ± 4.12 39.24 ± 3.54 26.54 ± 2.32 29.34 ± 1.97
Vegetable
Crops
57.17 ± 4.63 66.4 ± 3.27 54.12 ± 4.16 57.69 ± 4.22 28.09 ± 2.08 32.02 ± 3.48
Fruit Crops 43.52 ± 3.19 52.6 ± 3.12 44.31 ± 3.81 50.44 ± 6.09 33.87 ± 3.21 32.76 ± 2.46
Fodder
System
38.41 ± 3.87
49.01 ±
4.72
29.70 ± 2.67 44.38 ± 3.62 21.62 ± 4.33 24.61 ± 4.52
1. Evaluation of soil health under conventional and integrated
organic farming systems models for upper Gangetic plain zone
Table 1.Microbial population in the soil of different modules of Integrated Farming System
(IFS) and Integrated Organic Farming System (IOFS) model
Modipuram, Uttar
Pradesh
JAIRAM CHOUDHARY et al., 2025
23.
23
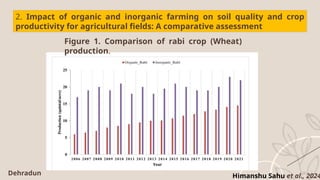
Figure 1. Comparisonof rabi crop (Wheat)
production.
2. Impact of organic and inorganic farming on soil quality and crop
productivity for agricultural fields: A comparative assessment
Himanshu Sahu et al., 2024
Dehradun
24.
24
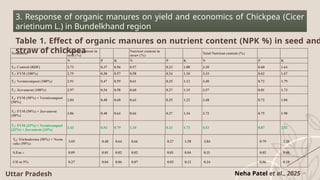
Table 1. Effectof organic manures on nutrient content (NPK %) in seed and
straw of chickpea
3. Response of organic manures on yield and economics of Chickpea (Cicer
arietinum L.) in Bundelkhand region
Treatment
Nutrient content in
seed (%)
Nutrient content in
straw (%)
Total Nutrient content (%)
N P K N P K N P K
T : Control (RDF)
₀ 2.73 0.37 0.56 0.57 0.23 1.08 3.30 0.60 1.64
T : FYM (100%)
₁ 2.75 0.38 0.57 0.58 0.24 1.10 3.33 0.62 1.67
T : Vermicompost (100%)
₂ 2.91 0.47 0.59 0.61 0.25 1.12 3.40 0.72 1.79
T : Jeevamrut (100%)
₃ 2.97 0.54 0.58 0.60 0.27 1.15 3.57 0.81 1.73
T : FYM (50%) + Vermicompost
₄
(50%)
2.84 0.48 0.60 0.63 0.25 1.22 3.48 0.72 1.84
T : FYM (50%) + Jeevamrut
₅
(50%)
3.06 0.48 0.64 0.66 0.27 1.34 3.72 0.75 1.98
T : FYM (33%) + Vermicompost
₇
(33%) + Jeevamrut (34%)
3.43 0.54 0.79 1.10 0.33 1.73 4.53 0.87 2.52
T : Trichoderma (50%) + Neem
₈
cake (50%)
3.05 0.48 0.64 0.66 0.27 1.58 3.84 0.79 2.20
S.Em ± 0.09 0.01 0.02 0.02 0.01 0.04 0.11 0.02 0.06
CD at 5% 0.27 0.04 0.06 0.07 0.02 0.12 0.34 0.06 0.18
Neha Patel et al., 2025
Uttar Pradesh
25.
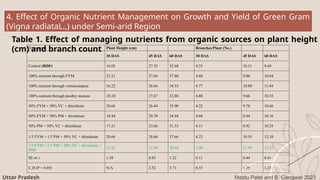
Treatments Plant Height(cm) Branches/Plant (No.)
30 DAS 45 DAS 60 DAS 30 DAS 45 DAS 60 DAS
Control (RDF) 16.03 27.33 32.68 4.33 10.11 9.44
100% nutrient through FYM 21.21 27.66 37.80 4.88 9.00 10.64
100% nutrient through vermicompost 16.22 26.66 34.33 4.77 10.89 11.44
100% nutrient through poultry manure 18.10 27.67 32.80 4.88 9.66 10.33
50% FYM + 50% VC + rhizobium 20.66 26.44 35.00 4.22 9.78 10.66
50% FYM + 50% PM + rhizobium 18.44 29.78 34.44 4.66 9.44 10.16
50% PM + 50% VC + rhizobium 17.21 23.66 31.33 4.11 8.92 10.25
1/3 FYM + 1/3 PM + 50% VC + rhizobium 20.66 28.66 37.66 4.22 10.55 12.10
1/3 FYM + 1/3 PM + 50% VC + rhizobium +
PSB
21.22 31.44 38.44 5.00 11.89 12.21
SE.m ± 1.38 0.83 1.22 0.11 0.44 0.41
C.D (P = 0.05) N/A 2.52 3.71 0.33 1.35 1.25
4. Effect of Organic Nutrient Management on Growth and Yield of Green Gram
(Vigna radiataL.,) under Semi-arid Region
Table 1. Effect of managing nutrients from organic sources on plant height
(cm) and branch count
Mastu Patel and B. Gangwar 2023
Uttar Pradesh
26.
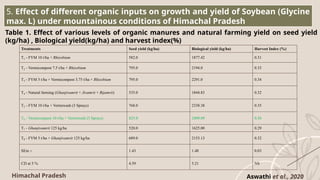
5. Effect ofdifferent organic inputs on growth and yield of Soybean (Glycine
max. L) under mountainous conditions of Himachal Pradesh
Table 1. Effect of various levels of organic manures and natural farming yield on seed yield
(kg/ha) , Biological yield(kg/ha) and harvest index(%)
Himachal Pradesh
Treatments Seed yield (kg/ha) Biological yield (kg/ha) Harvest Index (%)
T - FYM 10 t/ha +
₁ Rhizobium 582.0 1877.42 0.31
T - Vermicompost 7.5 t/ha +
₂ Rhizobium 795.0 2194.0 0.33
T - FYM 5 t/ha + Vermicompost 3.75 t/ha +
₃ Rhizobium 795.0 2291.0 0.34
T - Natural farming (
₄ Ghanjivamrit + Jivamrit + Bijamrit) 535.0 1844.83 0.32
T - FYM 10 t/ha + Vermiwash (3 Sprays)
₅ 768.0 2338.38 0.35
T - Vermicompost 10 t/ha + Vermiwash (3 Sprays)
₆ 825.0 2409.09 0.36
T -
₇ Ghanjivamrit 125 kg/ha 520.0 1625.00 0.29
T - FYM 5 t/ha +
₈ Ghanjivamrit 125 kg/ha 689.0 2153.13 0.32
SEm ± 1.43 1.48 0.03
CD at 5 % 4.59 5.21 NS
Aswathi et al., 2020
27.
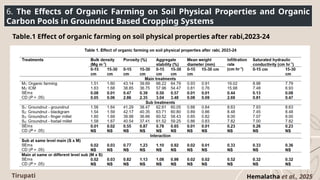
6. The Effectsof Organic Farming on Soil Physical Properties and Organic
Carbon Pools in Groundnut Based Cropping Systems
Table.1 Effect of organic farming on soil physical properties after rabi,2023-24
Tirupati Hemalatha et al., 2025
28.
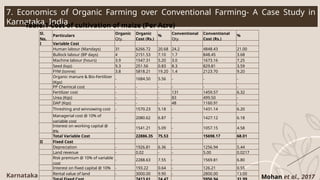
7. Economics ofOrganic Farming over Conventional Farming- A Case Study in
Karnataka, India
Table.1 Cost of cultivation of maize (Per Acre)
Karnataka Mohan et al., 2017
Sl.
No.
Particulars
Organic
Qty.
Organic
Cost (Rs.)
%
Conventional
Qty.
Conventional
Cost (Rs.)
%
I Variable Cost
Human labour (Mandays) 31 6266.72 20.68 24.2 4848.43 21.00
Bullock labour (BP days) 4 2151.53 7.10 1.7 848.45 3.68
Machine labour (hours) 3.9 1547.31 5.20 3.0 1673.16 7.25
Seed (kgs) 9.3 251.56 0.83 8.3 829.81 3.59
FYM (tonne) 3.8 5818.21 19.20 1.4 2123.70 9.20
Organic manure & Bio-Fertilizer
(Kgs)
- 1684.50 5.56 - - -
PP Chemical cost - - - - - -
Fertilizer cost - - - 131 1459.57 6.32
Urea (Kgs) - - - 83 499.50 -
DAP (Kgs) - - - 48 1160.91 -
Threshing and winnowing cost - 1570.23 5.18 - 1431.14 6.20
Managerial cost @ 10% of
variable cost
- 2080.62 6.87 - 1427.12 6.18
Interest on working capital @
8%
- 1541.21 5.09 - 1057.15 4.58
Total Variable Cost 22886.35 75.53 15698.17 68.01
II Fixed Cost
Depreciation - 1926.81 6.36 - 1256.94 5.44
Land revenue - 0.02 - - 5.00 0.0217
Risk premium @ 10% of variable
cost
- 2288.63 7.55 - 1569.81 6.80
Interest on fixed capital @ 10% - 193.22 0.64 - 126.21 0.55
Rental value of land - 3000.00 9.90 - 2800.00 13.00
29.
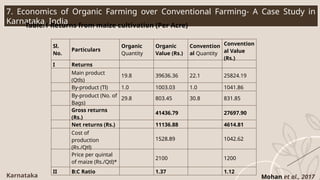
7. Economics ofOrganic Farming over Conventional Farming- A Case Study in
Karnataka, India
Table.1 Returns from maize cultivation (Per Acre)
Karnataka Mohan et al., 2017
Sl.
No.
Particulars
Organic
Quantity
Organic
Value (Rs.)
Convention
al Quantity
Convention
al Value
(Rs.)
I Returns
Main product
(Qtls)
19.8 39636.36 22.1 25824.19
By-product (Tl) 1.0 1003.03 1.0 1041.86
By-product (No. of
Bags)
29.8 803.45 30.8 831.85
Gross returns
(Rs.)
41436.79 27697.90
Net returns (Rs.) 11136.88 4614.81
Cost of
production
(Rs./Qtl)
1528.89 1042.62
Price per quintal
of maize (Rs./Qtl)*
2100 1200
II B:C Ratio 1.37 1.12
30.
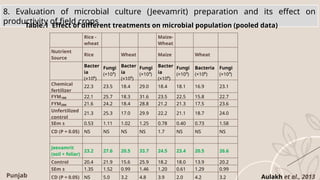
8. Evaluation ofmicrobial culture (Jeevamrit) preparation and its effect on
productivity of field crops
Table.1 Effect of different treatments on microbial population (pooled data)
Punjab Aulakh et al., 2013
Rice -
wheat
Maize-
Wheat
Nutrient
Source
Rice Wheat Maize Wheat
Bacter
ia
(×10⁶)
Fungi
(×10³)
Bacter
ia
(×10⁶)
Fungi
(×10³)
Bacter
ia
(×10⁶)
Fungi
(×10³)
Bacteria
(×10⁶)
Fungi
(×10³)
Chemical
fertilizer
22.3 23.5 18.4 29.0 18.4 18.1 16.9 23.1
FYM₁₀₀ 22.1 25.7 18.3 31.6 23.5 22.5 15.8 22.7
FYM₂₀₀ 21.6 24.2 18.4 28.8 21.2 21.3 17.5 23.6
Unfertilized
control
21.3 25.3 17.0 29.9 22.2 21.1 18.7 24.0
SEm ± 0.53 1.11 1.02 1.25 0.78 0.40 0.73 1.58
CD (P = 0.05) NS NS NS NS 1.7 NS NS NS
Jeevamrit
(soil + foliar)
23.2 27.6 20.5 33.7 24.5 23.4 20.5 26.6
Control 20.4 21.9 15.6 25.9 18.2 18.0 13.9 20.2
SEm ± 1.35 1.52 0.99 1.46 1.20 0.61 1.29 0.99
CD (P = 0.05) NS 5.0 3.2 4.8 3.9 2.0 4.2 3.2
31.
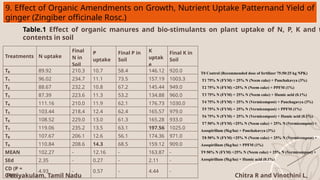
9. Effect ofOrganic Amendments on Growth, Nutrient Uptake Patternand Yield of
ginger (Zingiber officinale Rosc.)
Table.1 Effect of organic manures and bio-stimulants on plant uptake of N, P, K and t
contents in soil
Periyakulam, Tamil Nadu Chitra R and Vinothini L,
T0 Control (Recommended dose of fertilizer 75:50:25 kg NPK)
T1 75% N (FYM) + 25% N (Neem cake) + Panchakavya (3%)
T2 75% N (FYM) +25% N (Neem cake) + PPFM (1%)
T3 75% N (FYM) + 25% N (Neem cake) + Humic acid (0.1%)
T4 75% N (FYM) + 25% N (Vermicompost) + Panchagavya (3%)
T5 75% N (FYM) + 25% N (Vermicompost) + PPFM (1%)
T6 75% N (FYM) + 25% N (Vermicompost) + Humic acid (0.1%)
T7 50% N (FYM) +25% N (Neem cake) + 25% N (Vermicompost) +
Azospirillum (5kg/ha) + Panchakavya (3%)
T8 50% N (FYM) +25% N (Neem cake) + 25% N (Vermicompost) +
Azospirillum (5kg/ha) + PPFM (1%)
T9 50% N (FYM) +25% N (Neem cake) + 25% N (Vermicompost) +
Azospirillum (5kg/ha) + Humic acid (0.1%)
Treatments N uptake
Final
N in
Soil
P
uptake
Final P in
Soil
K
uptak
e
Final K in
Soil
T₀ 89.92 210.3 10.7 58.4 146.12 920.0
T₁ 96.02 234.7 11.1 73.5 157.19 1003.3
T₂ 88.67 232.2 10.8 67.2 145.44 949.0
T₃ 87.39 223.6 11.3 53.2 134.88 960.0
T₄ 111.16 210.0 11.9 62.1 176.73 1030.0
T₅ 103.44 218.4 12.4 62.4 165.57 979.0
T₆ 108.52 229.0 13.0 61.3 165.28 933.0
T₇ 119.06 235.2 13.5 63.1 197.56 1025.0
T₈ 107.67 206.1 12.6 56.1 174.36 971.0
T₉ 110.84 208.6 14.3 68.5 159.12 909.0
MEAN 102.27 - 12.16 - 163.87 -
SEd 2.35 - 0.27 - 2.11 -
CD (P =
0.05)
4.93 - 0.57 - 4.44 -
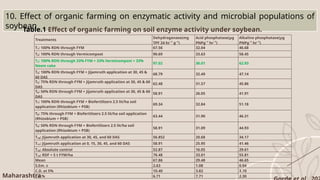
32.
10. Effect oforganic farming on enzymatic activity and microbial populations of
soybean
Table.1 Effect of organic farming on soil enzyme activity under soybean.
Maharashtra
Treatments
Dehydrogenase(mg
TPF 24 hr⁻¹ g⁻¹)
Acid phosphatase(µg
PNPg⁻¹ hr⁻¹)
Alkaline phosphatase(µg
PNPg⁻¹ hr⁻¹)
T₁: 100% RDN through FYM 67.56 32.04 46.68
T₂: 100% RDN through Vermicompost 90.69 33.63 58.45
T₃: 100% RDN through 33% FYM + 33% Vermicompost + 33%
Neem cake
97.02 36.01 62.93
T₄: 100% RDN through FYM + Jijamruth application at 30, 45 &
60 DAS
68.79 32.49 47.14
T₅: 75% RDN through FYM + Jijamruth application at 30, 45 & 60
DAS
62.48 31.57 45.86
T₆: 50% RDN through FYM + Jijamruth application at 30, 45 & 60
DAS
58.91 26.05 41.91
T₇: 100% RDN through FYM + Biofertilizers 2.5 lit/ha soil
application (Rhizobium + PSB)
69.34 32.84 51.18
T₈: 75% through FYM + Biofertilizers 2.5 lit/ha soil application
(Rhizobium + PSB)
63.44 31.90 46.31
T₉: 50% RDN through FYM + Biofertilizers 2.5 lit/ha soil
application (Rhizobium + PSB)
58.91 31.09 44.93
T₁₀: Jijamruth application at 30, 45, and 60 DAS 56.852 20.68 34.17
T₁₁: Jijamruth application at 0, 15, 30, 45, and 60 DAS 58.91 25.95 41.46
T₁₂: Absolute control 52.87 16.05 29.61
T₁₃: RDF + 5 t FYM/ha 76.48 33.01 55.81
Mean 67.86 29.48 46.65
S.Em. ± 2.63 1.08 0.94
C.D. at 5% 10.40 3.82 3.70
C.V.% 6.71 7.71 2.30
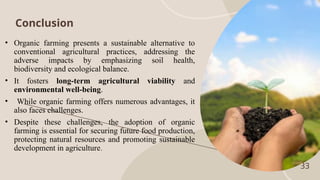
33.
33
Conclusion
• Organic farmingpresents a sustainable alternative to
conventional agricultural practices, addressing the
adverse impacts by emphasizing soil health,
biodiversity and ecological balance.
• It fosters long-term agricultural viability and
environmental well-being.
• While organic farming offers numerous advantages, it
also faces challenges.
• Despite these challenges, the adoption of organic
farming is essential for securing future food production,
protecting natural resources and promoting sustainable
development in agriculture.
34.
References
Kumar, A., Shamim,M., Prusty, A. K., Kumar, L., Kumar, S., Jat, P.C., Mishra, R.P., Kashyap, P.,
Choudhary, J., Bhanu, C., Kumar, K., Narwal, E., Meena, A. L., Ansari, M.A., Ghasal, P.C., &
Ravishankar, N. (2025). Evaluation of soil health under conventional and integrated organic
farming systems models for upper Gangetic plain zone. The Indian Journal of Agricultural
Sciences, 95(3), 260–265.
Sahu, S. K., Maharana, J. K., & Adhikary, P. P. (2024). Impact of organic and inorganic farming on
soil quality and crop productivity for agricultural fields: A comparative assessment.
Environmental Challenges, 9,100121.
Patel, N., Pandey, S., & Kumar, A. (2025). Response of organic manures on yield and economics of
Chickpea (Cicer arietinum L.) in Bundelkhand region. International Journal of Research in
Agronomy, 8(5), 575–579.
Patel, M., & Gangwar, B. (2023). Effect of Organic Nutrient Management on Growth and Yield of
Green Gram (Vigna radiata L.) under Semi arid Region
‑ . International Journal of Plant & Soil
Science, 35(19), 514–523
Awasthi, N., Upadhyay, R. G., Singh, A., Kumar, R., & Sharma, G. D. (2020). Effect of different
organic inputs on growth and yield of soybean (Glycine max L.) under mountainous conditions


![ipr[2].pptxfor agriculture students purpose](https://cdn.slidesharecdn.com/ss_thumbnails/ipr2-250817081026-ecef0da2-thumbnail.jpg?width=640&height=640&fit=bounds)


