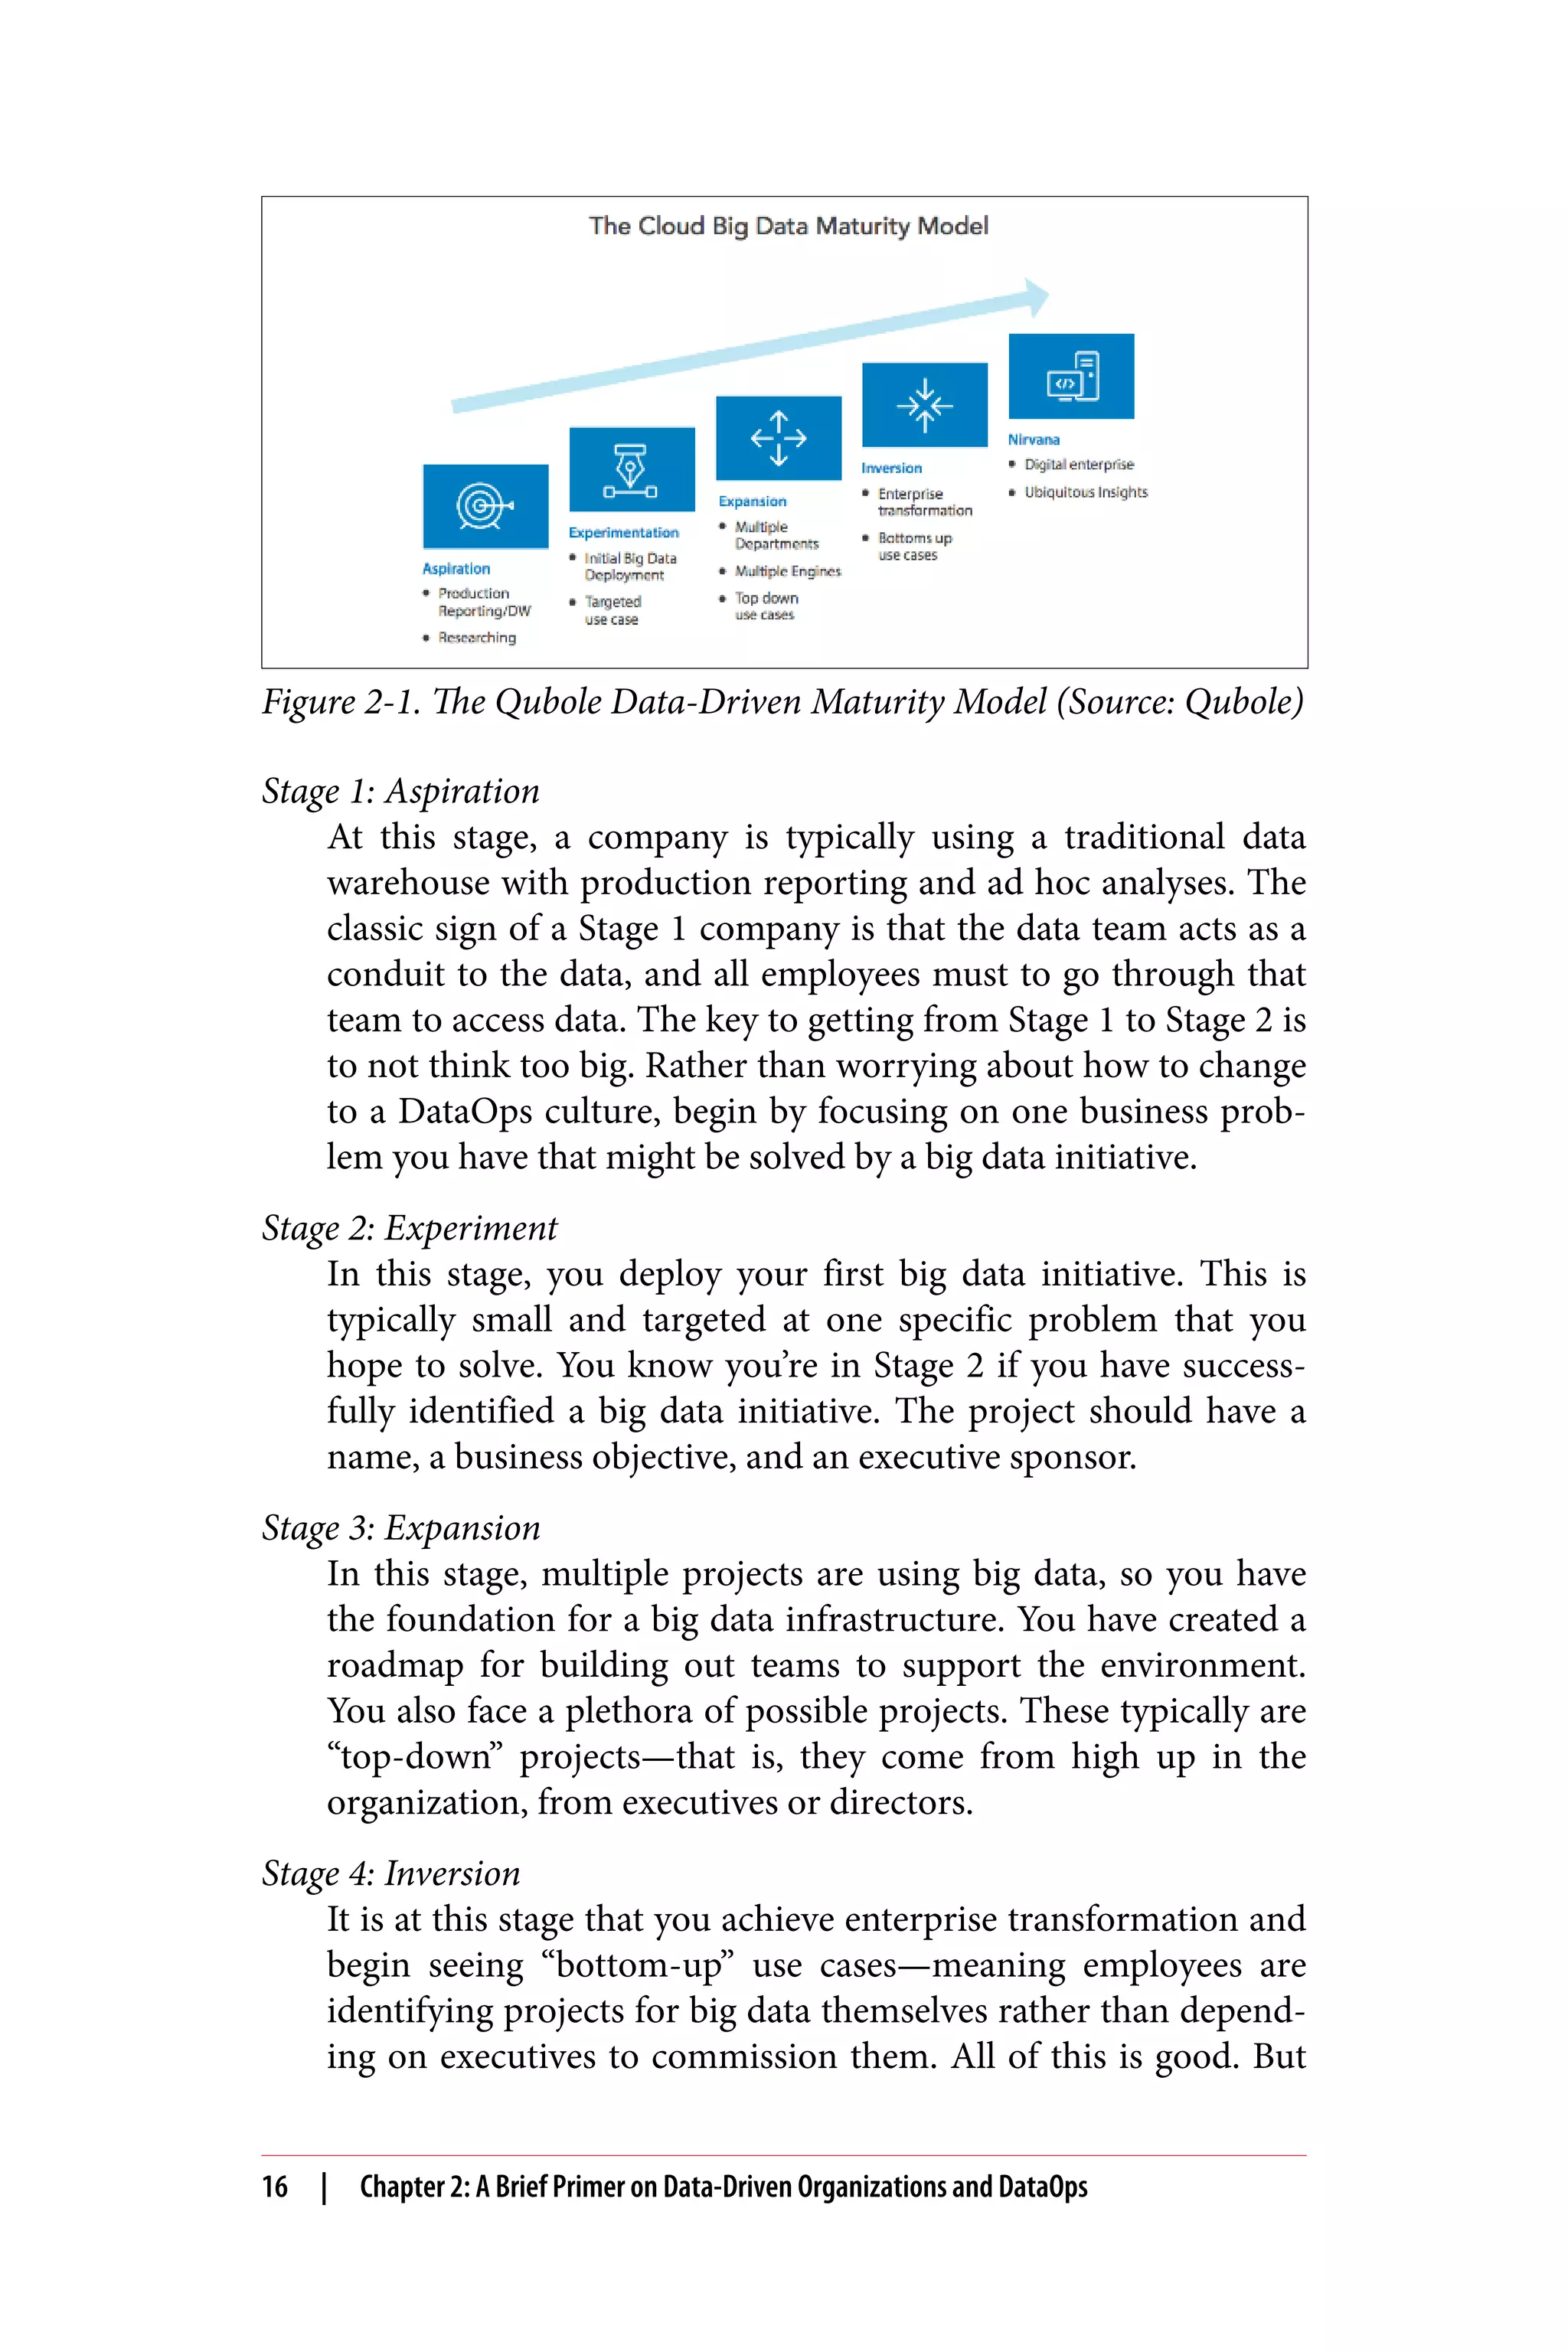
The document explores the transformative impact of data-driven strategies in the media and entertainment industry, focusing on companies like Sling TV, Turner Broadcasting, and Comcast. It discusses how big data and analytics are reshaping content delivery, consumer engagement, and advertising effectiveness, offering insights into the industry's challenges and opportunities. Additionally, it emphasizes the necessity for companies to adapt their infrastructure and embrace innovations such as cloud technology and artificial intelligence to thrive in this evolving landscape.
![978-1-491-99797-0
[LSI]
Creating a Data-Driven Enterprise in Media
by Ashish Thusoo and Joydeep Sen Sarma
Copyright © 2018 O’Reilly Media, Inc. All rights reserved.
Printed in the United States of America.
Published by O’Reilly Media, Inc., 1005 Gravenstein Highway North, Sebastopol, CA
95472.
O’Reilly books may be purchased for educational, business, or sales promotional use.
Online editions are also available for most titles (http://oreilly.com/safari). For more
information, contact our corporate/institutional sales department: 800-998-9938 or
corporate@oreilly.com.
Editor: Nicole Tache
Production Editor: Nicholas Adams
Copyeditor: Octal Publishing, Inc.
Interior Designer: David Futato
Cover Designer: Karen Montgomery
Illustrator: Rebecca Demarest
March 2018: First Edition
Revision History for the First Edition
2018-02-23: First Release
The O’Reilly logo is a registered trademark of O’Reilly Media, Inc. Creating a Data-
Driven Enterprise in Media, the cover image, and related trade dress are trademarks
of O’Reilly Media, Inc.
While the publisher and the authors have used good faith efforts to ensure that the
information and instructions contained in this work are accurate, the publisher and
the authors disclaim all responsibility for errors or omissions, including without
limitation responsibility for damages resulting from the use of or reliance on this
work. Use of the information and instructions contained in this work is at your own
risk. If any code samples or other technology this work contains or describes is sub‐
ject to open source licenses or the intellectual property rights of others, it is your
responsibility to ensure that your use thereof complies with such licenses and/or
rights.
This work is part of a collaboration between O’Reilly and Qubole. See our statement
of editorial independence.](https://image.slidesharecdn.com/ebook-creating-a-data-driven-enterprise-in-media-210623140704/75/O-Reilly-eBook-Creating-a-Data-Driven-Enterprise-in-Media-eubolr-4-2048.jpg)
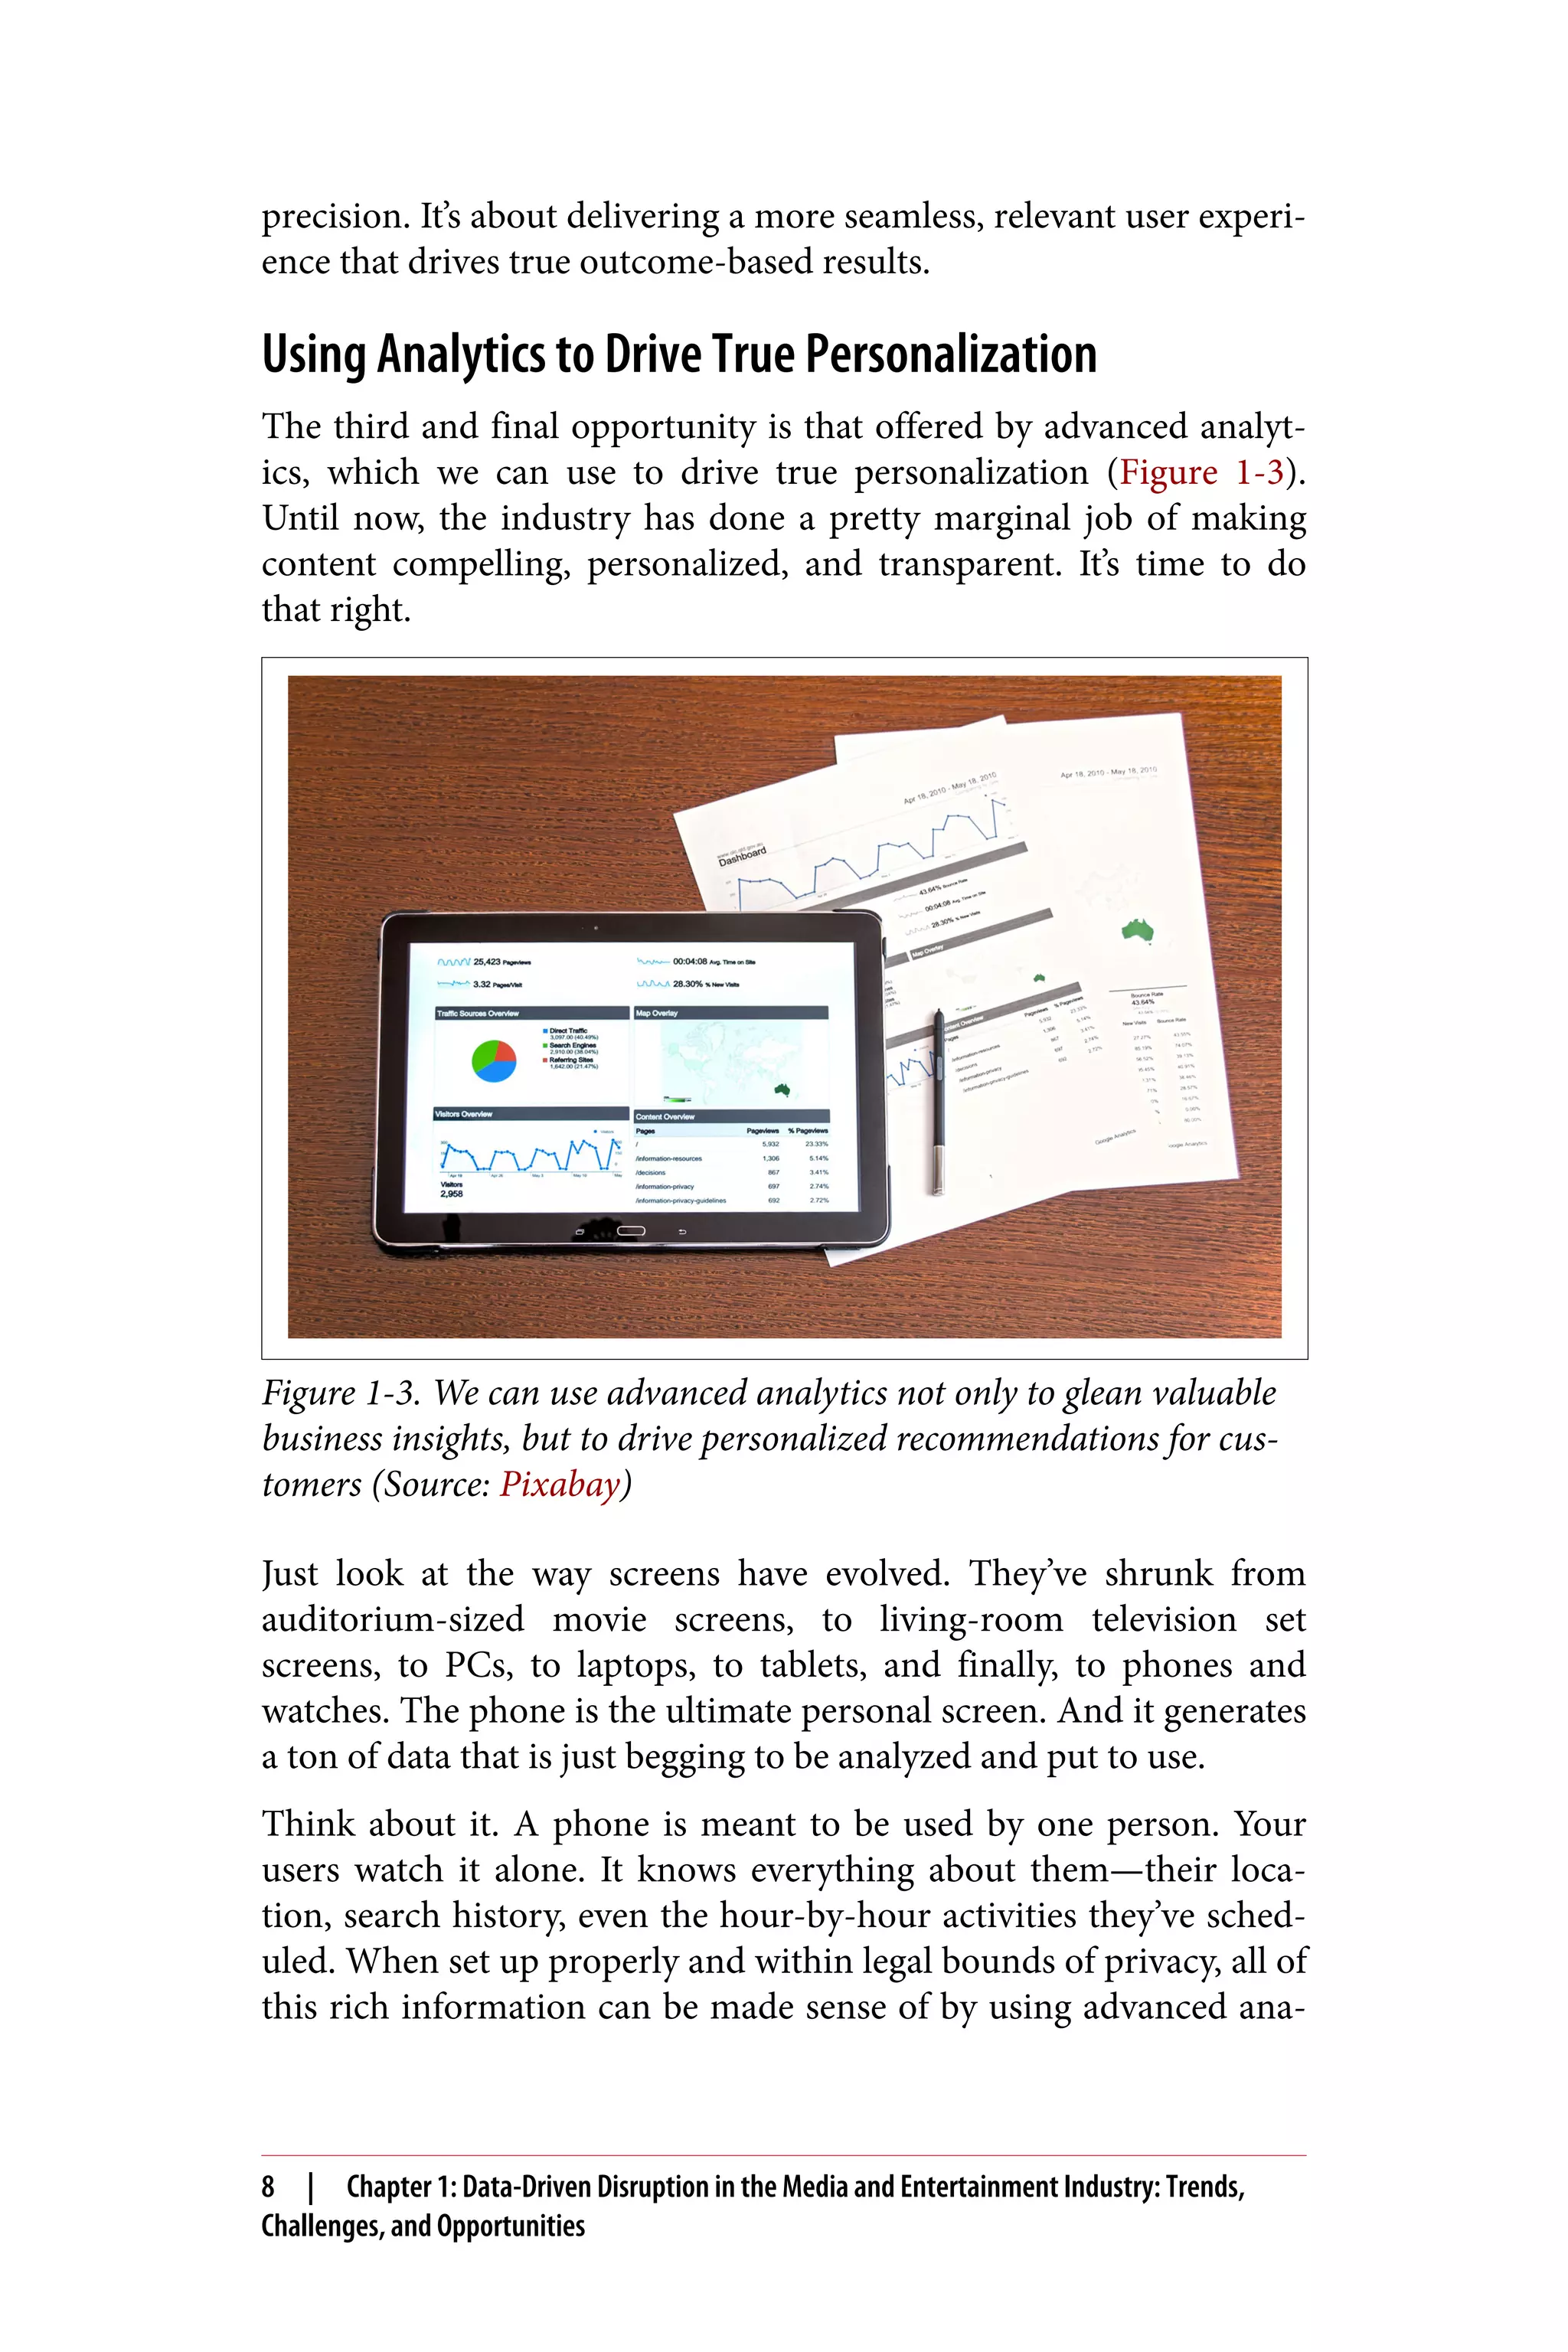


![factors outside of our control—such as the internet working prop‐
erly—to deliver a good customer experience.” Most emerging media
and entertainment firms are in the same position, “trying to build
resilient and scalable services that react to the unknowns we have to
deal with is what we are working on,” says Linder. “It is a really fun
and exciting place to be.”
Because of this lack of control, Sling TV cannot operate without
automation, and without artificial intelligence tools to tell it, for
example, that customers are having problems on the West Coast,
and that it is probably one ISP (internet service provider) causing
the trouble. “Although you obviously do not own it, you have to
consider what you can do about it,” says Linder. “We are looking
into data and analytics solutions to help us make decisions in those
cases.”
On Jumping into the Data Lake
At this point, Sling TV is just starting to get its head around what it’s
enterprise data lake would look like. It is considering both Hadoop
and some Amazon Web Services (AWS) tools. “The goal is to find us
a robust, scalable solution to get us much more longevity,” says Lin‐
der, who added that Sling TV is still in the early stages on that par‐
ticular journey. “But the goal is to try to bring all of the disparate
silos of data together into an enterprise data lake that we can lever‐
age as a company,” he says. “The data lake is our first step to truly
robust machine learning applications, which will enable the person‐
alized experience we want for our customers.”
There is no cookie-cutter plan to follow for how to approach this big
data challenge with the technology moving as fast as it is currently.
“If we tried to sit down and figure it all out first, we would never get
started,” Linder says. “Taking an iterative approach to building this
environment will get us to the places we want to go quicker and with
less risk,” he says. “So, we are taking a small, iterative approach. We
try something, see what we learn, and improve it,” he says. “We are
measuring KPIs [key performance indicators]. We ask questions.
And see what we can figure out together.”
24 | Chapter 3: Sling TV: Providing “Big Data on Demand” for Users and Systems](https://image.slidesharecdn.com/ebook-creating-a-data-driven-enterprise-in-media-210623140704/75/O-Reilly-eBook-Creating-a-Data-Driven-Enterprise-in-Media-eubolr-30-2048.jpg)
![we need to figure out, ‘how do we use these datasets?’ How do we
create new initiatives and services based on them?”
Also in the experimentation stage, Turner has datasets that multiple
departments are already using. But these datasets are very large and
very diverse, so business users are still figuring out how to use them,
what types of analytics can be run on them, and how to build new
business strategies around them.
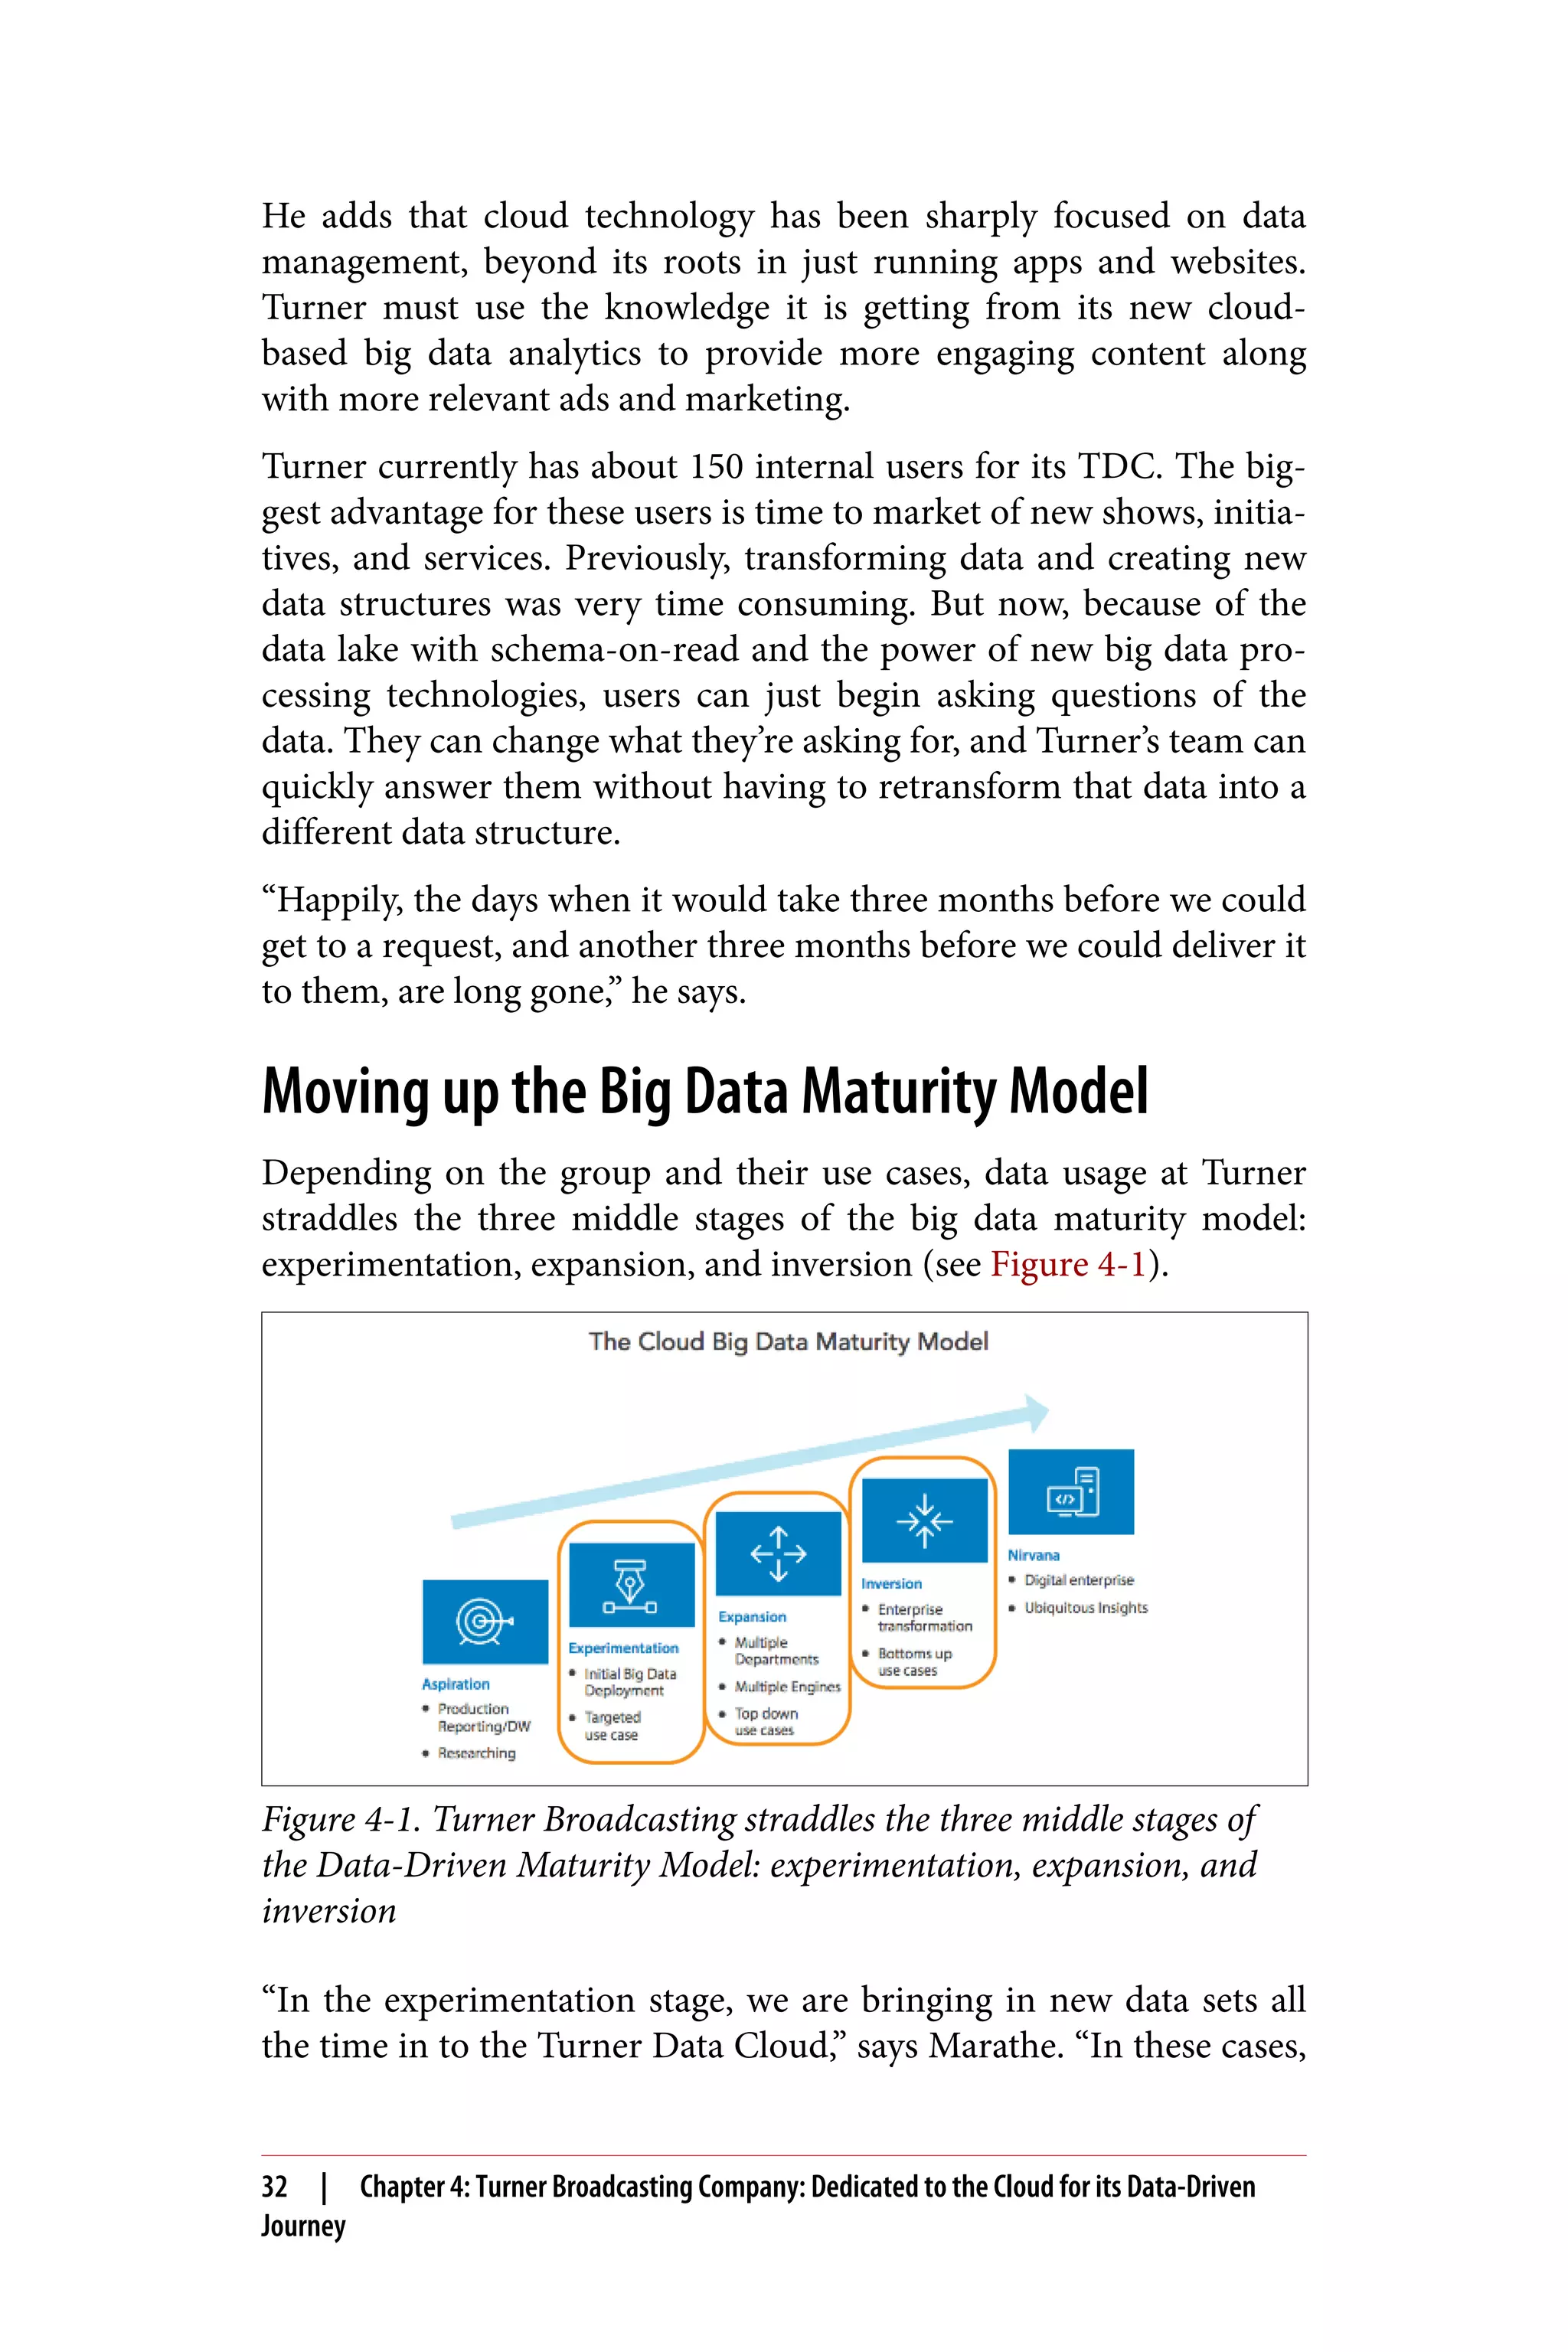
Then, Turner has some groups in the expansion stage of the Data-
Driven Maturity Model. For example, business users from its reve‐
nue operations use data from the TDC to forecast ad inventory.
Turner also uses data to determine which audiences to target—
because more and more ads are now being sold using knowledge
about audience preferences rather than demographics. “By doing
this, we get a much higher CPM [cost per thousand impressions]
than if the ads we sold were just based on demographics,” says Mar‐
anthe.
This same data is being used by brands to figure out what content is
best suitable for the audiences that Turner already has. The data is
also used by Turner’s research team to create reports and forecasts of
the business for upper management. “Multiple groups are leveraging
the same data, just slicing and dicing it in different ways to suit their
requirements,” says Marathe.
Finally, Turner does have a few teams in the inversion stage of the
Data-Driven Maturity Model. “This is where we brought in extra
datasets and started building more centers of excellence around
data, or data COEs [Centers of Excellence],” says Marathe. Until
recently, the users of Turner’s data were not operating like data
COEs. But today it has data COEs within its various brands.
The Evolution of the Turner Data Team
Four teams are involved in managing the TDC: Marathe’s IT group
(called the data engineering group), a data governance group, a
business engagement group, and a data scientist group.
Before Turner created the TDC, Marathe’s group was called Audi‐
ence Insights Reporting, and was quite limited in what it did.
“Whereas the mission of the Turner Data Cloud is to get the best
possible alignment of consumers and content, our earlier mission
The Evolution of the Turner Data Team | 33](https://image.slidesharecdn.com/ebook-creating-a-data-driven-enterprise-in-media-210623140704/75/O-Reilly-eBook-Creating-a-Data-Driven-Enterprise-in-Media-eubolr-39-2048.jpg)
![was simply reporting certain basic statistics,” he says. “The new mis‐
sion is reporting plus analytics plus everything in between.”
Marathe has dedicated two of his 30 engineers to R&D and innova‐
tion. “I need this because the data field is changing so fast,” he says.
“Every day there is some new tool, whether it’s a new AWS [Amazon
Web Services] product, or enhancements to our Qubole platform or
a Spark innovation. Something is always changing. And we want to
make sure that we keep abreast of it all.”
Marathe says he considers Turner’s architecture well structured to
benefit from all the innovations coming from the cloud providers,
the open source community, and from their Hadoop/Spark platform
—Qubole. “As new tools come up or as new data processing plat‐
forms become available, we have the ability to shift to them fairly
quickly. Our users will always have access to the latest and the great‐
est. That’s the cornerstone of the architecture and that’s what cloud
affords us, which we couldn’t have done if we were based on an on-
premises architecture.”
Within his IT group, Marathe has a development and quality assur‐
ance team responsible for developing processes to bring in new data
sources, by first extracting data through various means such as APIs
and data feeds, and then transforming and loading that data into a
data lake or, for some sources, into a data warehouse. In addition,
Marathe has a small development/maintenance and operations team
—a team of data architects who are also data analysts, and who ana‐
lyze new data sources or use cases and figure out what kinds of
transformations and models would serve those use cases.
Though the team’s goal is always to do as little data transformation
as possible, Marathe says, “we try to keep data in a data lake format,
and do schema-on-read. So, we try not to do extensive ETL [extract,
transform, and load] activities.”
Moving Toward User Self-Service
When it comes to putting self-service in place for data users, Turner
is currently “all over the map.” According to Marathe, “For some
business groups, we are already doing that. We have given users a
business intelligence platform, and they are quite self-sufficient.” But
then there are many users who are not independent—yet. Turner’s
34 | Chapter 4: Turner Broadcasting Company: Dedicated to the Cloud for its Data-Driven
Journey](https://image.slidesharecdn.com/ebook-creating-a-data-driven-enterprise-in-media-210623140704/75/O-Reilly-eBook-Creating-a-Data-Driven-Enterprise-in-Media-eubolr-40-2048.jpg)
![goal is to democratize data, and to make most of its users self-
sufficient in using it.
However, says Marathe, there will always be a data science team
within the TDC to perform tasks for smaller business groups within
Turner that will never hire data scientists of their own.
“We’ll always have a hybrid model for that reason. Self-service will
mostly be the domain of the larger business units,” he says.
Challenges and Next Steps
The biggest challenge Turner has faced thus far is data wrangling.
Just the day-to-day chore of bringing in quality data has turned out
to be extraordinarily difficult. “We bring in and ingest so much data
and so many social media files that it’s an ongoing challenge,” says
Marathe. “But it’s smaller today compared to the previous model,
where we had to do a lot of ETL and a slight variation in data would
throw it off.”
Marathe doesn’t consider the big data infrastructure challenges fac‐
ing the media industry to be unique. “Most of the challenges we face
are common to all industries,” he says. “In a way, we have less con‐
cerns when compared to industries like finance and banking and
healthcare where they own, store, and process a lot of PII [person‐
ally identifiable information] data. We don’t have that much PII. But
we still have to make sure that we are abiding by all the different
laws and regulations—especially now that Europe is implementing
GDPR [General Data Protection Regulation].” Complying with
everything that is in the European GDPR is going to keep Turner
busy for next few months, Marathe admits. However, that’s some‐
thing all businesses in all industries need to do, and it will ensure
that no industry misuses people’s personal information. Marathe
believes this measure will be a good thing in the long term for the
data technologies.
One challenge that is unique to the media industry is that the data it
gets can have many quality issues compared to other industries.
Take financial services—core financial industry data has to be very
clean. When you go to an ATM and withdraw money, the data says
that the $100 you withdrew is a $100 debit transaction from your
account. “But when you visit a broadcaster’s web page, not all the
data is always collected. This is because the web page needs to be
Challenges and Next Steps | 35](https://image.slidesharecdn.com/ebook-creating-a-data-driven-enterprise-in-media-210623140704/75/O-Reilly-eBook-Creating-a-Data-Driven-Enterprise-in-Media-eubolr-41-2048.jpg)
![going to the cloud. Marathe also recommends keeping compute and
storage completely separate, to improve your ability to manage and
utilize data. “We are no longer pushing data into a traditional
RDBMS [relational database management system] database and
thus only able to access it from the ecosystem that supports that
RDBMS,” he says. “Our data sits in an object storage such as S3
[Amazon’s Simple Storage Service], technologically speaking, which
gives us the ability to move quickly to newer data access products
and does not keep us tied to, for example, one DBMS.”
Marathe is a cautiously enthusiastic advocate of open source tech‐
nology. “Even though we are using open source technology, we are
not using it directly. Our cloud platform vendor—Qubole—is bak‐
ing open source technology into its unified product, and then
exposing it to us,” he says. The issue with doing things that way, he
points out, is that you might not be able to move as quickly on what
is out there in the open source world because you need to wait for
your vendor to release its product. But the advantage is that Turner
is not in the Wild Wild West. “We don’t have to figure everything
out. The open source technology gets baked in and it works together
as a product. And, we don’t want to necessarily move that fast any‐
way for security reasons,” says Marathe. Turner is therefore a “con‐
servative” user of open source technology.
Looking back on his data journey thus far, Marathe says Turner is
progressing “bit by bit.” “We’ve gone beyond simple reporting to
analytics, and we do a certain amount of machine learning and arti‐
ficial intelligence, but we’re not doing predictive or prescriptive ana‐
lytics as much as I would have liked” Marathe anticipates doing so in
the next few years.
Turner will be able to tell, for example, based on the content a cus‐
tomer has consumed in the past, what that customer will be interes‐
ted in consuming in the future. “We already do that, of course,
because we know your areas of interest. But that is still very prelimi‐
nary. It’s not really deep learning at this point,” he says. After all,
content has many different aspects. A particular viewer could be
attracted by the theme of the movie or by the actor playing the main
hero or heroine of the plot. So, many different variables exist. Figur‐
ing out what is relevant and what is not is where deep learning will
come into play, Marathe says.
Lessons Learned | 37](https://image.slidesharecdn.com/ebook-creating-a-data-driven-enterprise-in-media-210623140704/75/O-Reilly-eBook-Creating-a-Data-Driven-Enterprise-in-Media-eubolr-43-2048.jpg)
![From there it can be filtered, aggregated, and stored in auxiliary,
special-purpose datastores like columnar databases. The idea is that
eventually this big data platform will serve various applications. “At
this point, we ingest approximately 200 data sources (Kafka topics),
with more added every week,” says Eckman. “These are available for
relevant groups to leverage in their own product development and
customer experience initiatives. We have just stood up a governed
data lake in AWS [Amazon Web Services], and topics will be landed
there incrementally, in the priority order given to us by the product
team.”
Eckman notes that when she talks about “customer experience data,”
it’s important to point out that Comcast gathers and processes only
that sort of data in the aggregate. “We don’t look at individual cus‐
tomers’ data. That’s private. We’re very strict about that,” she says.
The T&P group, led by President Tony Werner, is charged with
designing, developing, and supporting the products and services
that are needed to deliver internet, TV, and voice to Comcast’s more
than 28 million customers. T&P also supports Comcast employees
by building and operating mission-critical systems, including those
to monitor its network—one of the world’s largest—and its associ‐
ated cloud infrastructure.
“We like to think of ourselves as the cool kids because we work with
the exciting new technologies,” says Eckman. In fact, one of her col‐
leagues was on the team that worked on Comcast’s X1 Entertain‐
ment Operating System, which just won an Emmy for Outstanding
Achievement in Interactive Media Program. “So, he has a picture of
himself holding the Emmy in his office. That’s fun,” she says. Com‐
cast also has people who monitor network traffic and ensure that the
network runs reliably and performs as needed.
Eckman says she was astounded by the amount of network teleme‐
try data Comcast collects. “The data I’m working with here at Com‐
cast is the biggest big data I’ve ever seen in my career,” she says. “It’s
enormous. So, we’re building the central platform that will consoli‐
date data and make it available to all big data analytics activities.
And, again, all of this is focused on transforming the customer expe‐
rience.”
40 | Chapter 5: Comcast: How a Focus on Customer Experience Led to a Focus on Data Science](https://image.slidesharecdn.com/ebook-creating-a-data-driven-enterprise-in-media-210623140704/75/O-Reilly-eBook-Creating-a-Data-Driven-Enterprise-in-Media-eubolr-46-2048.jpg)
![Why a Single Platform?
The T&P organization’s initiative to build a single, integrated plat‐
form came about because almost every department within T&P that
routinely did analytics was asking for its own Kafka (ingest) cluster
and its own data lake.
“That’s crazy on the face of it—and also needlessly expensive,” says
Eckman. T&P’s response: to design a single platform for the data
needs that all departments have in common, while recognizing that
the kinds of data analytics people will want to do within those
departments could vary considerably.
Thus, this is not a one-size-fits-all solution. Eckman’s team provides
the data in a format in which users from different departments can
easily get at it, and easily understand what it means. They can then
do whatever custom analytics they need for their particular part of
the business.
“In other words, the real power of what we’re doing comes from
integrating data, and the platform it resides on, across different
aspects of the business,” says Eckman.
How Data Is Used to Solve Business Challenges
One of the business challenges that data helps Comcast solve is the
uncertainty about which network topology to use in a particular
geographic area. What would be an ideal network topology when it
rolls out a new product that uses the network differently? What
would serve customers best?
“For example, we’ve been moving away from the QAM [quadrature
amplitude modulation] standard toward a new digital standard that
will transport all content over IP [internet protocol]. That’s better
for us and for our customers,” says Eckman. “But not everyone has
made that conversion yet.” Consequently, Comcast is analyzing the
data to determine the right approach. If a certain region, say Boston,
converts, how should Comcast change the network topology in that
geographic area to meet customers’ needs better?
“We simulate what that looks like using data,” says Eckman. “If 20
percent of the people are using X1 now, and then, 80 percent use it
in six months, what will the traffic look like? How can different net‐
works’ topologies optimize that?”
Why a Single Platform? | 41](https://image.slidesharecdn.com/ebook-creating-a-data-driven-enterprise-in-media-210623140704/75/O-Reilly-eBook-Creating-a-Data-Driven-Enterprise-in-Media-eubolr-47-2048.jpg)
![Why Governance Is Essential
Data analysts have traditionally spent 70 percent of their time data
wrangling. Just finding out where data is and what it was took up
most of their time. Only 30 percent of their time was spent doing
actual analysis.
Comcast’s T&P organization wanted to change this. It decided that
from the very beginning it would put all data under strict gover‐
nance. “From the minute it enters our system, we have a fully docu‐
mented schema for it,” says Eckman.
Eckman says that the T&P integrated big data platform that her
team is building is a relatively small initiative to prove that DataOps
works, creating the justification for the next, bigger step. This means
that it had the luxury of starting from scratch, and not having to
clean up after aging legacy databases.
But before the team established the current data governance proto‐
col, Comcast had no easy way to perform data discovery.
“That approach to data is crazy,” says Eckman. “It’s the old adage,
GIGO [garbage in, garbage out]. If you throw things in and you
have no idea about the quality of that data, you have to chase around
to find out who owns it. You have to chase around to make sure that
if they say “deviceID,” it means the same as the deviceID that you get
from some other project, because it doesn’t always align. You can’t
merge data if your IDs don’t use the same semantics. You can’t join
data if that’s the case. You have a mess on your hands.”
Comcast uses Apache Avro schemas for governance. Avro is an
open source data serialization system developed under the auspices
of the Apache Software Foundation. It is well structured to begin
with, but Comcast put conventions on it that make it even more
useful.
For instance, every attribute must have a documentation string asso‐
ciated with it, and that documentation must be informative. For
example, no acronyms. The owner of the data must spell out every‐
thing. For example, if an attribute is called “Event Type,” the docu‐
mentation can’t say “the type of the event.” It must be more useful.
“You have to be thinking of who will be seeking the attribute beyond
just you and your team,” says Eckman. “You have to think of others.
Why Governance Is Essential | 43](https://image.slidesharecdn.com/ebook-creating-a-data-driven-enterprise-in-media-210623140704/75/O-Reilly-eBook-Creating-a-Data-Driven-Enterprise-in-Media-eubolr-49-2048.jpg)
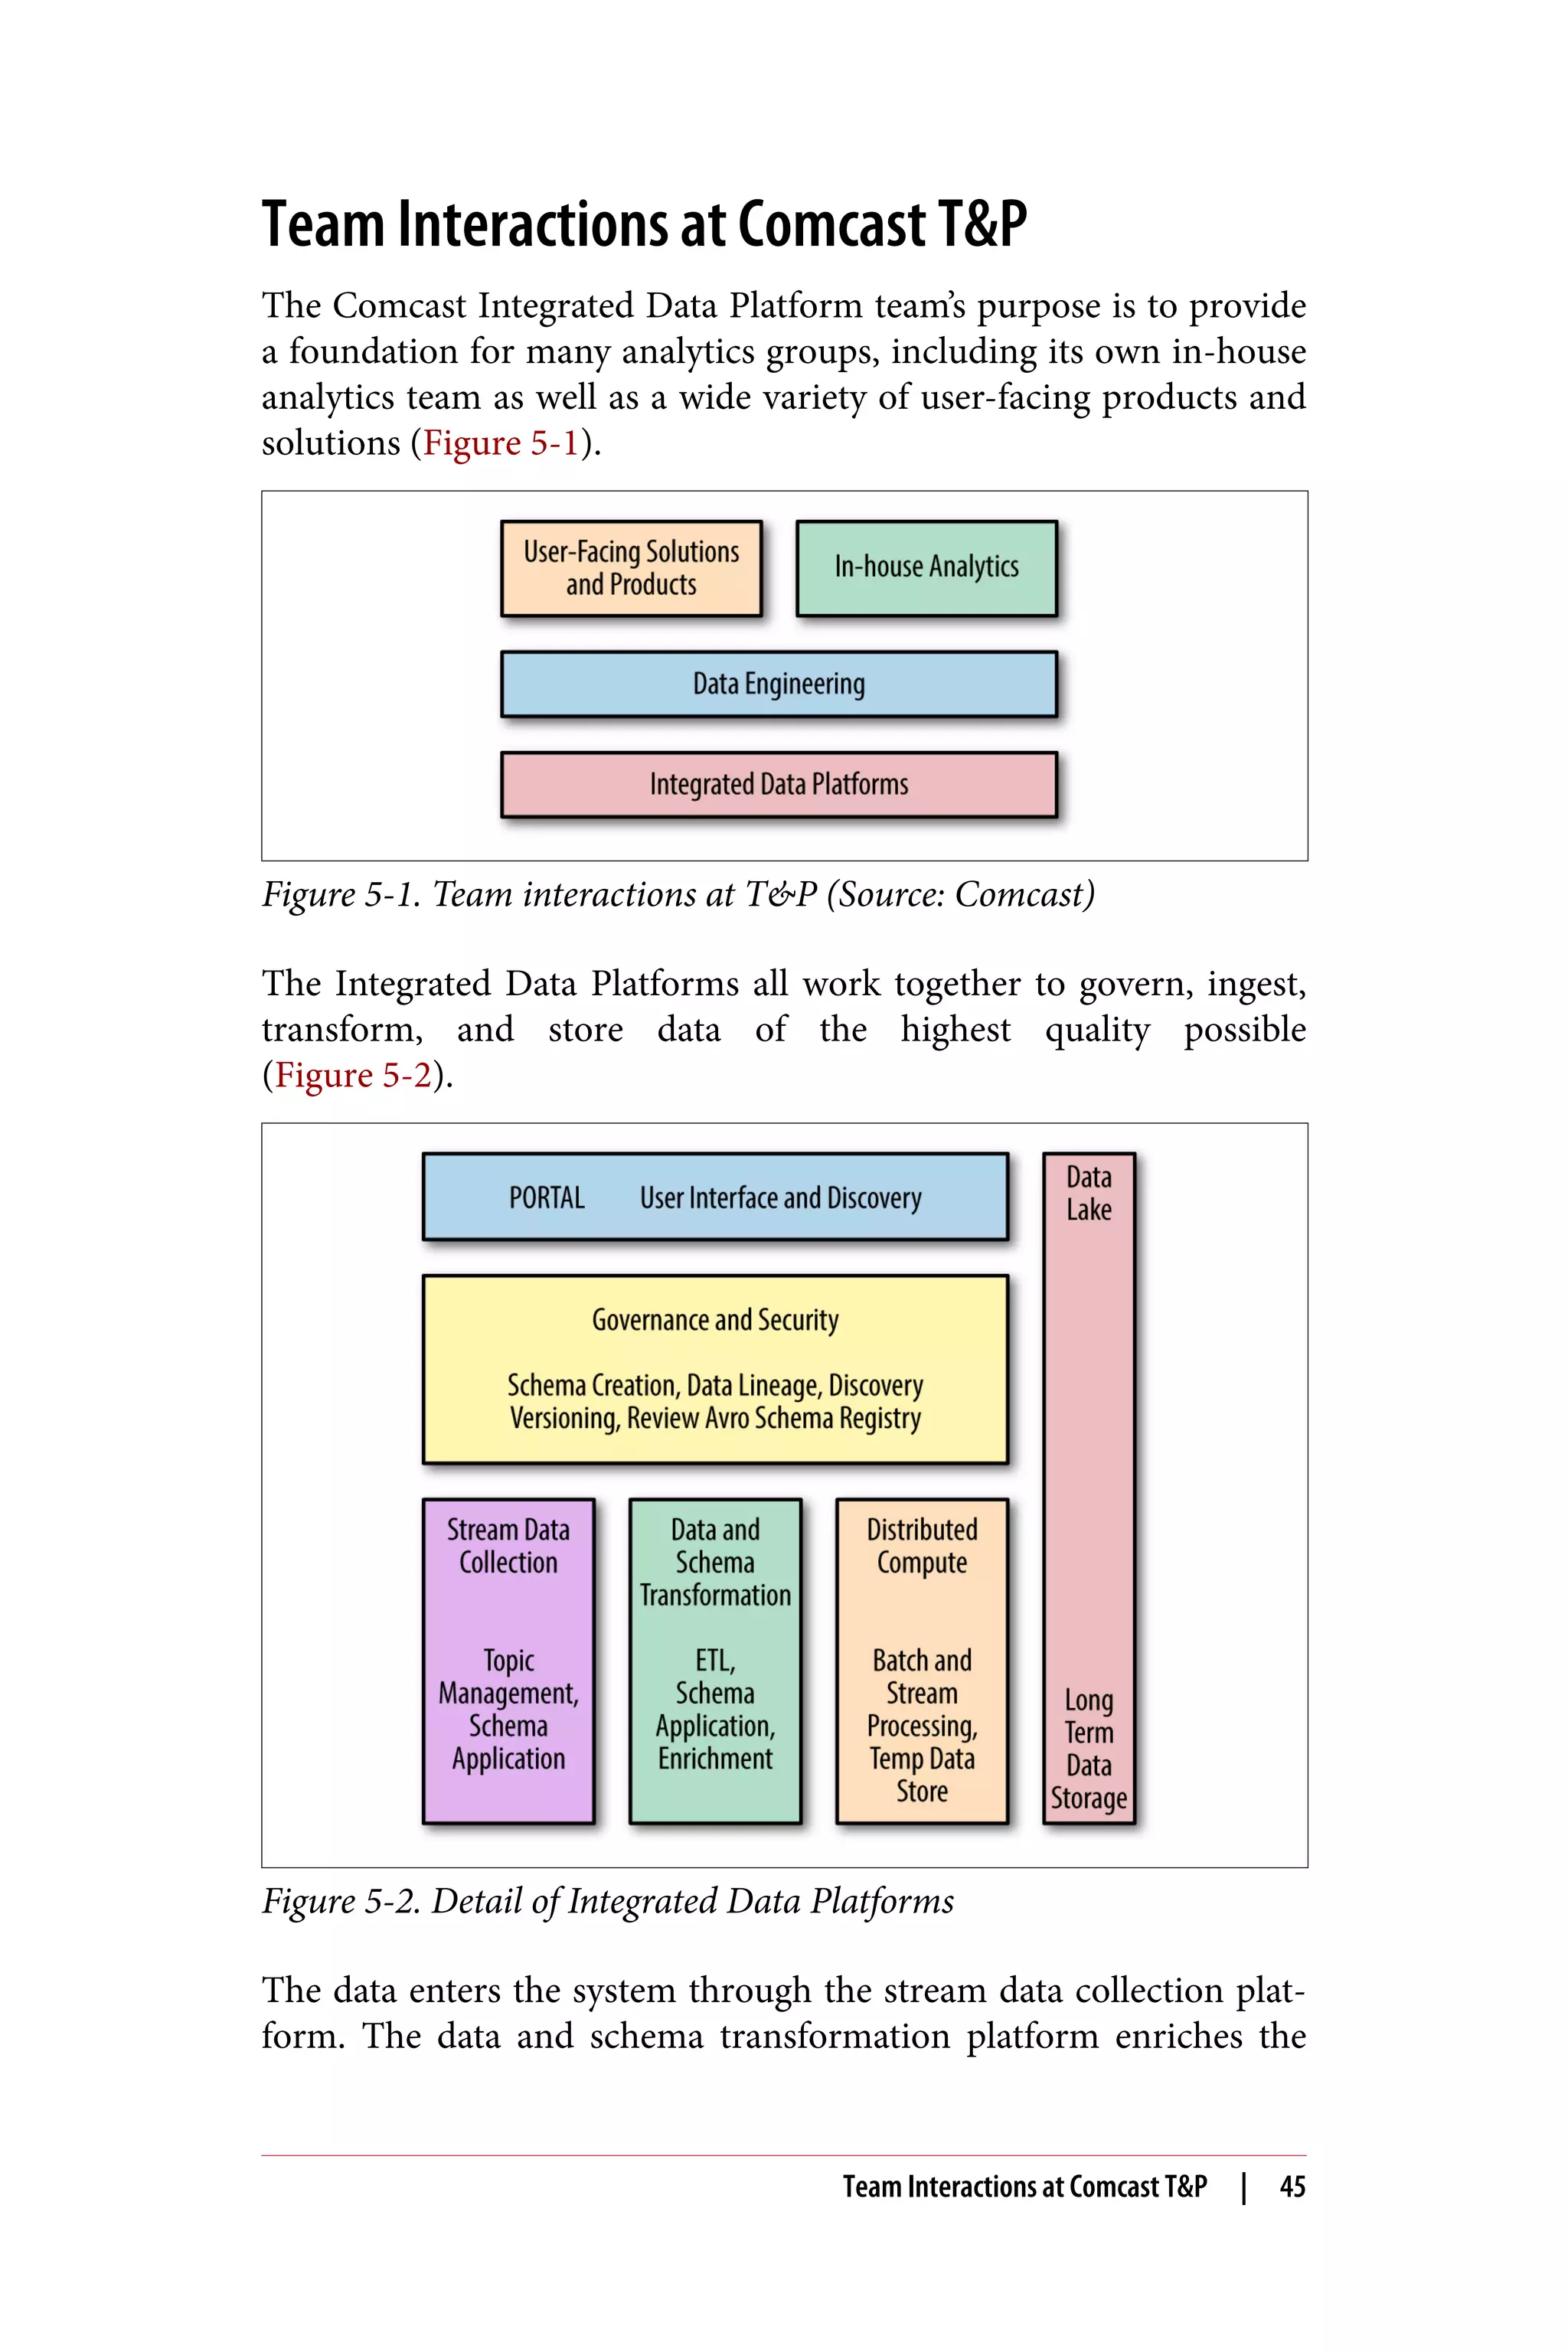
![data and acts as the connector between the streaming data and the
data lake.
Comcast also has a team responsible for the data lake platform, and
then one that manages its distributed compute platform, both of
which spring into action when users need clusters to do things such
as hive queries. “That’s all self-service,” says Eckman. “Users tell us ‘I
want to do this, and I want these tools.’ They give us a sense of the
size of their projects, and then we spin it up.” Everything of course is
done in the cloud, Eckman says.
There’s a portal that will sit on top of everything. “We’re only at the
beginning stages of that,” says Eckman. “The idea is that the portal
will be the first point of contact where people find out what the vari‐
ous platforms offer, and where they can put data into the system as
well as take it out.”
In the middle of everything is the data governance piece, which is
what Eckman leads. “We make sure that at every point, we know
what the data looks like. If it’s enriched, it has to have another
schema. We trace the lineage precisely.”
Comcast also has in-house analytics resources. Data engineers look
at the data in the data lake, and aggregate the network traffic data.
They can aggregate it by 15-minute intervals or half-hour intervals,
or aggregate it by region. They can slice and dice it any way they
want.
“Everyone has his or her own role to play,” says Eckman. “My team
makes sure the data works. The data engineering team makes sure
that what they built on top of it works. Then there are the outside
analysts who use the various platforms to do their own analyses.
That’s how it’s structured.”
All of this is being done in the cloud. Comcast uses Amazon Web
Services (AWS). “One of the wonderful things about Apache Atlas is
that it’s extensible, so we extended it to include new data types that
are specific to AWS,” says Eckman. “We’re maintaining Hive tables
and saving lineages in a highly heterogeneous environment. We use
AWS object stores rather than HDFS [Hadoop data file system], and
AWS lambda functions to capture end-to-end lineage, not limited to
the data lake. We think this is pretty darn cool.”
Comcast’s vision is to offer a single platform. “I don’t know if we’ll
ever get to be the platform for Comcast as a whole,” says Eckman.
46 | Chapter 5: Comcast: How a Focus on Customer Experience Led to a Focus on Data Science](https://image.slidesharecdn.com/ebook-creating-a-data-driven-enterprise-in-media-210623140704/75/O-Reilly-eBook-Creating-a-Data-Driven-Enterprise-in-Media-eubolr-52-2048.jpg)


![[DevFest Strasbourg 2025] - NodeJs Can do that !!](https://cdn.slidesharecdn.com/ss_thumbnails/devfeststrasbourg2025-nodejscandothat-251127142731-da65b6fd-thumbnail.jpg?width=640&height=640&fit=bounds)
![[BDD 2025 - Mobile Development] Mobile Engineer and Software Engineer: Are we...](https://cdn.slidesharecdn.com/ss_thumbnails/md-mobileengineerandsoftwareengineerarewestillrelevantsidiqpermana-251127010650-55224ef1-thumbnail.jpg?width=640&height=640&fit=bounds)


![Support, Monitoring, Continuous Improvement & Scaling Agentic Automation [3/3]](https://cdn.slidesharecdn.com/ss_thumbnails/agenticcommunityseries-day3-cfd-251120170304-ddef8112-thumbnail.jpg?width=640&height=640&fit=bounds)
![[BDD 2025 - Full-Stack Development] PHP in AI Age: The Laravel Way. (Rizqy Hi...](https://cdn.slidesharecdn.com/ss_thumbnails/fs-phpinaiagethelaravelway-251125012602-ef9d330e-thumbnail.jpg?width=640&height=640&fit=bounds)

![[BDD 2025 - Full-Stack Development] The Modern Stack: Building Web & AI Appli...](https://cdn.slidesharecdn.com/ss_thumbnails/fs-themodernstackbuildingwebaiapplicationswithserverless-251124030844-388cf04f-thumbnail.jpg?width=640&height=640&fit=bounds)

