Download to read offline
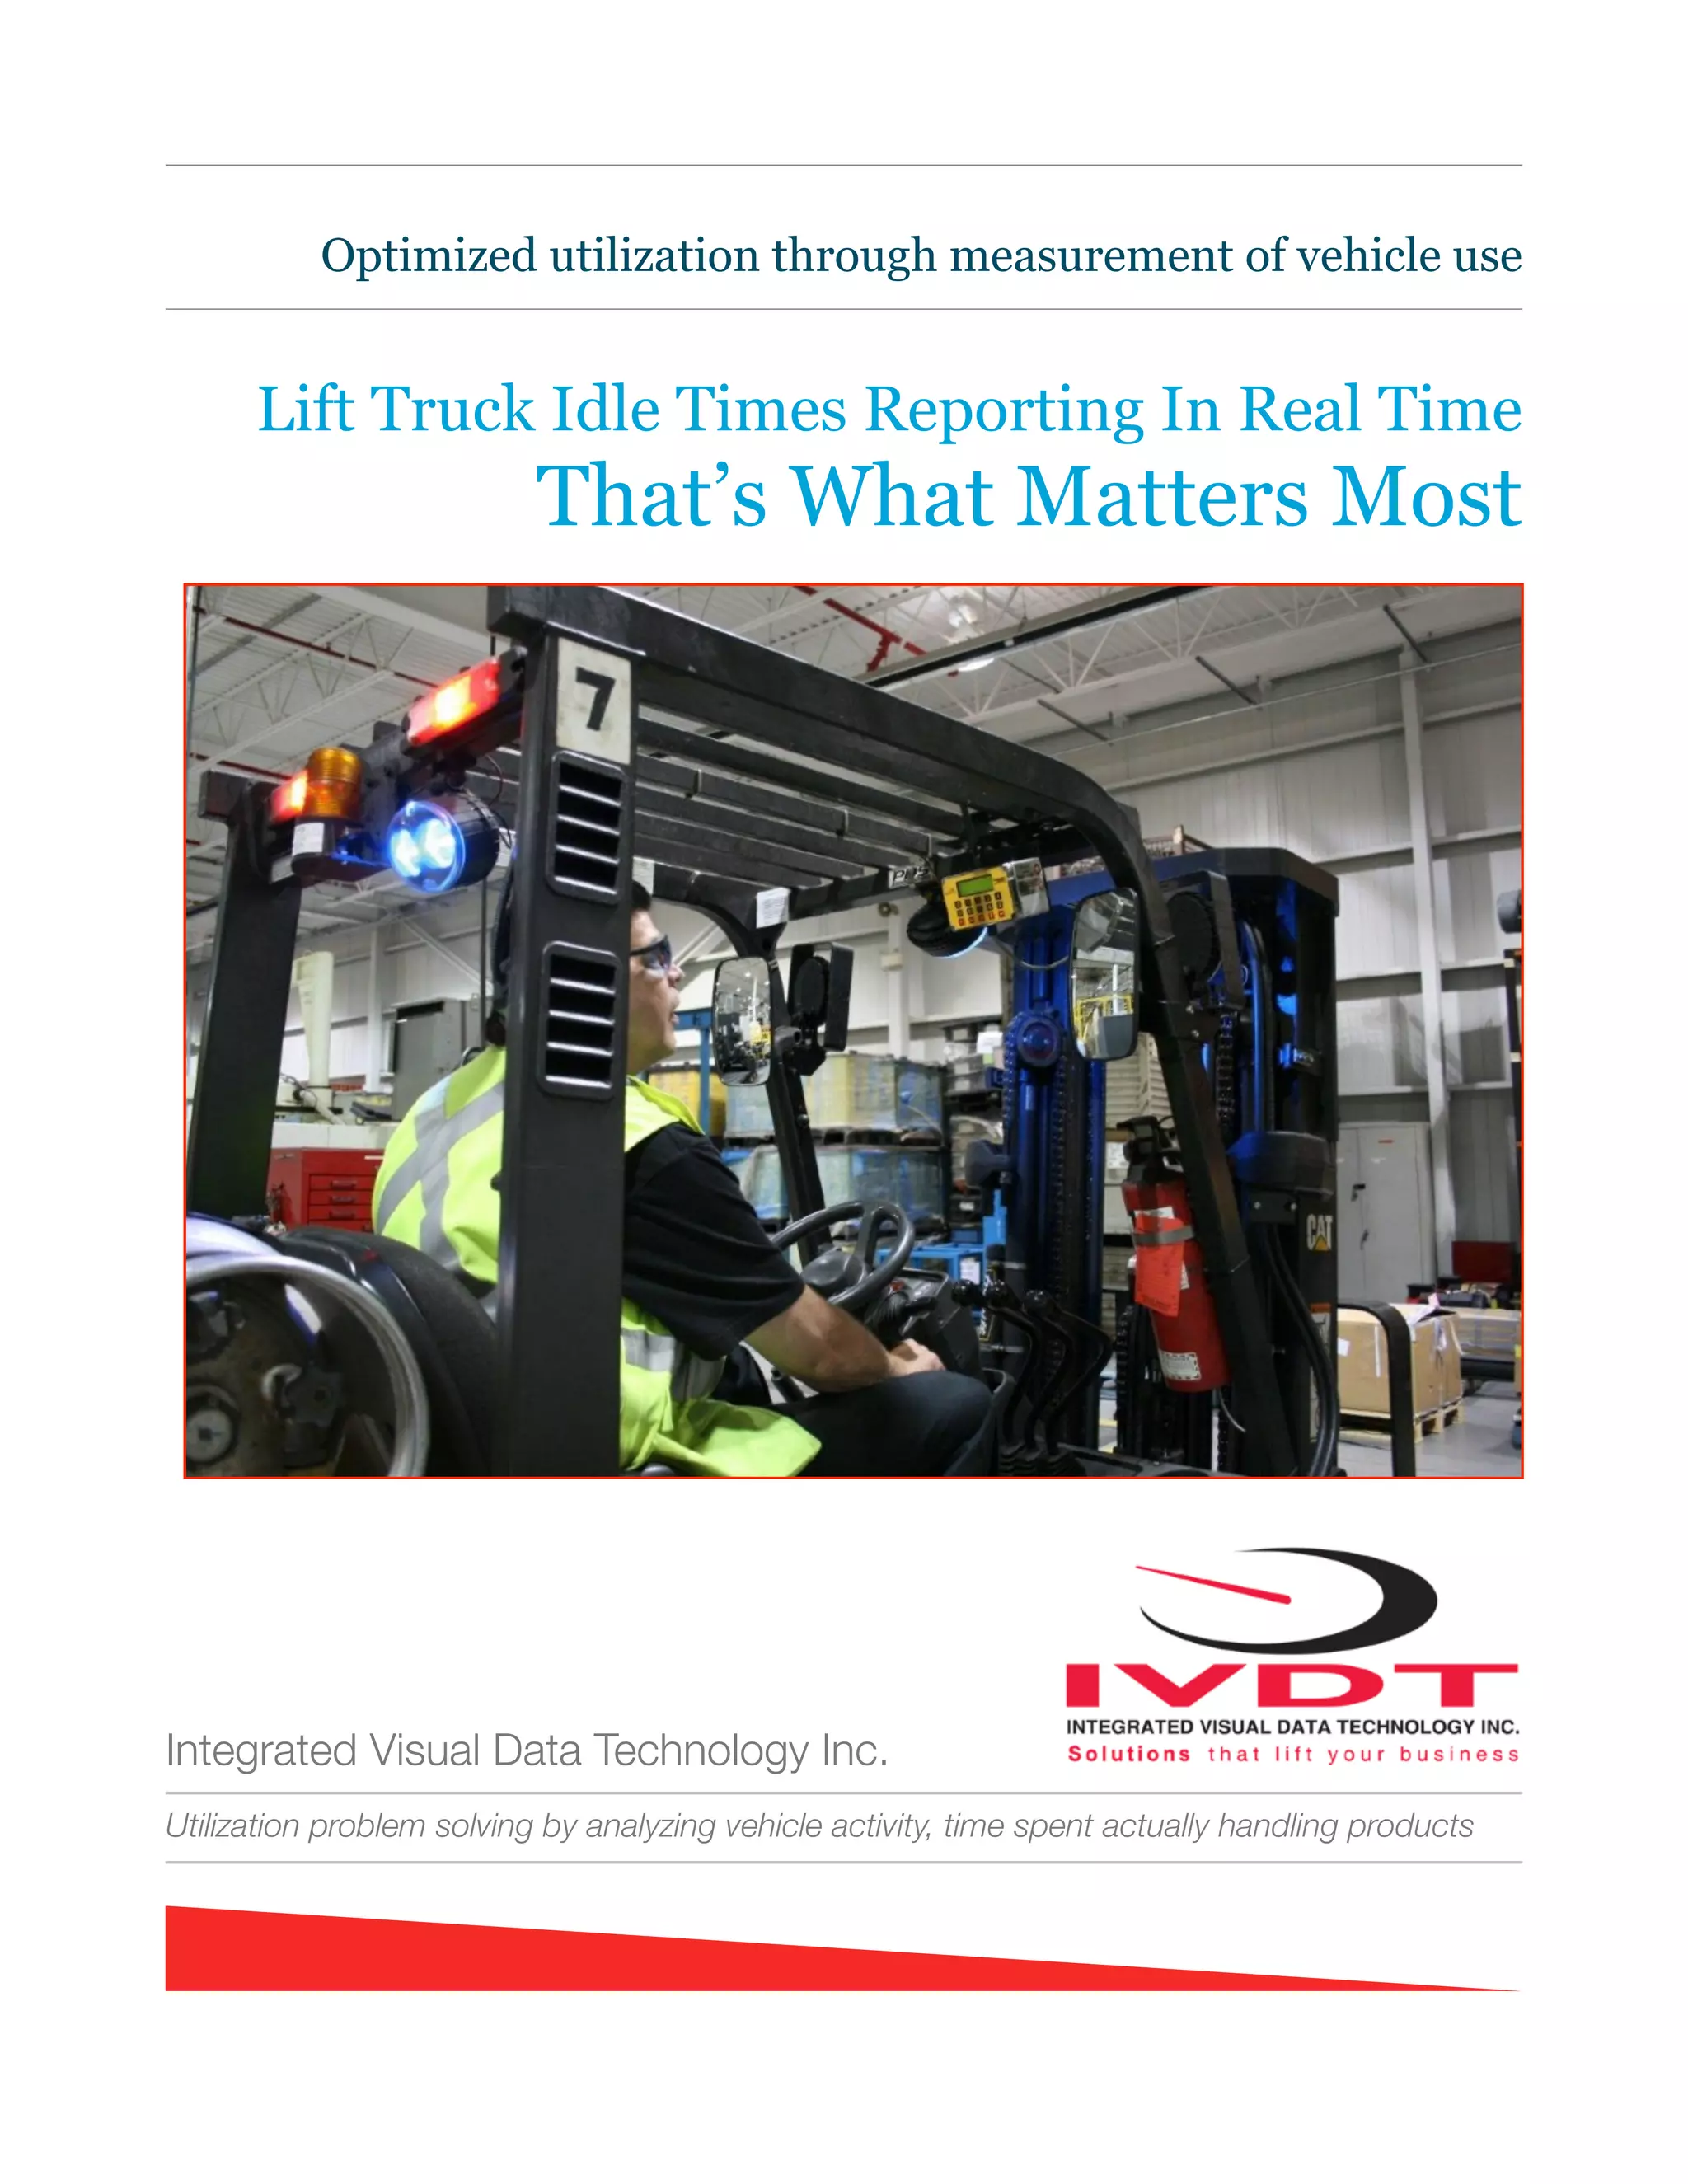

The document discusses the optimization of vehicle utilization in material handling operations through real-time measurement and reporting of lift truck idle times. Key performance indicators (KPIs) are emphasized as critical for driving improvements in productivity and managing costs associated with operator efficiency. The implementation of systems like the UT SkidWeigh Plus can significantly enhance productivity by providing immediate access to vehicle usage data and facilitating operator accountability.


