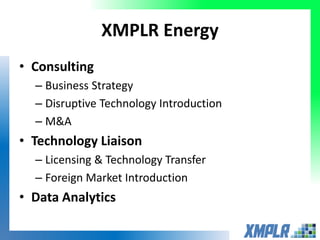
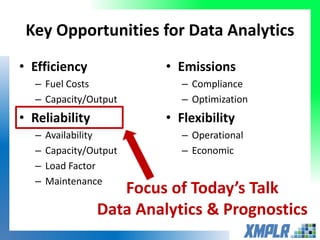
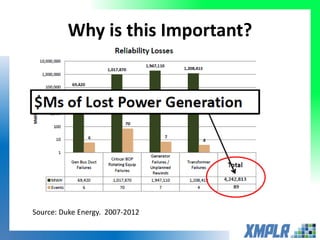
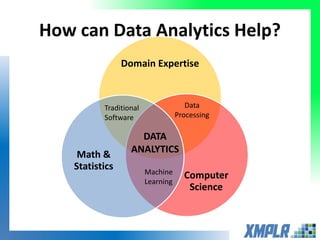
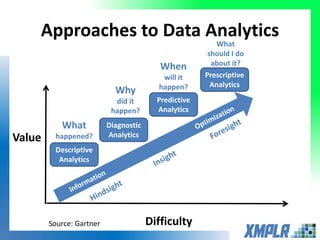
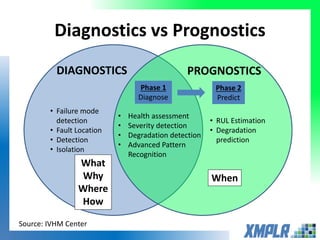
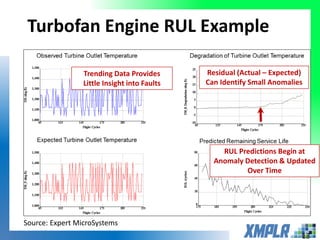
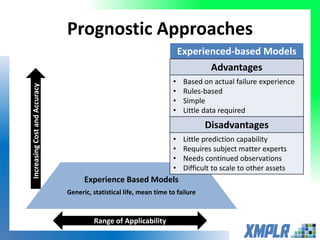
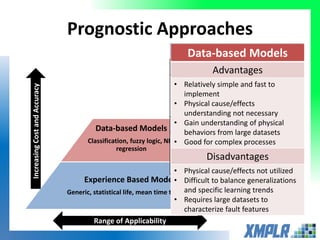
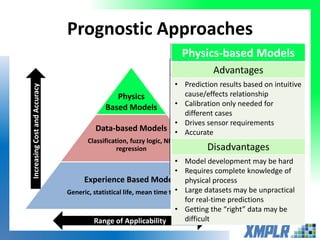
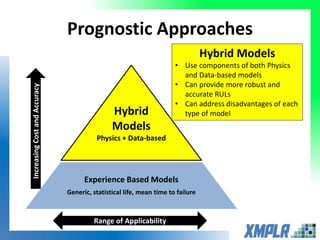
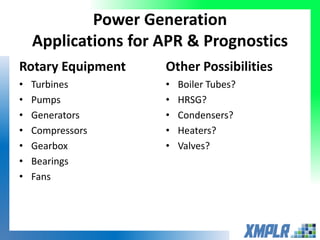
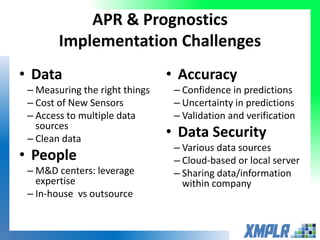
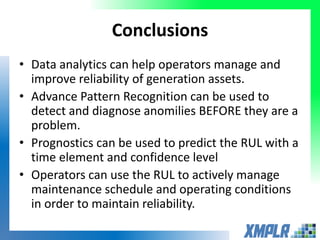
Opportunities for Data Analytics in
Power Generation
Scott Affelt
XMPLR Energy
XMPLR Energy
• Consulting
– Business Strategy
– Disruptive Technology Introduction
– M&A
• Technology Liaison
– Licensing & Technology Transfer
– Foreign Market Introduction
• Data Analytics
Key Opportunities for Data Analytics
• Efficiency
– Fuel Costs
– Capacity/Output
• Reliability
– Availability
– Capacity/Output
– Load Factor
– Maintenance
• Emissions
– Compliance
– Optimization
• Flexibility
– Operational
– Economic
Focus of Today’s Talk
Data Analytics & Prognostics
Why is this Important?
Source: Duke Energy. 2007-2012
Why is this Important?
• MIT Study:
➢ Bearing Failures in Rotating Equipment
cause $240B in downtime and repair costs
EVERY YEAR!
• DOE Study on Predictive Maintenance:
➢Reduce equipment downtime by 35%
➢Reduce unplanned breakdowns by 70%
➢Reduce plant maintenance costs by 25%
Domain Expertise
Computer
Science
Math &
Statistics
How can Data Analytics Help?
Machine
Learning
Data
Processing
Traditional
Software
DATA
ANALYTICS
Approaches to Data Analytics
Difficulty
Value
Descriptive
Analytics
What
happened?
Diagnostic
Analytics
Why
did it
happen?
Predictive
Analytics
When
will it
happen?
Prescriptive
Analytics
What
should I do
about it?
Source: Gartner
Diagnostics vs Prognostics
• Failure mode
detection
• Fault Location
• Detection
• Isolation
• RUL Estimation
• Degradation
prediction
• Health assessment
• Severity detection
• Degradation detection
• Advanced Pattern
Recognition
DIAGNOSTICS PROGNOSTICS
Source: IVHM Center
What
Why
Where
How
When
Phase 1
Diagnose
Phase 2
Predict
Traditional Failure Curve
• Failure rates are high in the early life – “infant mortality”
• Failure rates are high at the end of life
• Remaining useful life can be predicted.
• Based on assets that have regular & predictable wear
• The Rise of Predictive Maintenance!
Source: EPRI
Predictive Maintenance
Time
Equipment
HealthIndex
Total Cost
Reactive:
Run to
Failure
Preventative:
Schedule Base
Predictive:
Condition-based
Advanced Patterns
Prognostics
Cost
Fault
Equipment Fails Here
Degradation
Starts
Here
Fault
Occurs
Here
Do Maintenance WHEN it is needed.
BEFORE Failures Occur.
Predicting Failures is Hard
Only 18% of
Failures are
age-related
82% of
Failures are
random
“It’s hard to make predictions,
especially about the future!”
Yogi Berra
Sources: RCM Guide, NASA, Sept. 2008, and U.S.. Navy Analysis of Submarine Maintenance Data 2006
„
Using Predictive Analytics
• Condition Monitoring
– Identifies anomalies in data trends
– Typically, provides little warning of a fault (hrs to days)
– Little information regarding diagnostics or prognostics
Detect
Diagnose
Predict
• Advanced Pattern Recognition
– Specific signal patterns (features) linked to faults
– Gives indication of likely future fault .
– Focused on diagnosis or cause of the fault not Remaining Useful Life.
• Prognostics
– Predicts Remaining Useful Life (RUL) of asset or component
– RUL is time at which it will no longer perform its intended function
– Includes a confidence level associated with the time prediction.
• (i.e. RUL of 3 months at 60% confidence level
Turbofan Engine RUL Example
13
Source: Expert MicroSystems
Trending Data Provides
Little Insight into Faults
Residual (Actual – Expected)
Can Identify Small Anomalies
RUL Predictions Begin at
Anomaly Detection & Updated
Over Time
Prognostic Approaches
Physics
Based Models
Data-based Models
Classification, fuzzy logic, NN,
regression
Experience Based Models
Generic, statistical life, mean time to failure
Range of Applicability
IncreasingCostandAccuracy
Experienced-based Models
Advantages
• Based on actual failure experience
• Rules-based
• Simple
• Little data required
Disadvantages
• Little prediction capability
• Requires subject matter experts
• Needs continued observations
• Difficult to scale to other assets
Data-based Models
Advantages
• Relatively simple and fast to
implement
• Physical cause/effects
understanding not necessary
• Gain understanding of physical
behaviors from large datasets
• Good for complex processes
Disadvantages
• Physical cause/effects not utilized
• Difficult to balance generalizations
and specific learning trends
• Requires large datasets to
characterize fault features
Physics-based Models
Advantages
• Prediction results based on intuitive
cause/effects relationship
• Calibration only needed for
different cases
• Drives sensor requirements
• Accurate
Disadvantages
• Model development may be hard
• Requires complete knowledge of
physical process
• Large datasets may be unpractical
for real-time predictions
• Getting the “right” data may be
difficult
Prognostic Approaches
Physics
Based Models
Data-based Models
Classification, fuzzy logic, NN,
regression
Experience Based Models
Generic, statistical life, mean time to failure
Range of Applicability
IncreasingCostandAccuracy
Hybrid
Models
Physics + Data-based
Hybrid Models
• Use components of both Physics
and Data-based models
• Can provide more robust and
accurate RULs
• Can address disadvantages of each
type of model
Power Generation
Applications for APR & Prognostics
Rotary Equipment
• Turbines
• Pumps
• Generators
• Compressors
• Gearbox
• Bearings
• Fans
Other Possibilities
• Boiler Tubes?
• HRSG?
• Condensers?
• Heaters?
• Valves?
APR & Prognostics
Implementation Challenges
• Data
– Measuring the right things
– Cost of New Sensors
– Access to multiple data
sources
– Clean data
• People
– M&D centers: leverage
expertise
– In-house vs outsource
• Accuracy
– Confidence in predictions
– Uncertainty in predictions
– Validation and verification
• Data Security
– Various data sources
– Cloud-based or local server
– Sharing data/information
within company
Conclusions
• Data analytics can help operators manage and
improve reliability of generation assets.
• Advance Pattern Recognition can be used to
detect and diagnose anomilies BEFORE they are a
problem.
• Prognostics can be used to predict the RUL with a
time element and confidence level
• Operators can use the RUL to actively manage
maintenance schedule and operating conditions
in order to maintain reliability.
Thank You.
XMPLR Energy
Saffelt@XMPLRenergy.com
303-883-0399

Opportunities for data analytics in power generation affelt 2016

  • 1.
    Opportunities for DataAnalytics in Power Generation Scott Affelt XMPLR Energy
  • 2.
    XMPLR Energy • Consulting –Business Strategy – Disruptive Technology Introduction – M&A • Technology Liaison – Licensing & Technology Transfer – Foreign Market Introduction • Data Analytics
  • 3.
    Key Opportunities forData Analytics • Efficiency – Fuel Costs – Capacity/Output • Reliability – Availability – Capacity/Output – Load Factor – Maintenance • Emissions – Compliance – Optimization • Flexibility – Operational – Economic Focus of Today’s Talk Data Analytics & Prognostics
  • 4.
    Why is thisImportant? Source: Duke Energy. 2007-2012
  • 5.
    Why is thisImportant? • MIT Study: ➢ Bearing Failures in Rotating Equipment cause $240B in downtime and repair costs EVERY YEAR! • DOE Study on Predictive Maintenance: ➢Reduce equipment downtime by 35% ➢Reduce unplanned breakdowns by 70% ➢Reduce plant maintenance costs by 25%
  • 6.
    Domain Expertise Computer Science Math & Statistics Howcan Data Analytics Help? Machine Learning Data Processing Traditional Software DATA ANALYTICS
  • 7.
    Approaches to DataAnalytics Difficulty Value Descriptive Analytics What happened? Diagnostic Analytics Why did it happen? Predictive Analytics When will it happen? Prescriptive Analytics What should I do about it? Source: Gartner
  • 8.
    Diagnostics vs Prognostics •Failure mode detection • Fault Location • Detection • Isolation • RUL Estimation • Degradation prediction • Health assessment • Severity detection • Degradation detection • Advanced Pattern Recognition DIAGNOSTICS PROGNOSTICS Source: IVHM Center What Why Where How When Phase 1 Diagnose Phase 2 Predict
  • 9.
    Traditional Failure Curve •Failure rates are high in the early life – “infant mortality” • Failure rates are high at the end of life • Remaining useful life can be predicted. • Based on assets that have regular & predictable wear • The Rise of Predictive Maintenance! Source: EPRI
  • 10.
    Predictive Maintenance Time Equipment HealthIndex Total Cost Reactive: Runto Failure Preventative: Schedule Base Predictive: Condition-based Advanced Patterns Prognostics Cost Fault Equipment Fails Here Degradation Starts Here Fault Occurs Here Do Maintenance WHEN it is needed. BEFORE Failures Occur.
  • 11.
    Predicting Failures isHard Only 18% of Failures are age-related 82% of Failures are random “It’s hard to make predictions, especially about the future!” Yogi Berra Sources: RCM Guide, NASA, Sept. 2008, and U.S.. Navy Analysis of Submarine Maintenance Data 2006 „
  • 12.
    Using Predictive Analytics •Condition Monitoring – Identifies anomalies in data trends – Typically, provides little warning of a fault (hrs to days) – Little information regarding diagnostics or prognostics Detect Diagnose Predict • Advanced Pattern Recognition – Specific signal patterns (features) linked to faults – Gives indication of likely future fault . – Focused on diagnosis or cause of the fault not Remaining Useful Life. • Prognostics – Predicts Remaining Useful Life (RUL) of asset or component – RUL is time at which it will no longer perform its intended function – Includes a confidence level associated with the time prediction. • (i.e. RUL of 3 months at 60% confidence level
  • 13.
    Turbofan Engine RULExample 13 Source: Expert MicroSystems Trending Data Provides Little Insight into Faults Residual (Actual – Expected) Can Identify Small Anomalies RUL Predictions Begin at Anomaly Detection & Updated Over Time
  • 14.
    Prognostic Approaches Physics Based Models Data-basedModels Classification, fuzzy logic, NN, regression Experience Based Models Generic, statistical life, mean time to failure Range of Applicability IncreasingCostandAccuracy Experienced-based Models Advantages • Based on actual failure experience • Rules-based • Simple • Little data required Disadvantages • Little prediction capability • Requires subject matter experts • Needs continued observations • Difficult to scale to other assets
  • 15.
    Prognostic Approaches Physics Based Models Data-basedModels Classification, fuzzy logic, NN, regression Experience Based Models Generic, statistical life, mean time to failure Range of Applicability IncreasingCostandAccuracy Experienced-based Models Advantages • Based on actual failure experience • Rules-based • Simple • Little data required Disadvantages • Little prediction capability • Requires subject matter experts • Needs continued observations • Difficult to scale to other assets Data-based Models Advantages • Relatively simple and fast to implement • Physical cause/effects understanding not necessary • Gain understanding of physical behaviors from large datasets • Good for complex processes Disadvantages • Physical cause/effects not utilized • Difficult to balance generalizations and specific learning trends • Requires large datasets to characterize fault features
  • 16.
    Prognostic Approaches Physics Based Models Data-basedModels Classification, fuzzy logic, NN, regression Experience Based Models Generic, statistical life, mean time to failure Range of Applicability IncreasingCostandAccuracy Experienced-based Models Advantages • Based on actual failure experience • Rules-based • Simple • Little data required Disadvantages • Little prediction capability • Requires subject matter experts • Needs continued observations • Difficult to scale to other assets Data-based Models Advantages • Relatively simple and fast to implement • Physical cause/effects understanding not necessary • Gain understanding of physical behaviors from large datasets • Good for complex processes Disadvantages • Physical cause/effects not utilized • Difficult to balance generalizations and specific learning trends • Requires large datasets to characterize fault features Physics-based Models Advantages • Prediction results based on intuitive cause/effects relationship • Calibration only needed for different cases • Drives sensor requirements • Accurate Disadvantages • Model development may be hard • Requires complete knowledge of physical process • Large datasets may be unpractical for real-time predictions • Getting the “right” data may be difficult
  • 17.
    Prognostic Approaches Physics Based Models Data-basedModels Classification, fuzzy logic, NN, regression Experience Based Models Generic, statistical life, mean time to failure Range of Applicability IncreasingCostandAccuracy Hybrid Models Physics + Data-based Hybrid Models • Use components of both Physics and Data-based models • Can provide more robust and accurate RULs • Can address disadvantages of each type of model
  • 18.
    Power Generation Applications forAPR & Prognostics Rotary Equipment • Turbines • Pumps • Generators • Compressors • Gearbox • Bearings • Fans Other Possibilities • Boiler Tubes? • HRSG? • Condensers? • Heaters? • Valves?
  • 19.
    APR & Prognostics ImplementationChallenges • Data – Measuring the right things – Cost of New Sensors – Access to multiple data sources – Clean data • People – M&D centers: leverage expertise – In-house vs outsource • Accuracy – Confidence in predictions – Uncertainty in predictions – Validation and verification • Data Security – Various data sources – Cloud-based or local server – Sharing data/information within company
  • 20.
    Conclusions • Data analyticscan help operators manage and improve reliability of generation assets. • Advance Pattern Recognition can be used to detect and diagnose anomilies BEFORE they are a problem. • Prognostics can be used to predict the RUL with a time element and confidence level • Operators can use the RUL to actively manage maintenance schedule and operating conditions in order to maintain reliability.
  • 21.