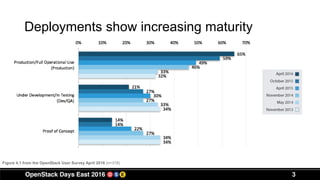
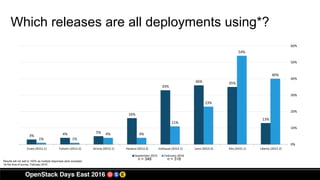
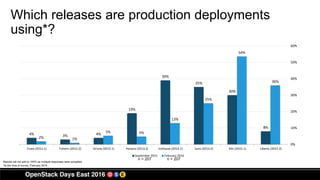
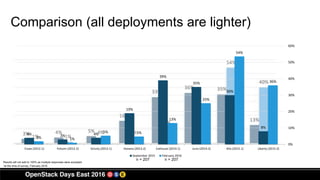
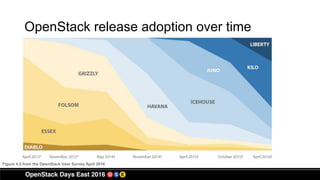
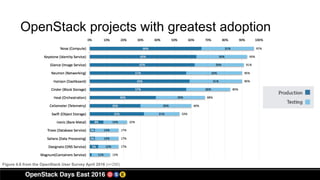
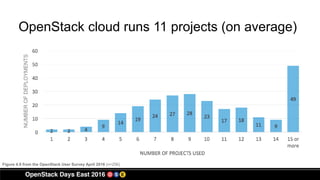
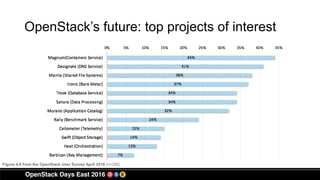
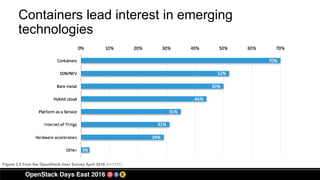
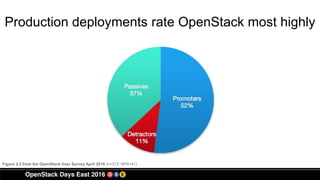
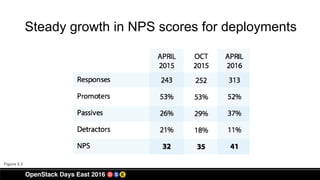
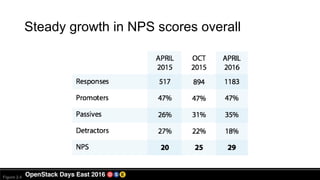
OpenStack by the Numbers
Myth-busting, disruptive trends &
insights from the User Survey
Heidi Joy Tretheway, OpenStack Foundation
Shamail Tahir, IBM
August 23, 2016
2
It’s a science project
—not ready for production
Deployments show increasing maturity
3
Figure 4.1 from the OpenStack User Survey April 2016 (n=318)
4
It’s impossible to keep up
with the release cycles.
Which releases are all deployments using*?
3% 4% 5%
16%
33%
36% 35%
13%
1% 1%
4% 4%
11%
23%
54%
40%
0%
10%
20%
30%
40%
50%
60%
Essex (2012.1) Folsom (2012.2) Grizzly (2013.1) Havana (2013.2) Icehouse (2014.1) Juno (2014.2) Kilo (2015.1) Liberty (2015.2)
September 2015 February 2016
n = 318
*at the time of survey, February 2016
n = 348Results will not add to 100% as multiple responses were accepted.
Which releases are production deployments
using*?
4% 3% 4%
19%
39%
35%
30%
8%
2% 1%
5% 5%
13%
25%
54%
36%
0%
10%
20%
30%
40%
50%
60%
Essex (2012.1) Folsom (2012.2) Grizzly (2013.1) Havana (2013.2) Icehouse (2014.1) Juno (2014.2) Kilo (2015.1) Liberty (2015.2)
September 2015 February 2016
n = 207
*at the time of survey, February 2016
n = 207
Results will not add to 100% as multiple responses were accepted.
Comparison (all deployments are lighter)
4% 3% 4%
19%
39%
35%
30%
8%
2% 1%
5% 5%
13%
25%
54%
36%
0%
10%
20%
30%
40%
50%
60%
Essex (2012.1) Folsom (2012.2) Grizzly (2013.1) Havana (2013.2) Icehouse (2014.1) Juno (2014.2) Kilo (2015.1) Liberty (2015.2)
September 2015 February 2016
n = 207
*at the time of survey, February 2016
n = 207
Results will not add to 100% as multiple responses were accepted.
OpenStack release adoption over time
Figure 4.5 from the OpenStack User Survey April 2016
9
Most people just
use OpenStack
for compute
and identity.
OpenStack projects with greatest adoption
Figure 4.6 from the OpenStack User Survey April 2016 (n=290)
OpenStack cloud runs 11 projects (on average)NUMBEROFDEPLOYMENTS
Figure 4.9 from the OpenStack User Survey April 2016 (n=256)
OpenStack’s future: top projects of interest
Figure 4.8 from the OpenStack User Survey April 2016 (n=290)
13
Containers and NFV
are the wild west of
tech—not ready for
primetime.
OpenStack’s future: top projects of interest
Figure 4.8 from the OpenStack User Survey April 2016 (n=290)
Containers lead interest in emerging
technologies
Figure 2.5 from the OpenStack User Survey April 2016 (n=1131)
16
OpenStack isn’t as good
as a commercial solution.
Production deployments rate OpenStack most highly
Figure 2.2 from the OpenStack User Survey April 2016 (n=313; NPS=41)
Steady growth in NPS scores for deployments
Figure 2.3
Steady growth in NPS scores overall
Figure 2.4
20
Enough with telling me about
the User Survey. I want to do
my own data analysis.
openstack.org/survey-report
Resources
User Survey
openstack.org/user-survey
Top 10 insights on YouTube:
https://www.youtube.com/
watch?v=lmu5r7BCY_U
Network Functions Virtualization
openstack.org/telecoms-and-nfv/
Containers
openstack.org/containers
The Path to Cloud
openstack.org/enterprise
Mitaka release
Marketing preview has 1,300+
views on YouTube.
openstack.org/software/mitaka
USER SURVEY CREDITS
The OpenStack User Committee includes Edgar Magaña,
Jonathan Proulx, and Shilla Saebi. Comment analysis and
report review provided by the User Committee and the User
Survey Team, including Carol Barrett, Kenny Johnston, Piet
Kruithof, Yih Leong Sun, and Shamail Tahir.
Survey team participation is open to any community member
and requires a confidentiality agreement.
Heidi Joy Tretheway from the OpenStack Foundation staff leads
creation of the survey and report, with support from Anne
Bertucio, Jonathan Bryce, Tom Fifield, Jimmy McArthur, and
Lauren Sell.
The OpenStack Foundation partnered with independent data
scientist Kelly Valade to analyze and chart the data.

OpenStack by the Numbers

  • 1.
    OpenStack by theNumbers Myth-busting, disruptive trends & insights from the User Survey Heidi Joy Tretheway, OpenStack Foundation Shamail Tahir, IBM August 23, 2016
  • 2.
    2 It’s a scienceproject —not ready for production
  • 3.
    Deployments show increasingmaturity 3 Figure 4.1 from the OpenStack User Survey April 2016 (n=318)
  • 4.
    4 It’s impossible tokeep up with the release cycles.
  • 5.
    Which releases areall deployments using*? 3% 4% 5% 16% 33% 36% 35% 13% 1% 1% 4% 4% 11% 23% 54% 40% 0% 10% 20% 30% 40% 50% 60% Essex (2012.1) Folsom (2012.2) Grizzly (2013.1) Havana (2013.2) Icehouse (2014.1) Juno (2014.2) Kilo (2015.1) Liberty (2015.2) September 2015 February 2016 n = 318 *at the time of survey, February 2016 n = 348Results will not add to 100% as multiple responses were accepted.
  • 6.
    Which releases areproduction deployments using*? 4% 3% 4% 19% 39% 35% 30% 8% 2% 1% 5% 5% 13% 25% 54% 36% 0% 10% 20% 30% 40% 50% 60% Essex (2012.1) Folsom (2012.2) Grizzly (2013.1) Havana (2013.2) Icehouse (2014.1) Juno (2014.2) Kilo (2015.1) Liberty (2015.2) September 2015 February 2016 n = 207 *at the time of survey, February 2016 n = 207 Results will not add to 100% as multiple responses were accepted.
  • 7.
    Comparison (all deploymentsare lighter) 4% 3% 4% 19% 39% 35% 30% 8% 2% 1% 5% 5% 13% 25% 54% 36% 0% 10% 20% 30% 40% 50% 60% Essex (2012.1) Folsom (2012.2) Grizzly (2013.1) Havana (2013.2) Icehouse (2014.1) Juno (2014.2) Kilo (2015.1) Liberty (2015.2) September 2015 February 2016 n = 207 *at the time of survey, February 2016 n = 207 Results will not add to 100% as multiple responses were accepted.
  • 8.
    OpenStack release adoptionover time Figure 4.5 from the OpenStack User Survey April 2016
  • 9.
    9 Most people just useOpenStack for compute and identity.
  • 10.
    OpenStack projects withgreatest adoption Figure 4.6 from the OpenStack User Survey April 2016 (n=290)
  • 11.
    OpenStack cloud runs11 projects (on average)NUMBEROFDEPLOYMENTS Figure 4.9 from the OpenStack User Survey April 2016 (n=256)
  • 12.
    OpenStack’s future: topprojects of interest Figure 4.8 from the OpenStack User Survey April 2016 (n=290)
  • 13.
    13 Containers and NFV arethe wild west of tech—not ready for primetime.
  • 14.
    OpenStack’s future: topprojects of interest Figure 4.8 from the OpenStack User Survey April 2016 (n=290)
  • 15.
    Containers lead interestin emerging technologies Figure 2.5 from the OpenStack User Survey April 2016 (n=1131)
  • 16.
    16 OpenStack isn’t asgood as a commercial solution.
  • 17.
    Production deployments rateOpenStack most highly Figure 2.2 from the OpenStack User Survey April 2016 (n=313; NPS=41)
  • 18.
    Steady growth inNPS scores for deployments Figure 2.3
  • 19.
    Steady growth inNPS scores overall Figure 2.4
  • 20.
    20 Enough with tellingme about the User Survey. I want to do my own data analysis.
  • 25.
  • 26.
  • 27.
    User Survey openstack.org/user-survey Top 10insights on YouTube: https://www.youtube.com/ watch?v=lmu5r7BCY_U
  • 28.
  • 29.
  • 30.
    The Path toCloud openstack.org/enterprise
  • 31.
    Mitaka release Marketing previewhas 1,300+ views on YouTube. openstack.org/software/mitaka
  • 32.
    USER SURVEY CREDITS TheOpenStack User Committee includes Edgar Magaña, Jonathan Proulx, and Shilla Saebi. Comment analysis and report review provided by the User Committee and the User Survey Team, including Carol Barrett, Kenny Johnston, Piet Kruithof, Yih Leong Sun, and Shamail Tahir. Survey team participation is open to any community member and requires a confidentiality agreement. Heidi Joy Tretheway from the OpenStack Foundation staff leads creation of the survey and report, with support from Anne Bertucio, Jonathan Bryce, Tom Fifield, Jimmy McArthur, and Lauren Sell. The OpenStack Foundation partnered with independent data scientist Kelly Valade to analyze and chart the data.

Editor's Notes

  • #2 OpenStack by the Numbers: Disruptive Trends & Insights from the user survey What it reveals about our community & tech Why they matter, mythbusting, stats & stories Heidi Joy Tretheway/ Shamail Tahir Myth: OpenStack is a science project, 6 nodes in a rack in a dark corner of the data center. Deployments showing increased maturity --SHAMAIL Slide 26 - 33% more than a year ago, nearly 200% more than 2 years ago Trajectory: flattens Next year: we'll ask how old their clouds are Myth: The software release cycle is too fast; it's impossible to keep up How fast are companies adopting new releases? -- HEIDI JOY HJ add 2 charts on overall release, and product deployment release lags compared to overall Slide 16 - call out the comparison toward the 2 most recent releases (from 3) Myth: People only use compute and identity, or computer/identity/networking Which projects are being adopted most and/or fastest? -- SHAMAIL Overall adoption (slide 11) Number of projects adopted (slide 18) - HJ had a hypothesis that only the core services were being used. Projects of interest (slide 14) Myth: Containers and NFV are the wild west of tech--not ready for primetime How significant is interest in containers and other emerging technologies? --SHAMAIL Point to Magnum, slide 14 Emerging technologies (slide 13) - and discuss NFV, bare metal, hybrid  (NFV story - full production by 10 global telcos demonstrated in whitepaper) Myth: Open source isn't as good as a commercial solution. (or: is a criticism I'm hearing mass opinion or one person's perspective?) How satisfied are OpenStack's users (NPS)? --HEIDI JOY Slides 23, 24 Call out the top themes for positive and negative (what are the REAL complaints/ compliments) - this is what the community needs to work on Present the survey analysis tool --HEIDI JOY Examples of cool stuff Questions/color commentary -- SHAMAIL Additional resources: --BOTH Community generated roadmap - SHAMAIL NFV whitepaper Containers web page Project navigator The OpenStack Strategy & Planning Guide (EWG's business perspectives + path to cloud booklets) How to get involved/give feedback? --User committee      This is the seventh survey of OpenStack’s community and users since April 2013, with a goal of better understanding attitudes, organizational profiles, use cases, and technology choices across the community’s various deployment stages and sizes. This survey report analyzes respondents who completed or updated the survey during a three-week period in February 2016. There are some modifications from prior surveys, in keeping with the evolution of the OpenStack platform and user feedback. The survey questions and report are guided by the OpenStack User Committee with the support of Foundation staff and an independent data scientist. This survey represents a snapshot of 1,603 community members and 405 user deployments provided voluntarily. Insights are intended to provide feedback to the broader community and to arm technical leaders and contributors with better data to make decisions regarding the roadmap and feature enhancements. The User Survey is not a market survey and does not express all OpenStack deployments worldwide. When reading the report and statistics, remember that the typical respondent is an informed user or someone actively engaged in the OpenStack community. We have not attempted to normalize the survey data to be more widely representative, since we believe respondents are more representative of decision makers. Not all users answered all survey questions, so the N number (population size) varies by question.
  • #4 We look at the proportion of clouds in production to those in proof of concept or QA/testing phase. Today, almost two-thirds of OpenStack clouds are in production or full operational use. That number grew 33% in just 12 months (up 16 points vs. April 2015). This shows OpenStack’s maturity as a proven business solution. (MATH on the % increase in production clouds: ) Number in production this year (65) minus 1 year ago (49) = 16. 16/49 = 33%, so there are 33% more clouds in production vs. 1 year ago. In this cycle, we see proof of OpenStack’s maturity as now nearly two-thirds of clouds are in production or full operational use. That’s a 16-point increase over the survey conducted one year ago, and it represents statistically significant growth and development. Likewise, the proportion of cloud deployments in the test stage has significantly declined. Remember, just 39% of deployments answered both this survey and the prior survey, so we’re looking at a substantially different cross-section of the community in this survey cycle, yet the results continue to trend consistently upward toward full operational use.
  • #6 Q16: CurrentReleases: Which releases are deployments using*? *at the time of survey, September 2015 Separate bar chart with % answers (include only deployments in production, Q.12). Trunk + Liberty = Trunk 2015 Report: Page 20
  • #7 Q16: CurrentReleases: Which releases are deployments using*? *at the time of survey, September 2015 Separate bar chart with % answers (include only deployments in production, Q.12). Trunk + Liberty = Trunk 2015 Report: Page 20
  • #8 Q16: CurrentReleases: Which releases are deployments using*? *at the time of survey, September 2015 Separate bar chart with % answers (include only deployments in production, Q.12). Trunk + Liberty = Trunk 2015 Report: Page 20
  • #9 SHILLA Some releases get more adoption than others. For example, this chart shows how the release Icehouse was more popularly adopted than Havana. In the last survey, most deployments were running the three most recent releases (Kilo, Juno and Icehouse). In this survey, most deployments are running the two latest releases (Liberty and Kilo). We see a strong shift among all deployments to adopting the latest releases. We used data from the previous chart [figure 4.4, production deployments, by release] combined with historical data on release adoption to create this area chart depicting current OpenStack release adoption. This chart again demonstrates the strong adoption of Kilo and shift toward the most recent versions of OpenStack software. *April 2013 and November 2013 figures include all deployments † May 2014 – April 2016 figures represent production deployments only N=207 for April 2016 but is variable for this chart, expressed at 100%
  • #11 Five projects have been adopted by 90% of clouds. In the last survey, the top six projects ranged from 78% to 85%—now the range is 83% to 97%. In addition to asking about a cloud’s overall deployment stage—production/full operational use, QA/testing, or proof of concept—we asked about how individual projects are being used and their level of readiness. New survey logic in this cycle ensured that an individual project could only be designated “in production” if the respondent’s cloud was also marked “in production.” Among 290 deployments answering this question, the majority of the top six adopted projects (Keystone, Nova, Horizon, Glance, Neutron and Cinder) are in production. In the last survey, the top six projects were in testing or production for between 78% and 85% of deployments. In this survey, adoption soared to between 83% and 97%, with five projects at 90% adoption or higher.
  • #12 Most clouds use a lot more projects than just OpenStack’s six ”core services.” A typical cloud (the top of this curve) runs 9.8 projects (2511 projects / 256 responses). This spike at the end is the sum of the long tail of deployments running 15 or more projects. Almost 50 deployments (in production or QA) run more than 15 different OpenStack projects! In this cycle, we wanted to know not only the adoption rate per project, but also how many projects a typical cloud has adopted. We looked only at clouds in production or Dev/QA stage (excluding those at proof of concept stage). Additionally, the chart below reflects only projects in production or testing phase, excluding instances where the respondent simply indicated interest in the project. We hypothesized that OpenStack’s core services plus a few additional projects were likely to be in use, and among deployments in production, 77% are using between five and nine projects in production or test phase. However, we were surprised to learn that the average number of projects in use among all production or QA deployments was 11. The average number of projects that clouds are using in test phase is five, with 57% of deployments testing one to four projects, and 25% of deployments indicating that they are testing 15 or more projects.
  • #13 In addition to asking about deployments running projects in production or test phase, we asked about projects they’re interested in running in the future. So this chart suggests where OpenStack is going. Further reinforcing interest in containers, the containers service Magnum is also at the top of the list for projects of interest. So, what does the future of OpenStack look like? Due to the change in survey design, many more users indicated interest in emerging OpenStack projects, especially in containers service Magnum, DNS service Designate, and the shared file system Manila.
  • #15 In addition to asking about deployments running projects in production or test phase, we asked about projects they’re interested in running in the future. So this chart suggests where OpenStack is going. Further reinforcing interest in containers, the containers service Magnum is also at the top of the list for projects of interest. So, what does the future of OpenStack look like? Due to the change in survey design, many more users indicated interest in emerging OpenStack projects, especially in containers service Magnum, DNS service Designate, and the shared file system Manila.
  • #16 For the second survey in a row, Containers lead the list of emerging technology of greatest interest to users. SDN/NFV was also of major interest. Bare metal is new on the list this year but half of users noted interest in it. OpenStack adapts and grows with emerging technology, making it an innovation engine for companies as their platforms develop. The proportion of users answering this question increased 34% over last cycle, and several new technologies, including bare metal, hybrid cloud, and hardware accelerators, were added to the list. Containers remain of greatest interest to survey respondents, at 70% this cycle, six points lower than last cycle. Software-defined networking (SDN) and network functions virtualization (NFV) were second-most intriguing, though seven points off last cycle’s 59% of indicated interest. Other technologies that users noted in the “other” field include: Running containers on bare metal; Federated identity; Self-healing and automated clouds; and Single root I/O virtualization (SR-IOV).
  • #18 NPS is % of promoters minus % of detractors. In our case, 41, but it can range from -100 to +100. A NPS of 41 is off-the-charts good: the industry average for software is about 19. We also asked a follow-up question, what is the primary basis of your score? See verbatim comments in the user survey report. We asked the classic Net Promoter Score (NPS) question, “How likely are you to recommend OpenStack to a friend or colleague?” Responses ranged from 0 to 10, with 10 being the highest. Scores of 9 or 10 are “promoters,” scores of 7 or 8 are “passives,” and scores 0 through 6 are “detractors.” In keeping with the NPS methodology advised by Satmetrix, OpenStack’s score is calculated by taking the percentage of promoters (those rating OpenStack a 9 or 10) and subtracting the percentage of detractors (ratings of 0-6). The result can range from -100 to +100. OpenStack’s Net Promoter Score is 29. Context is critical when viewing this number. Consider the NPS scores released by Satmetrix in its 2015 US Consumer Study, published in May 2015. Satmetrix surveyed 30,000 respondents in 22 categories. The highest NPS scores were achieved by department/specialty stores (industry average NPS ~57) brokerage/investments (industry average ~45), tablet computers (industry average ~44) and smartphones (industry average ~40). Software and apps earn typically lower NPS scores (industry average ~19). Satmetrix released a chart detailing NPS high/low scores earned by industry, as well as the 25th, 50th and 75th percentile scores, and the industry average. In the software and apps category, the scores were approximately: Lowest: -10; 25th percentile: 7; 50th percentile: 22; 75th percentile: 28; Top score: 53. OpenStack’s overall Net Promoter Score of 29, which would place it in the top one-quarter to one-fifth of software companies, is based on 1,183 individual answers. Nearly half of responding OpenStack community members are promoters of OpenStack (47%), while just 18% are detractors. There is a clear trend of increasing satisfaction with OpenStack among community members as shown by survey results, with the number of promoters holding steady as the number of detractors declines. It is significant to note that the sample size has more than doubled over the three surveys.
  • #19 We think the NPS trend is a key indicator, and it has grown 9 points over 3 survey cycles. We see highest results from those with deployments in production or QA. In our prior survey reporting, preliminary results did not properly compare data sets, resulting in an initially reported drop in the NPS score from April 2015 to September 2015. This was in error, because it compared NPS scores from users with deployments from the April 2015 survey (n=270) to NPS scores from community members as a whole from the September 2015 survey (n=894). Further questions from the user committee in November and December 2015 prompted us to reevaluate the scores by asking a single data scientist to compare the raw data from each of three reports, rather than comparing results produced by different firms. Now, figure 2.4 shows the clear increase in NPS scores over time among all community members surveyed. Additionally, we looked at a subset of NPS scores from users with deployments, shown in figures 2.2 and 2.3. Users with deployments tend to rate OpenStack more highly than OpenStack community members in general, and users with production deployments tend to rate OpenStack most highly of all, with an NPS of 54. Among users with deployments at any stage, the NPS score has increased 9 points, from 32 a year ago to 41 today. We looked at NPS scores through a variety of filters (user role, organizational size, geographic location, etc.) in the past survey cycle and found no significant differences. In this cycle, we tried another method to consider data by weighting organizational scores so that each organization was represented equally by the average score all of their affiliated respondents gave. Through this filter, the NPS for this cycle improves by two points, while it declines by two points for the prior survey cycle.
  • #20 Also among all users, we saw a clear trend toward an increasing NPS score. When asked for the primary reason for their score, positives were community support, avoiding vendor lock-in, consistency, stability, and open source. On the negative side, complexity, difficulty in deployment, inconsistency, and lack of stability were cited. In addition to asking how likely respondents are to refer OpenStack to a friend or colleague on a 0-10 scale, we asked a neutral follow-up question: “What was the primary basis for your score?” Nine themes emerged. On the positive side, community support, avoiding vendor lock-in, consistency, stability, and the importance of open source were key drivers. On the negative side, complexity, difficulty in deployment, inconsistency, and lack of stability were cited. We dug into the comments here: Good Community Support “Huge community support, availability of fast response for problems, encouraging developers and new contributors.” “Large participation among open source community developers.” “Open and helpful community, fast innovation, flexibility.” “I’ve been involved in the community for almost three years and the speed and agility of this technology is unparalleled.” Complexity “While I would recommend it to an organization of any size, its robust feature set does bring significant complexity, which I feel detracts from the benefits for small- to mid-size deployers.” “OpenStack is great to recommend, however there’s a fair amount of complexity that needs to be tackled if one wishes to use it.” “Main reasons not to rate it higher are the deployment/operations complexity, meaning it doesn’t just work as easily as [a vendor solution].” “Complexity to deploy and operate.” “There are definitely still maturity and complexity issues with OpenStack.” Difficulty to Deploy “OpenStack lacks far too many core components for anything other than very specialized deployments.” “Takes a lot of work to decide on deployment architecture, deploying, and maintaining the software.” “Frequent releases; keeping up in an operational working deployment model is hard to achieve.” Avoids Vendor Lock-in “In my opinion, vendor lock-in is one of the reasons why closed platforms are losing the edge over open platforms.” “Avoid vendor lock-in with an open platform and ecosystem, including flexibility of an underlying technology choice.” “I think deploying and then operating anything more than a toy OpenStack cloud is still difficult without paying for an OpenStack distribution, and then it becomes a question of getting into vendor lock-in again.” Project (In)consistency “Technology is good, but no synergies between the sub-projects.” “The governance of the OpenStack project seems very fragmented.” “OpenStack has become a sprawling mess of projects, with quality that is variable/inconsistent.” “OpenStack has gotten too convoluted and bloated with projects.” Increase in Stability “With Kilo and onward, OpenStack components have matured quite a bit in terms of stability.” “As part of our global engineering cloud, we are seeing the increasing stability, speed, and functionality of OpenStack.” “I think that OpenStack is already stable enough to be used at mission-critical applications and has obvious cost advantages.” “OpenStack has reached a level of maturity that guarantees stable clouds in a production data center.” Lack of Stability “OpenStack can address multiple use cases but there are limitations in scale and stability.” “While it’s very powerful and flexible, it’s also got a very high barrier to entry/learning curve, lacks a true upstream long-term support (LTS), and has some lingering issues (stability of messaging at scale, for example) that need to seriously be taken into consideration before committing.” “Stability is difficult to achieve.” “There are still some areas in maturity and stability that need to be improved on.” “I don’t go higher than this [rating] because OpenStack is extremely hard to manage, not very stable and not very scalable.” “I feel difficulties like deployment of OpenStack at a very large level are still not so easy; the product is not very stable, and migration of whole infrastructure with a new release of OpenStack is still bit challenging.” Open Source is Important “You can do a lot of interoperability with systems.” “OpenStack is open source software and has many APIs for comprehensively managing infrastructure.” “OpenStack is the best cloud solution on the market because of its open-ness.” “I think that as a direction, going with an open platform is always the best choice in the long run.” “The open source community is large and this large pool of talent is going to bring innovation more rapidly than any single organization.”