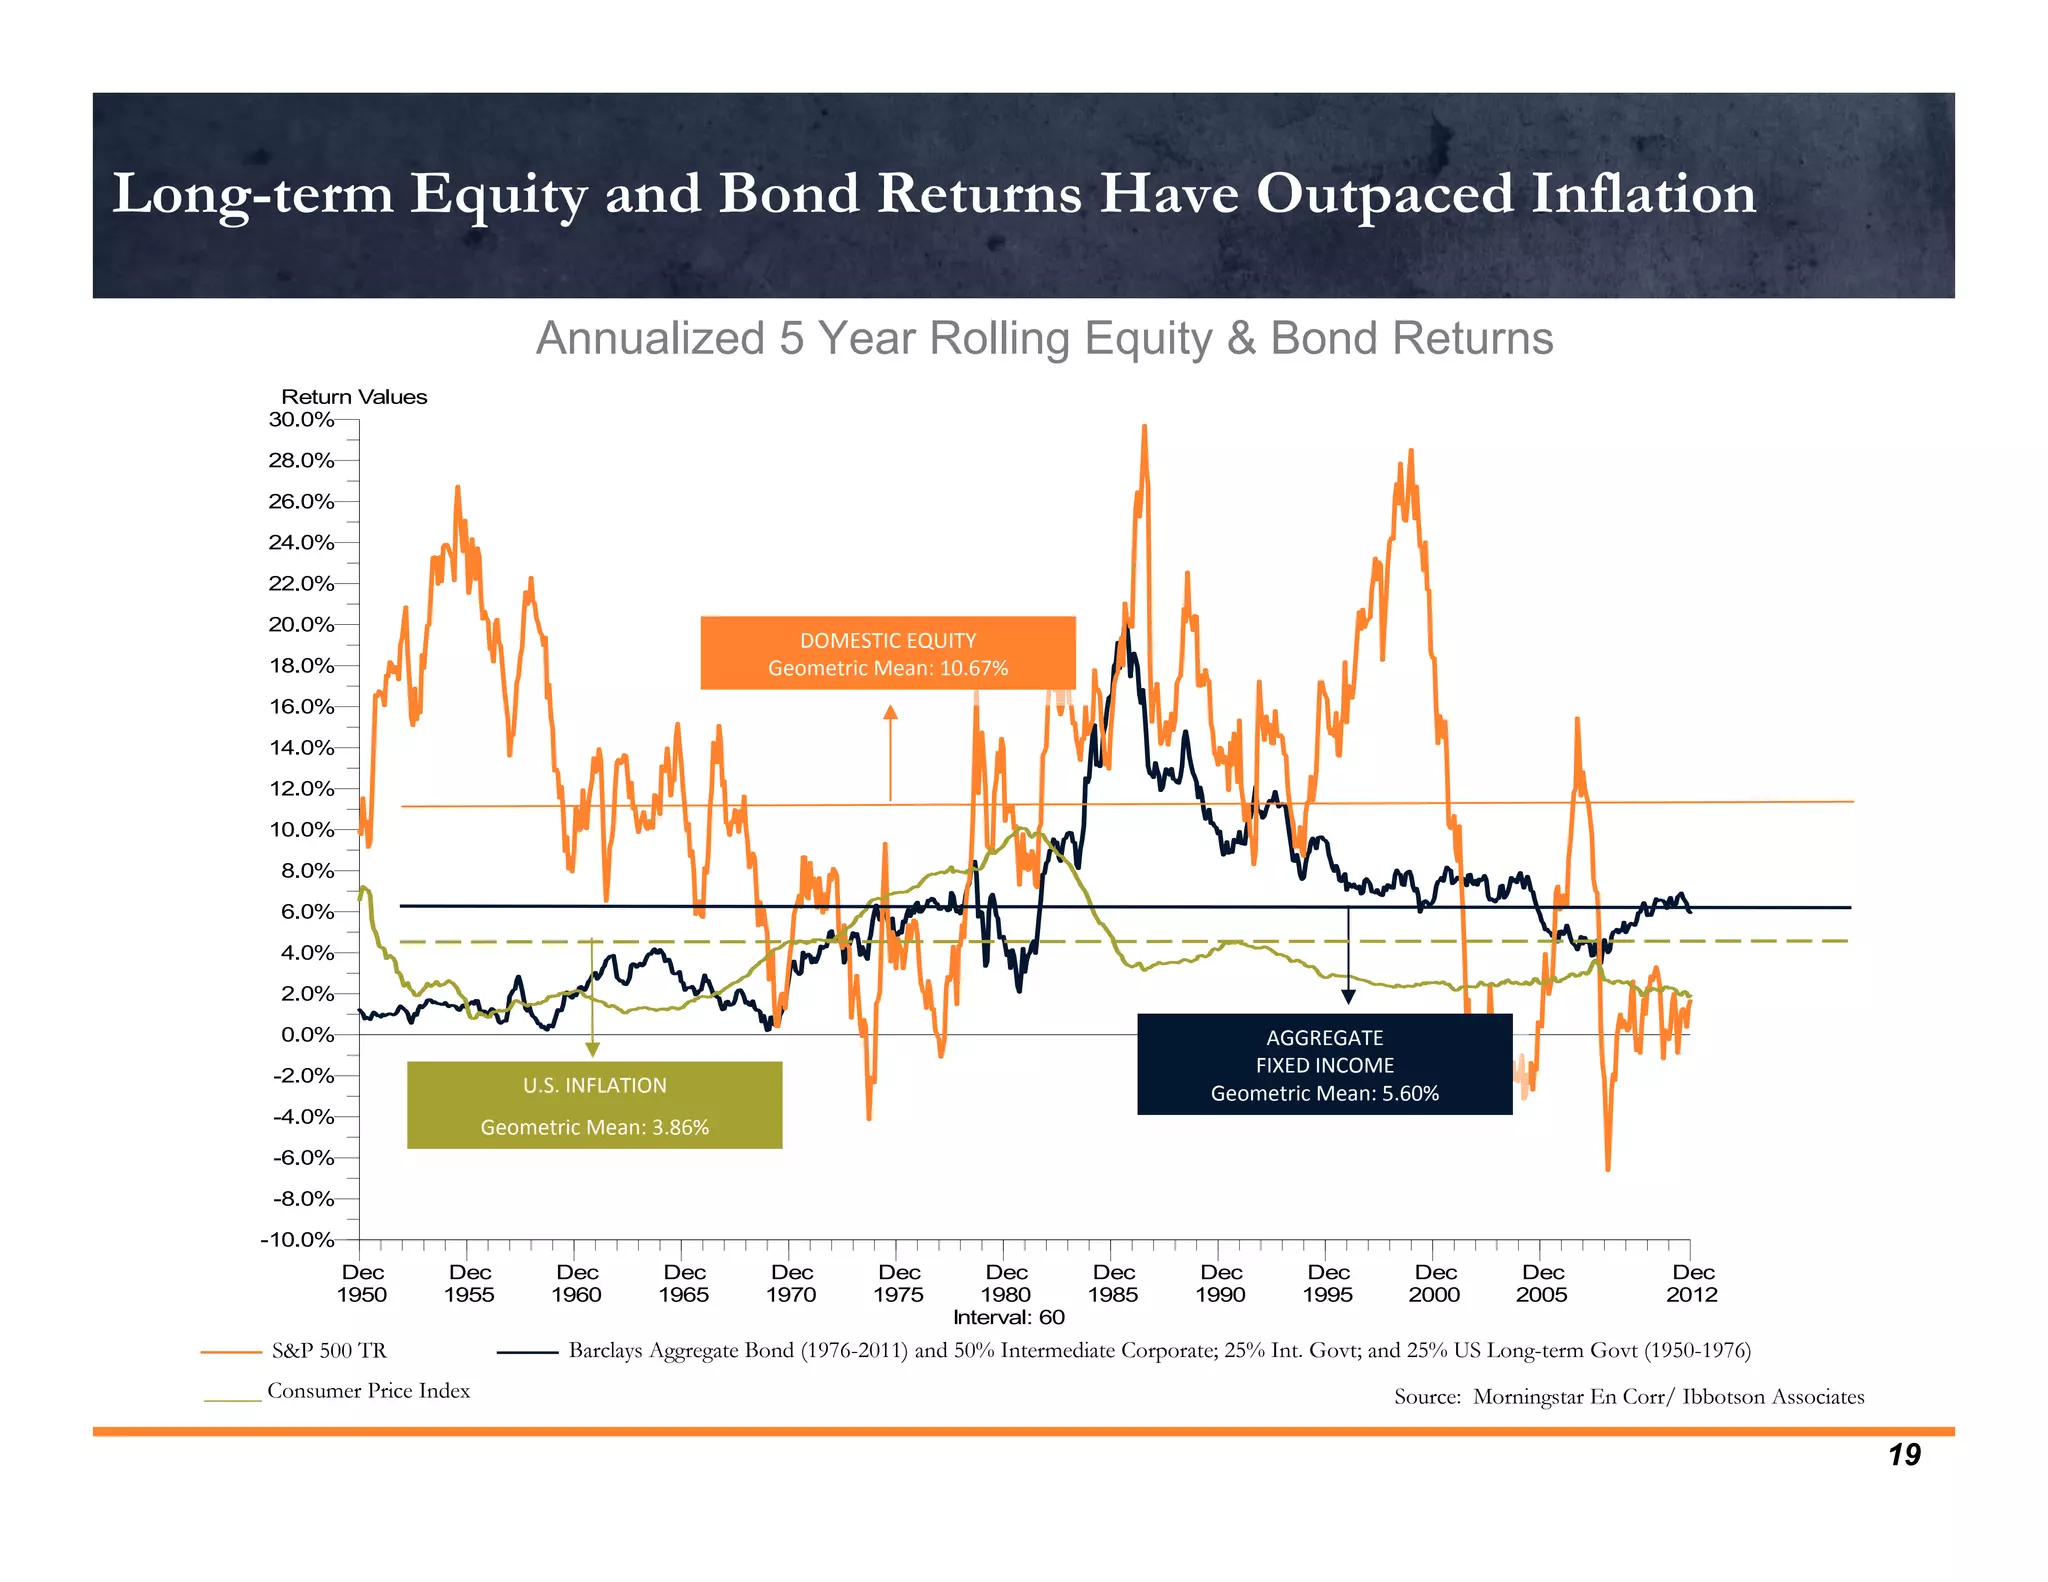
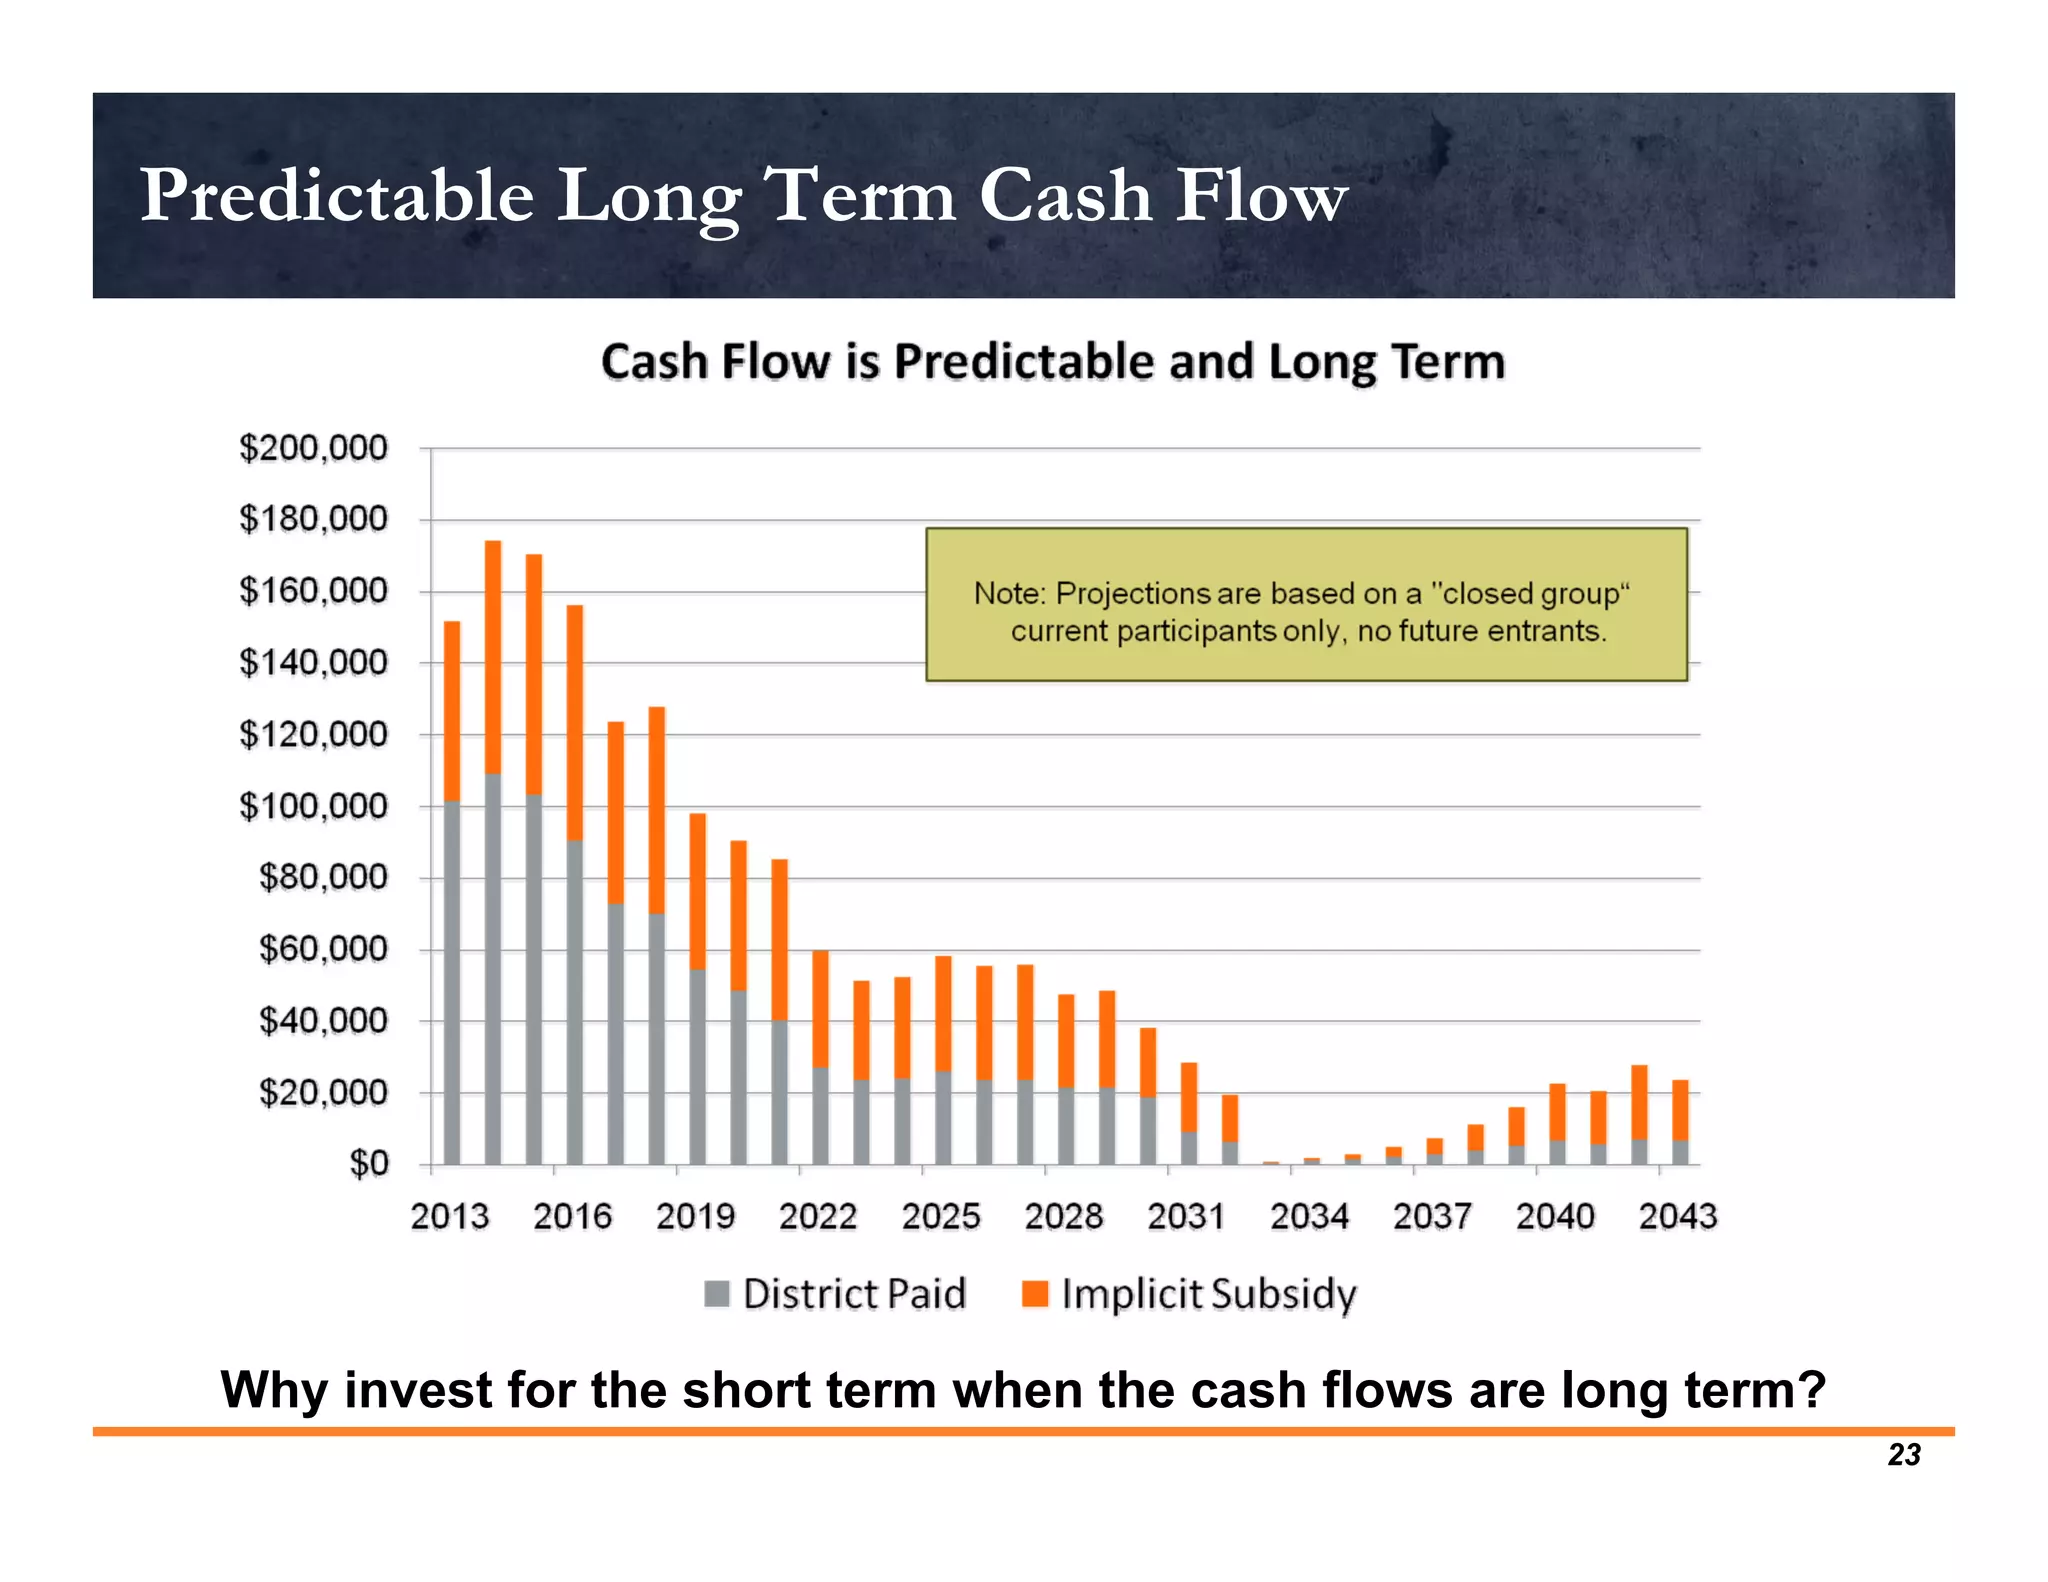
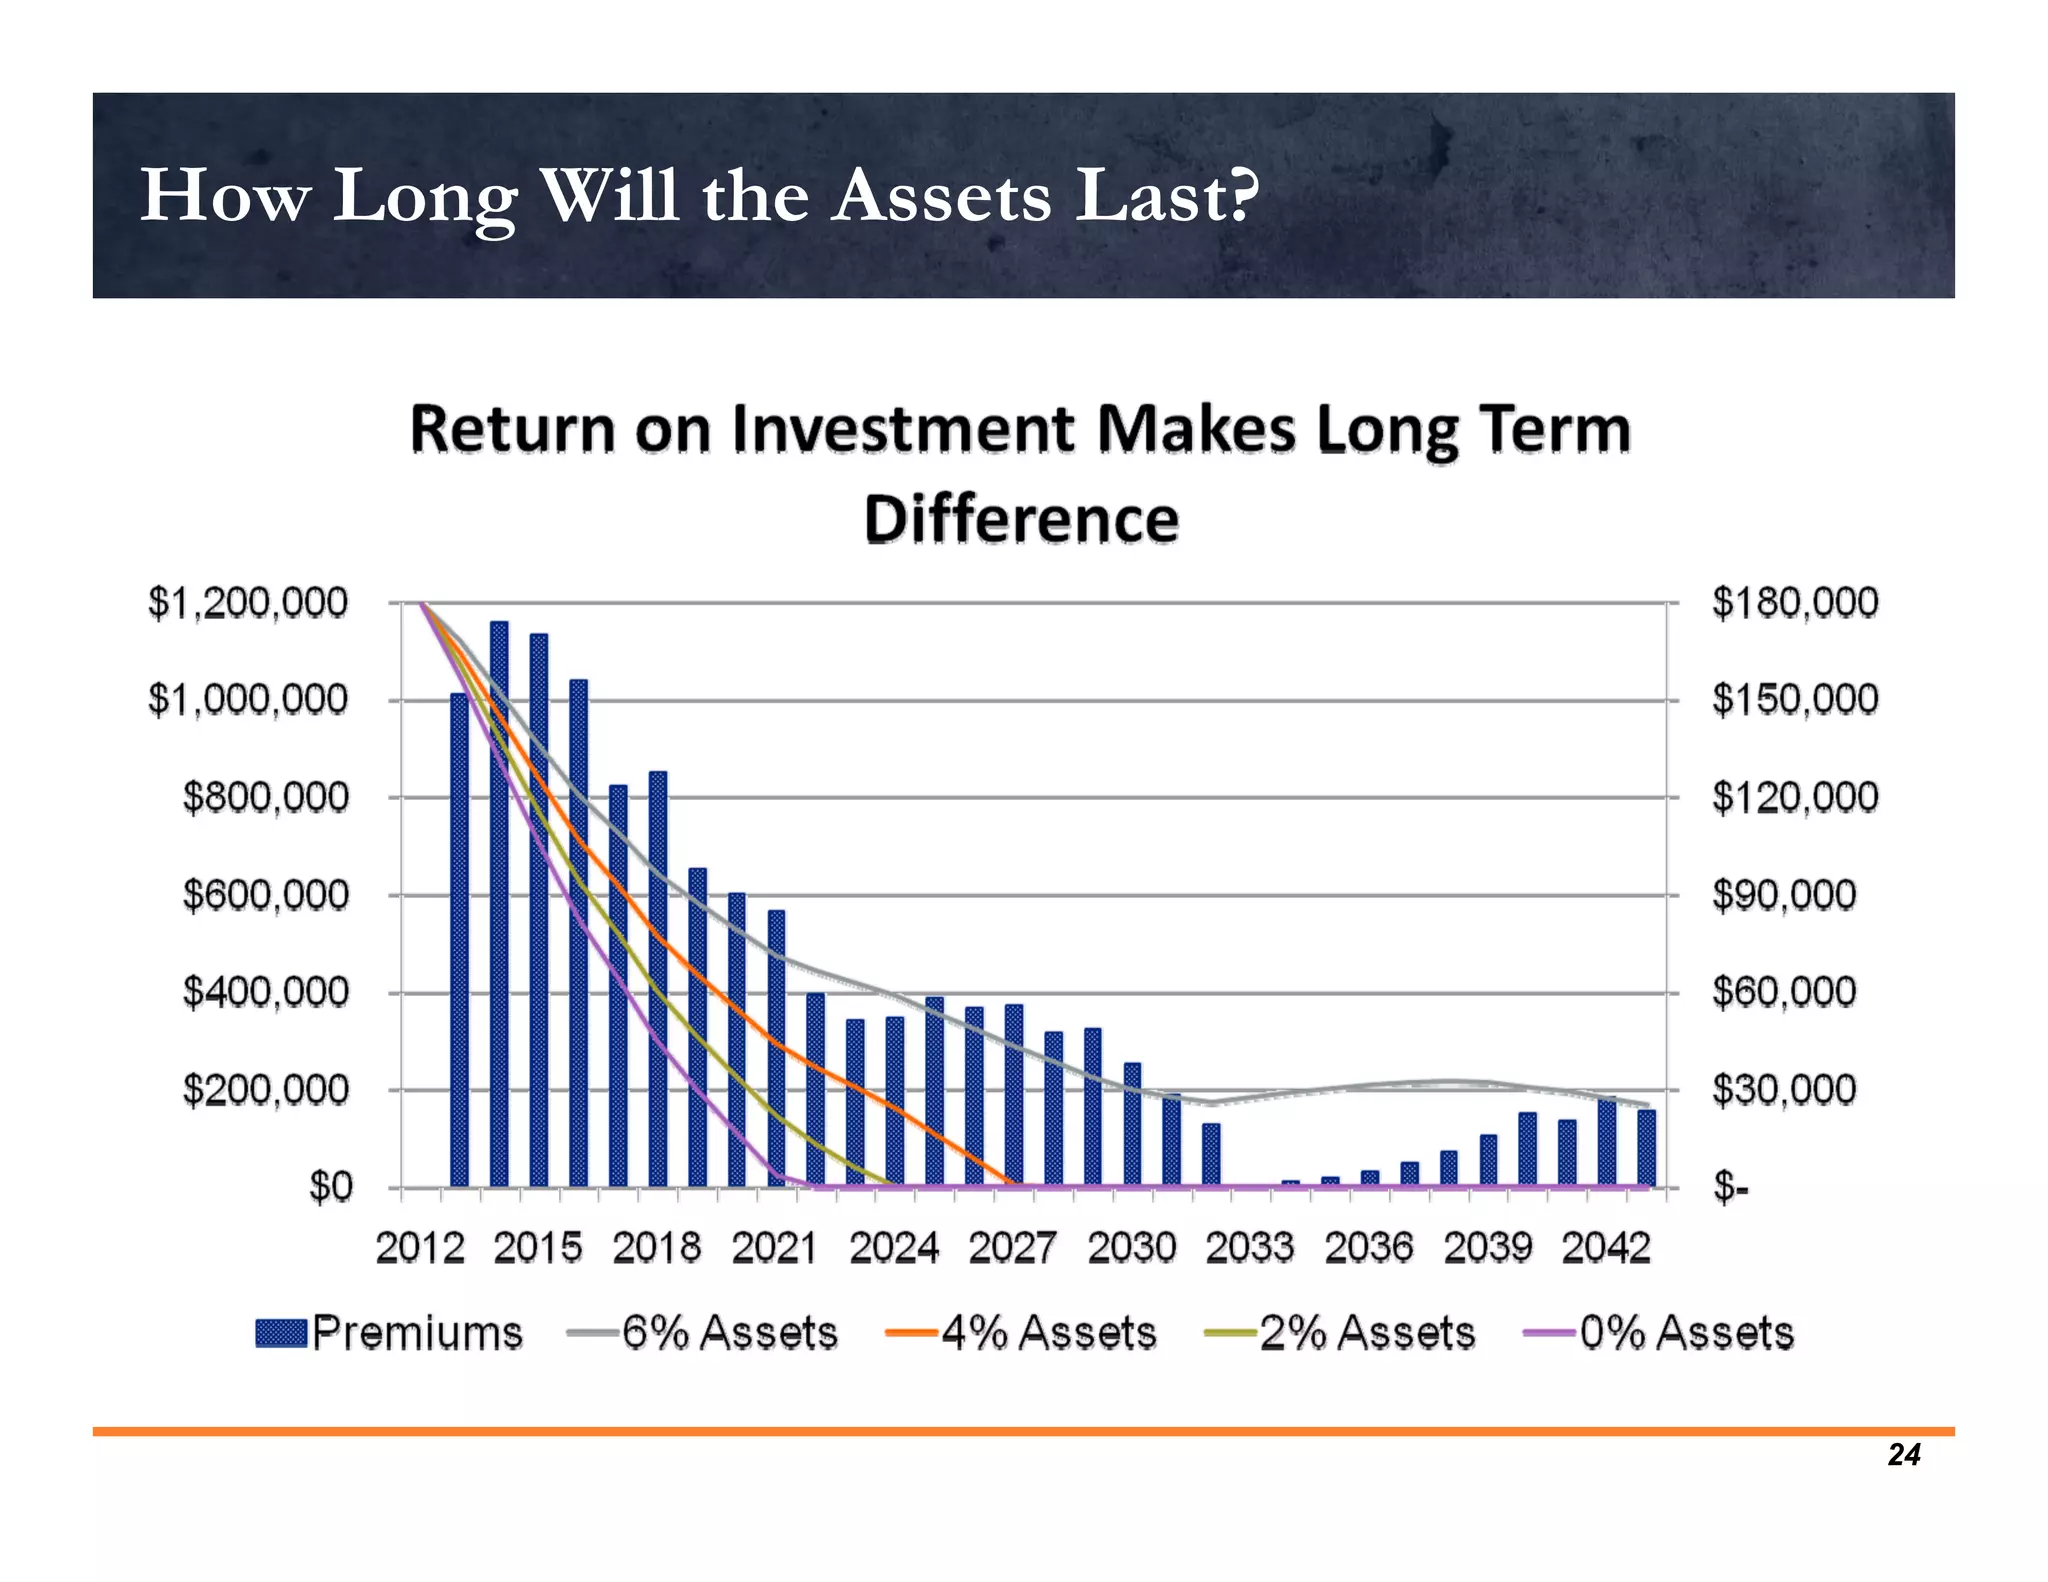
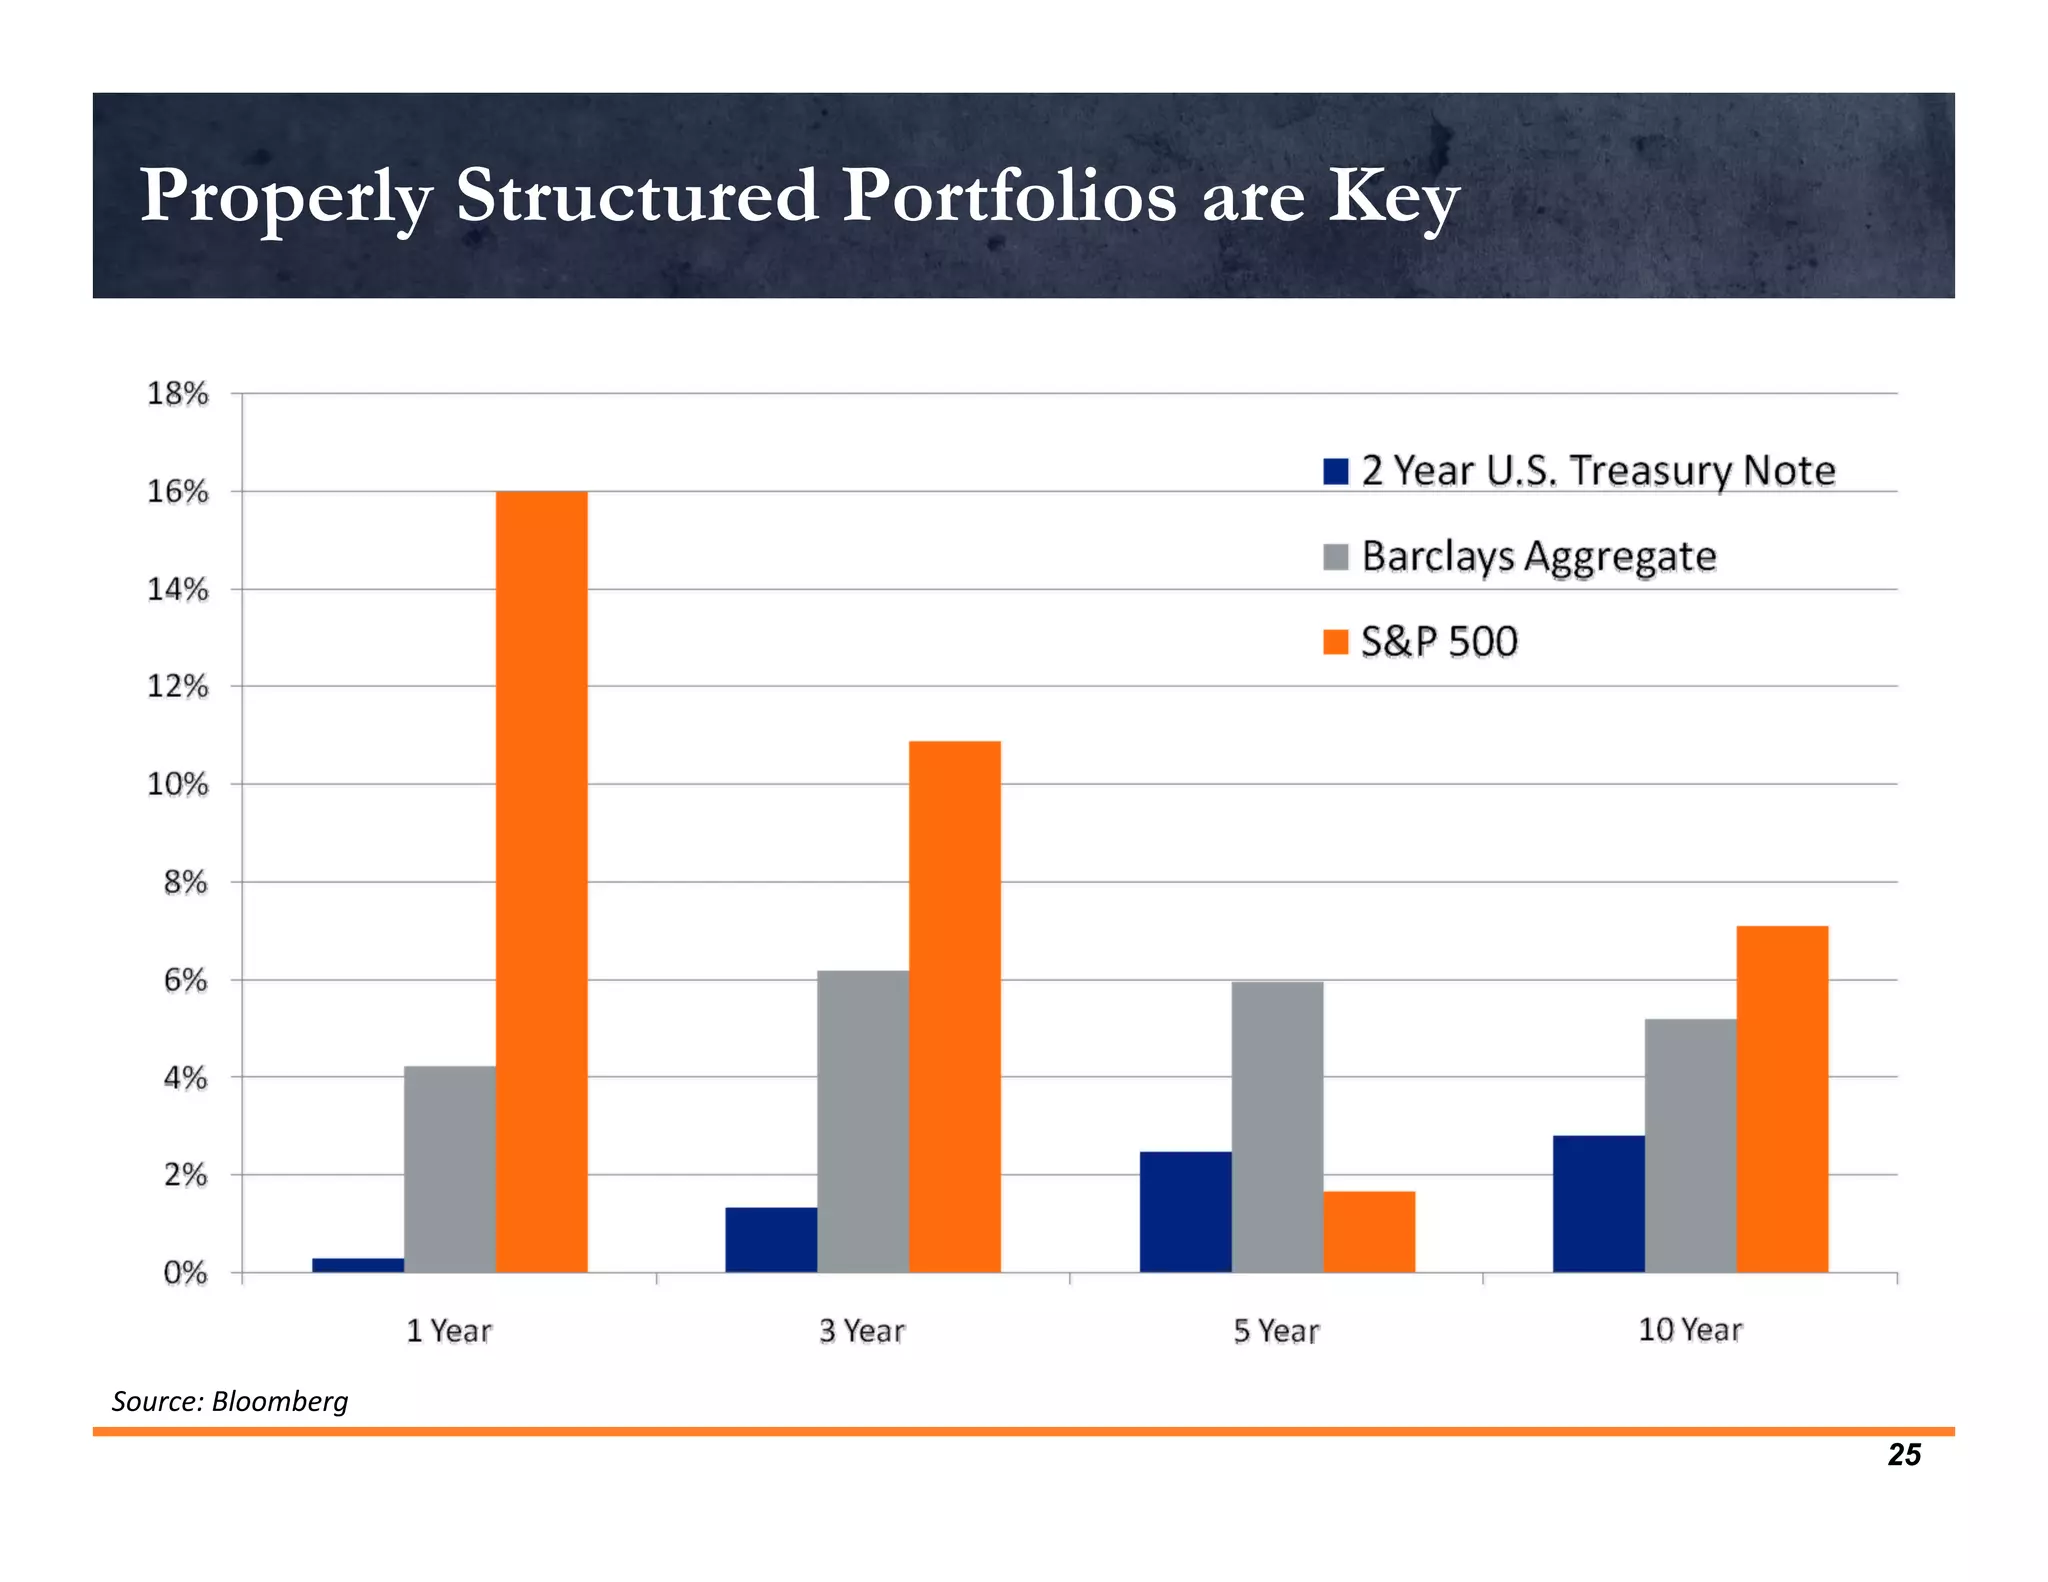
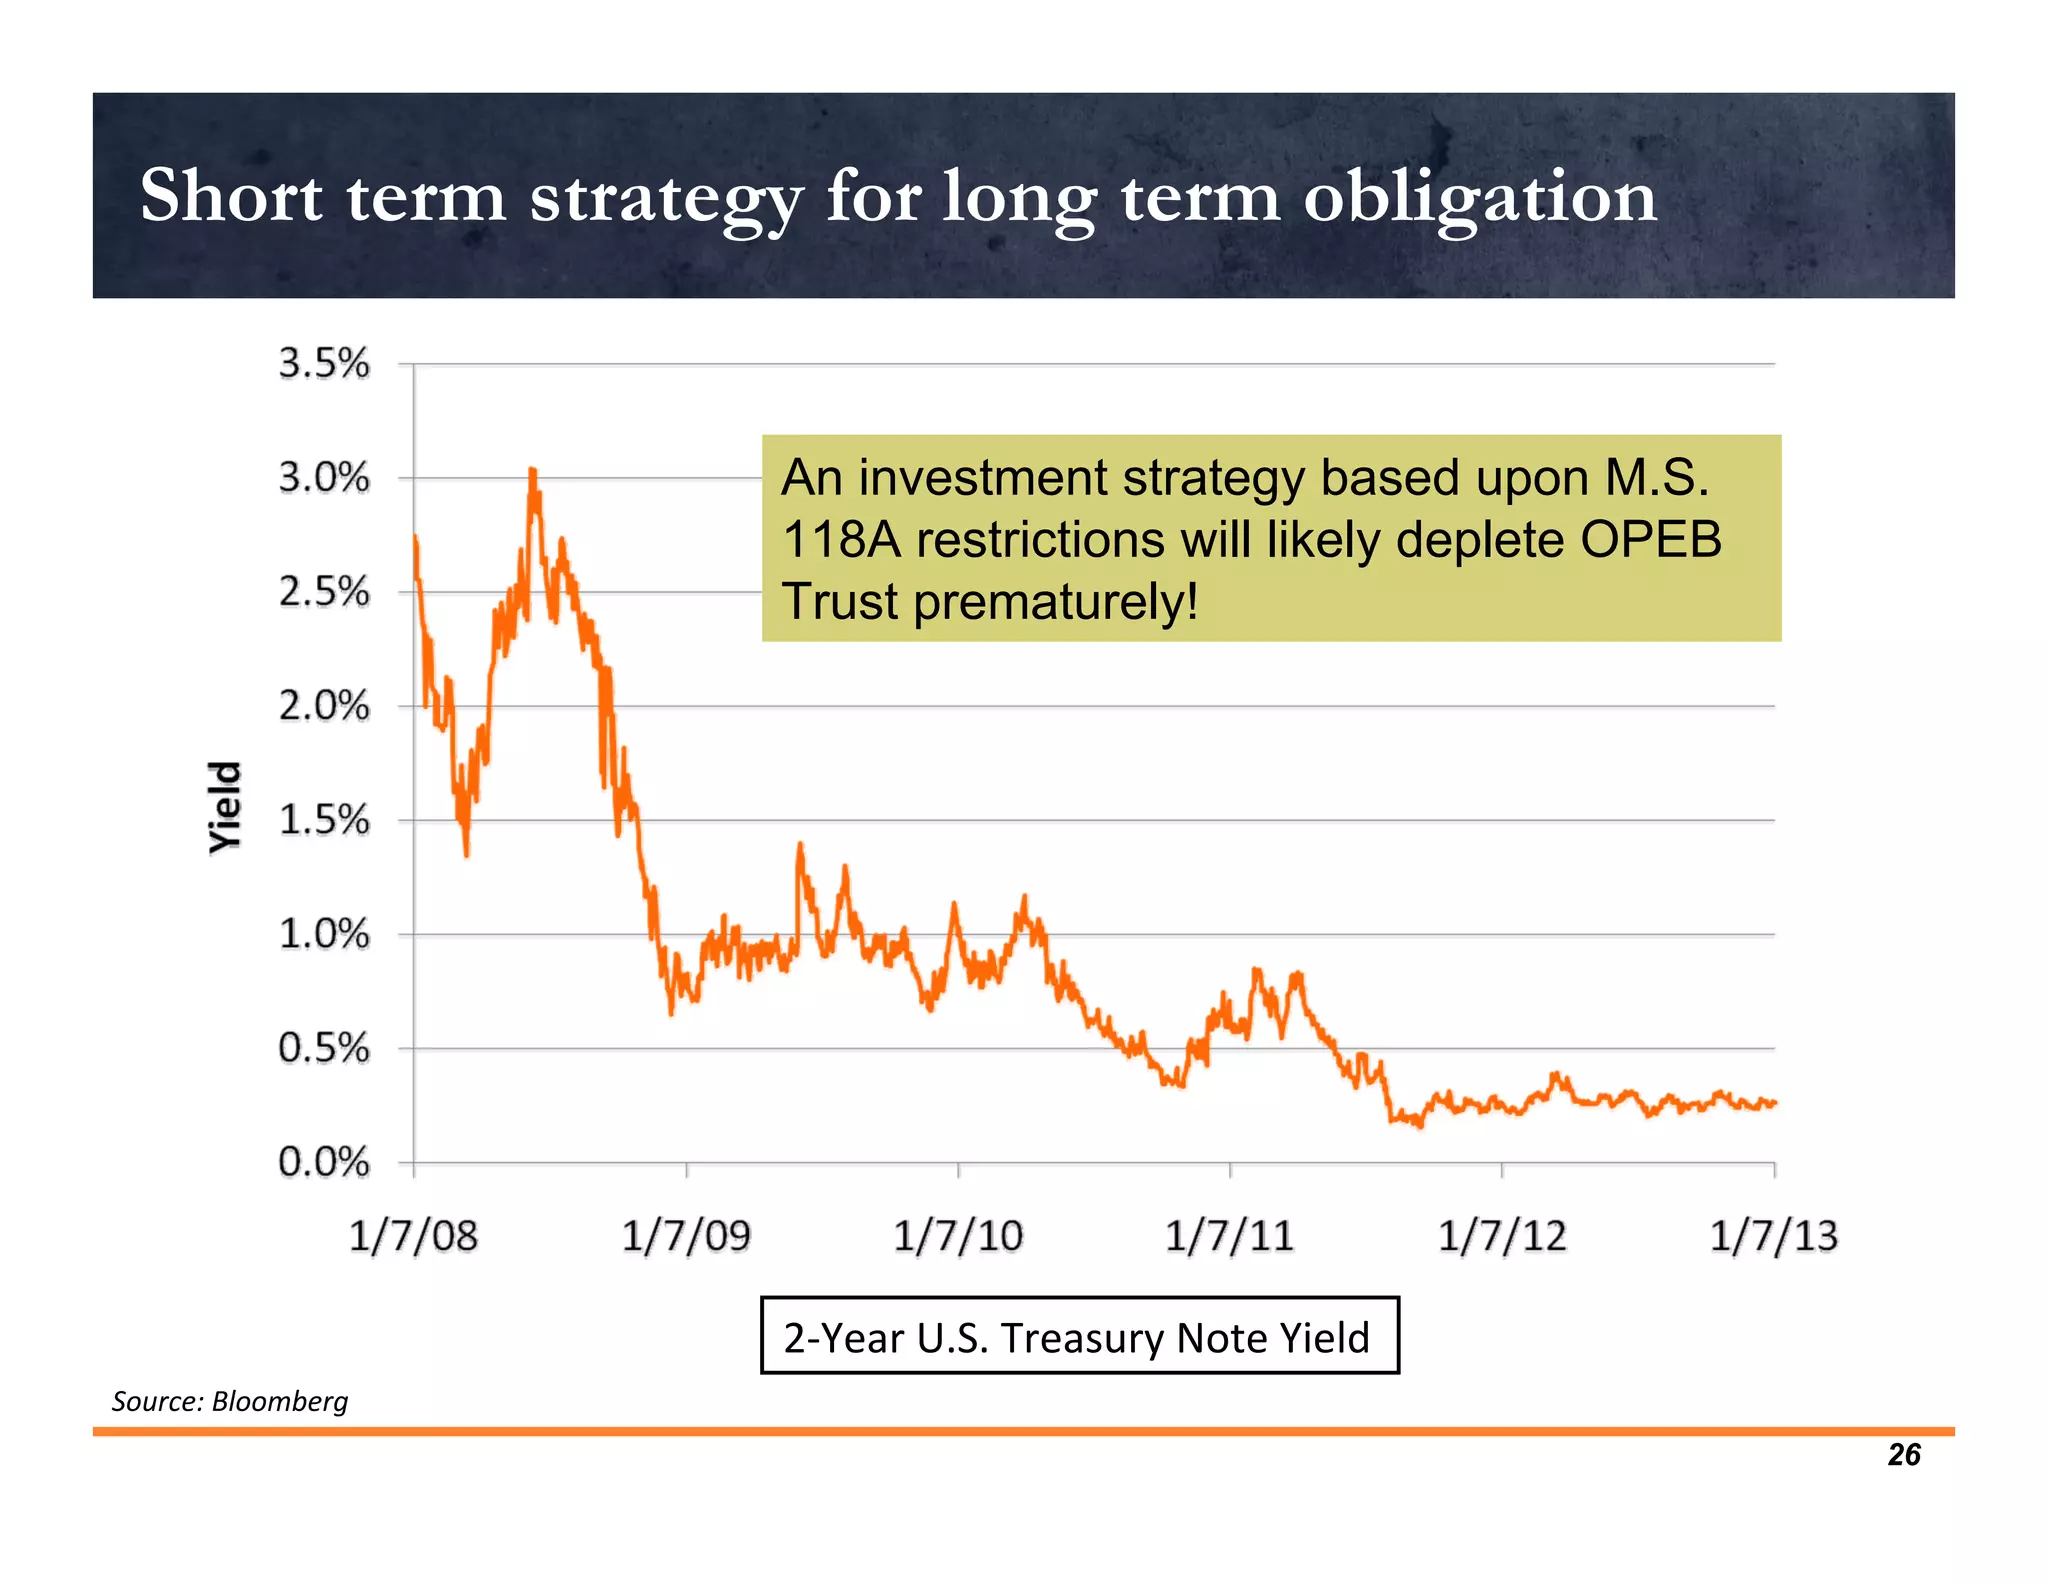
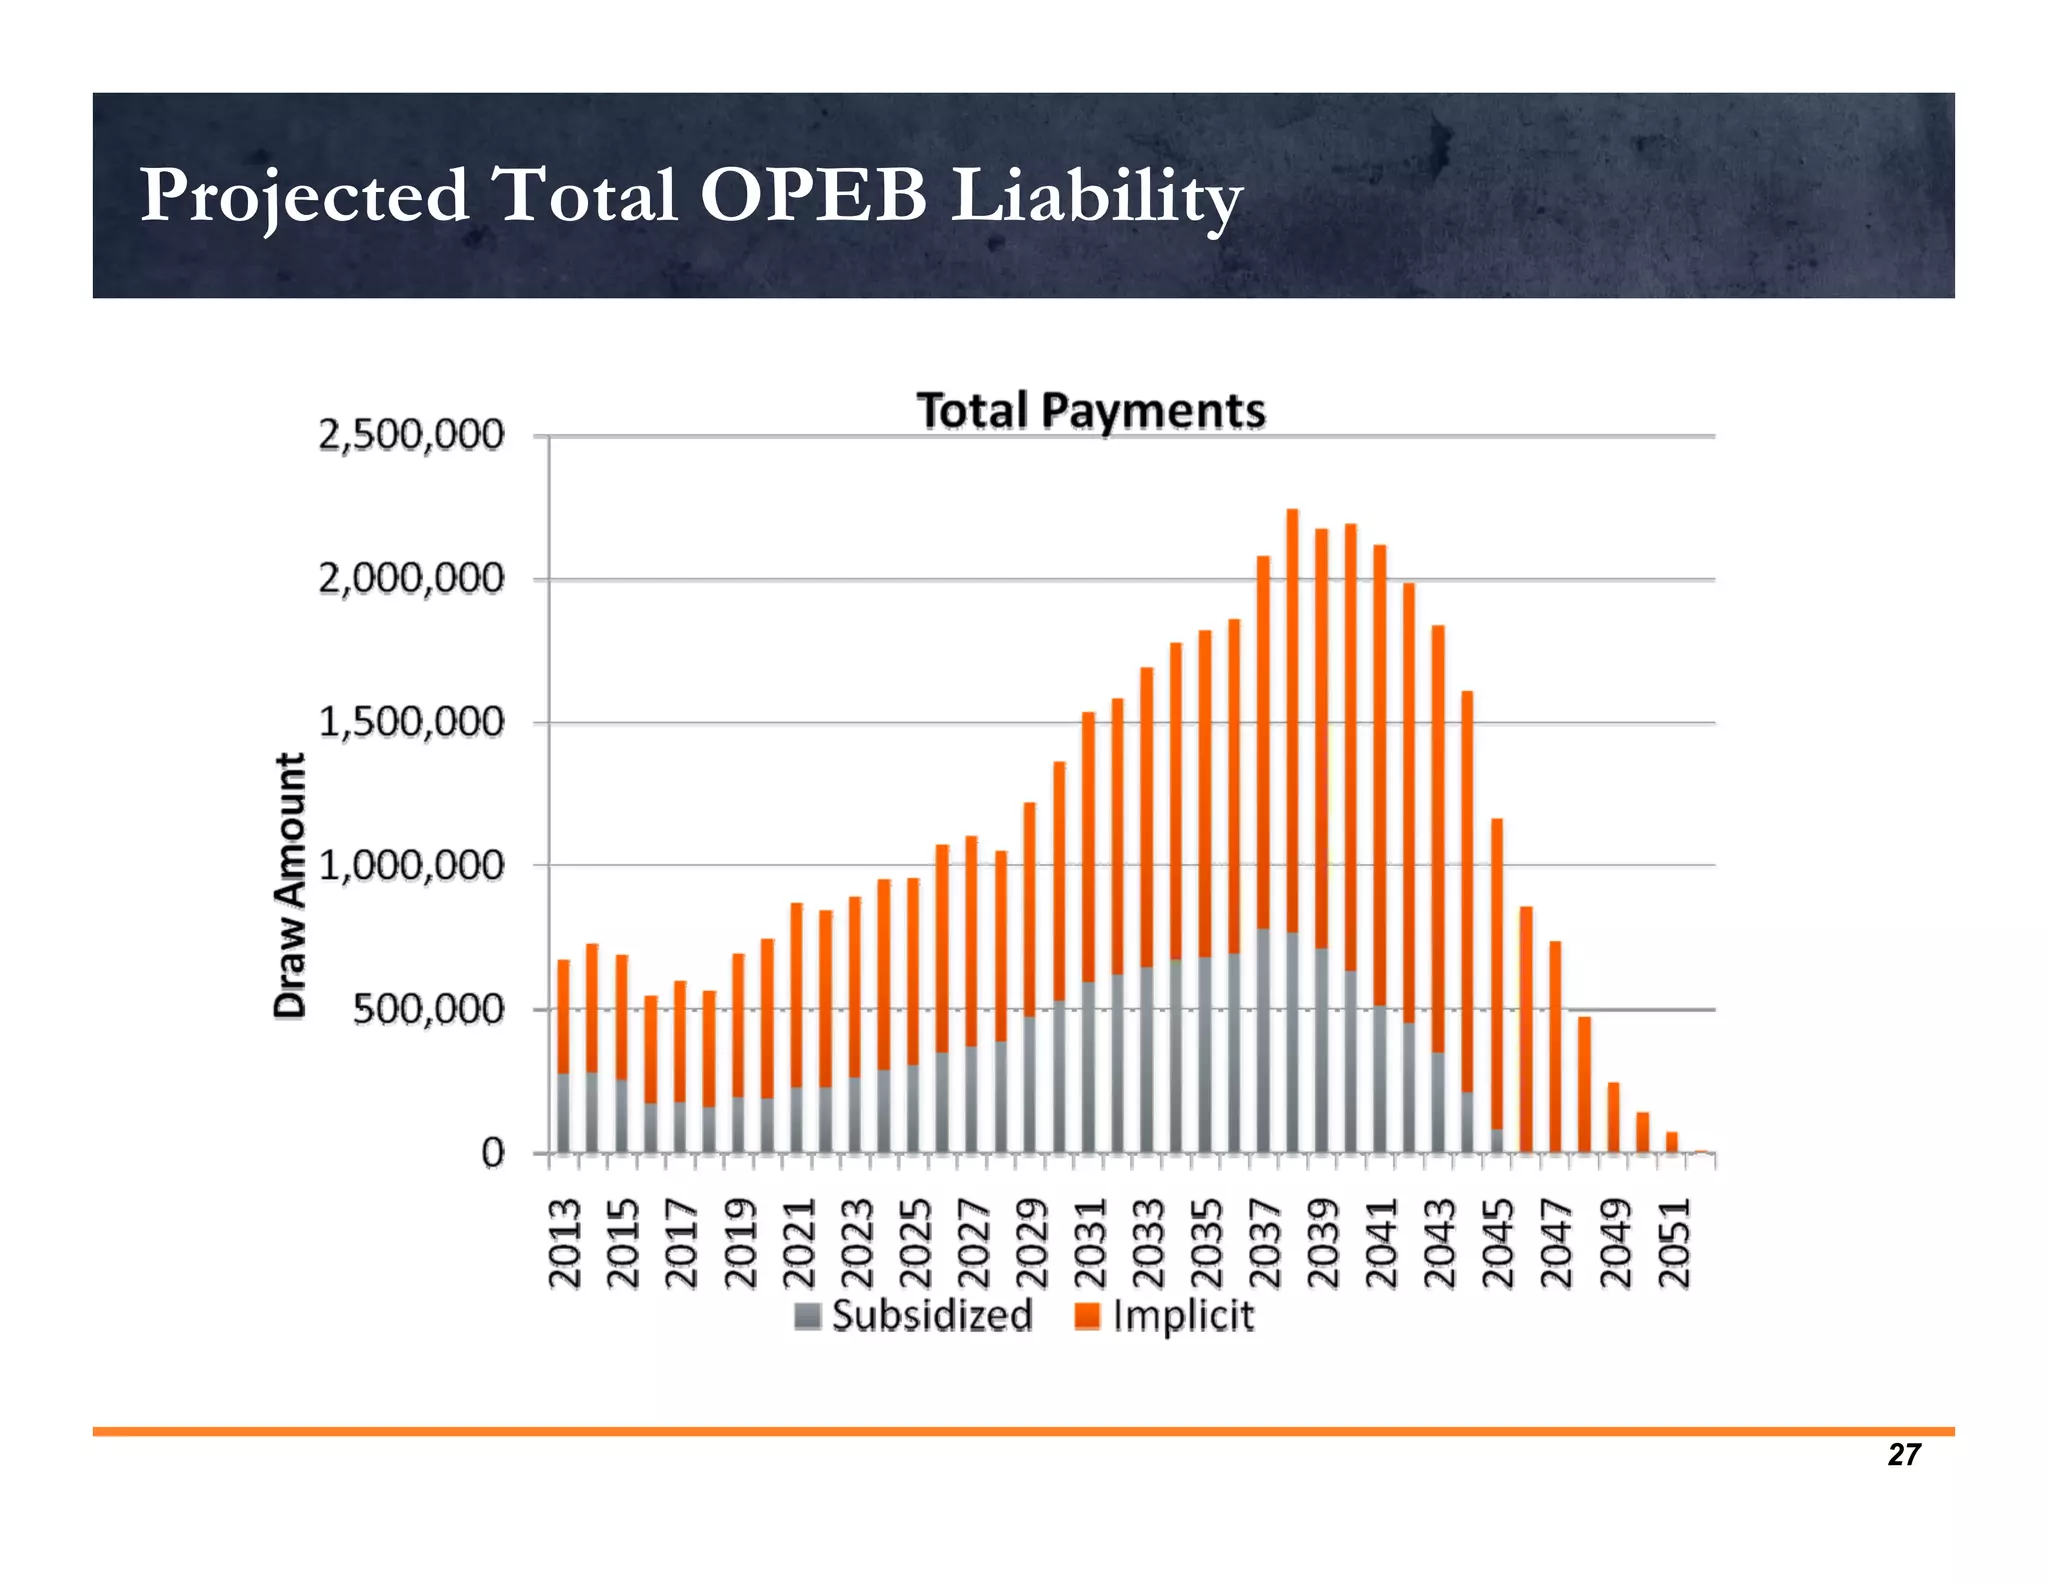
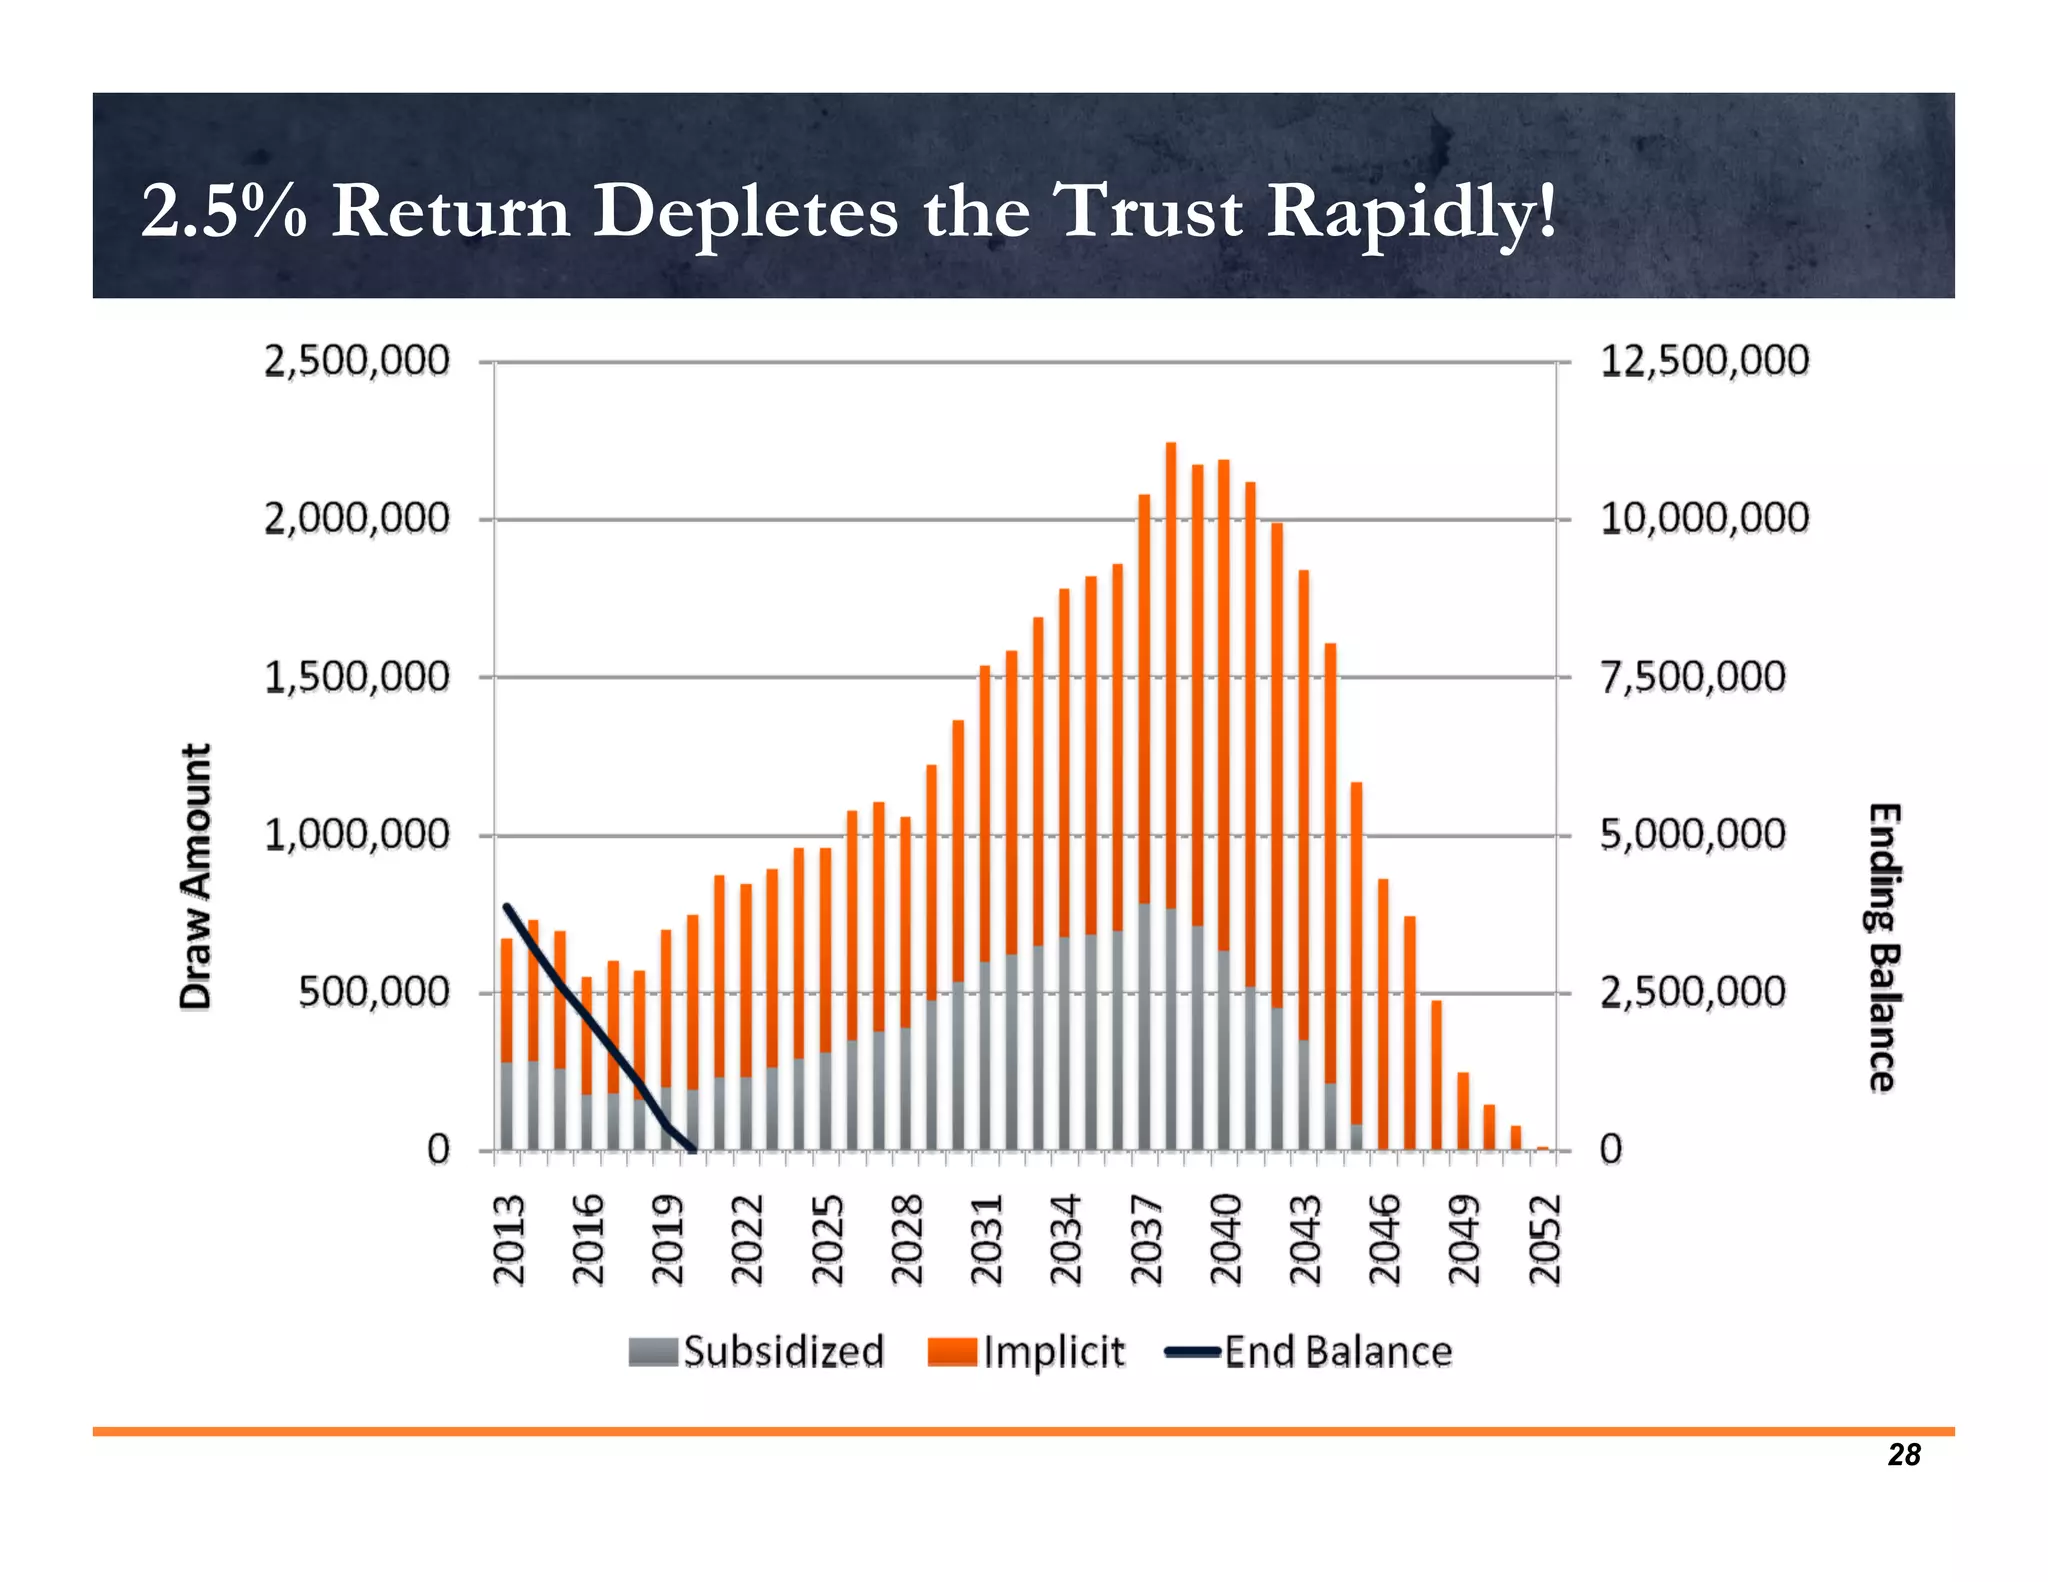
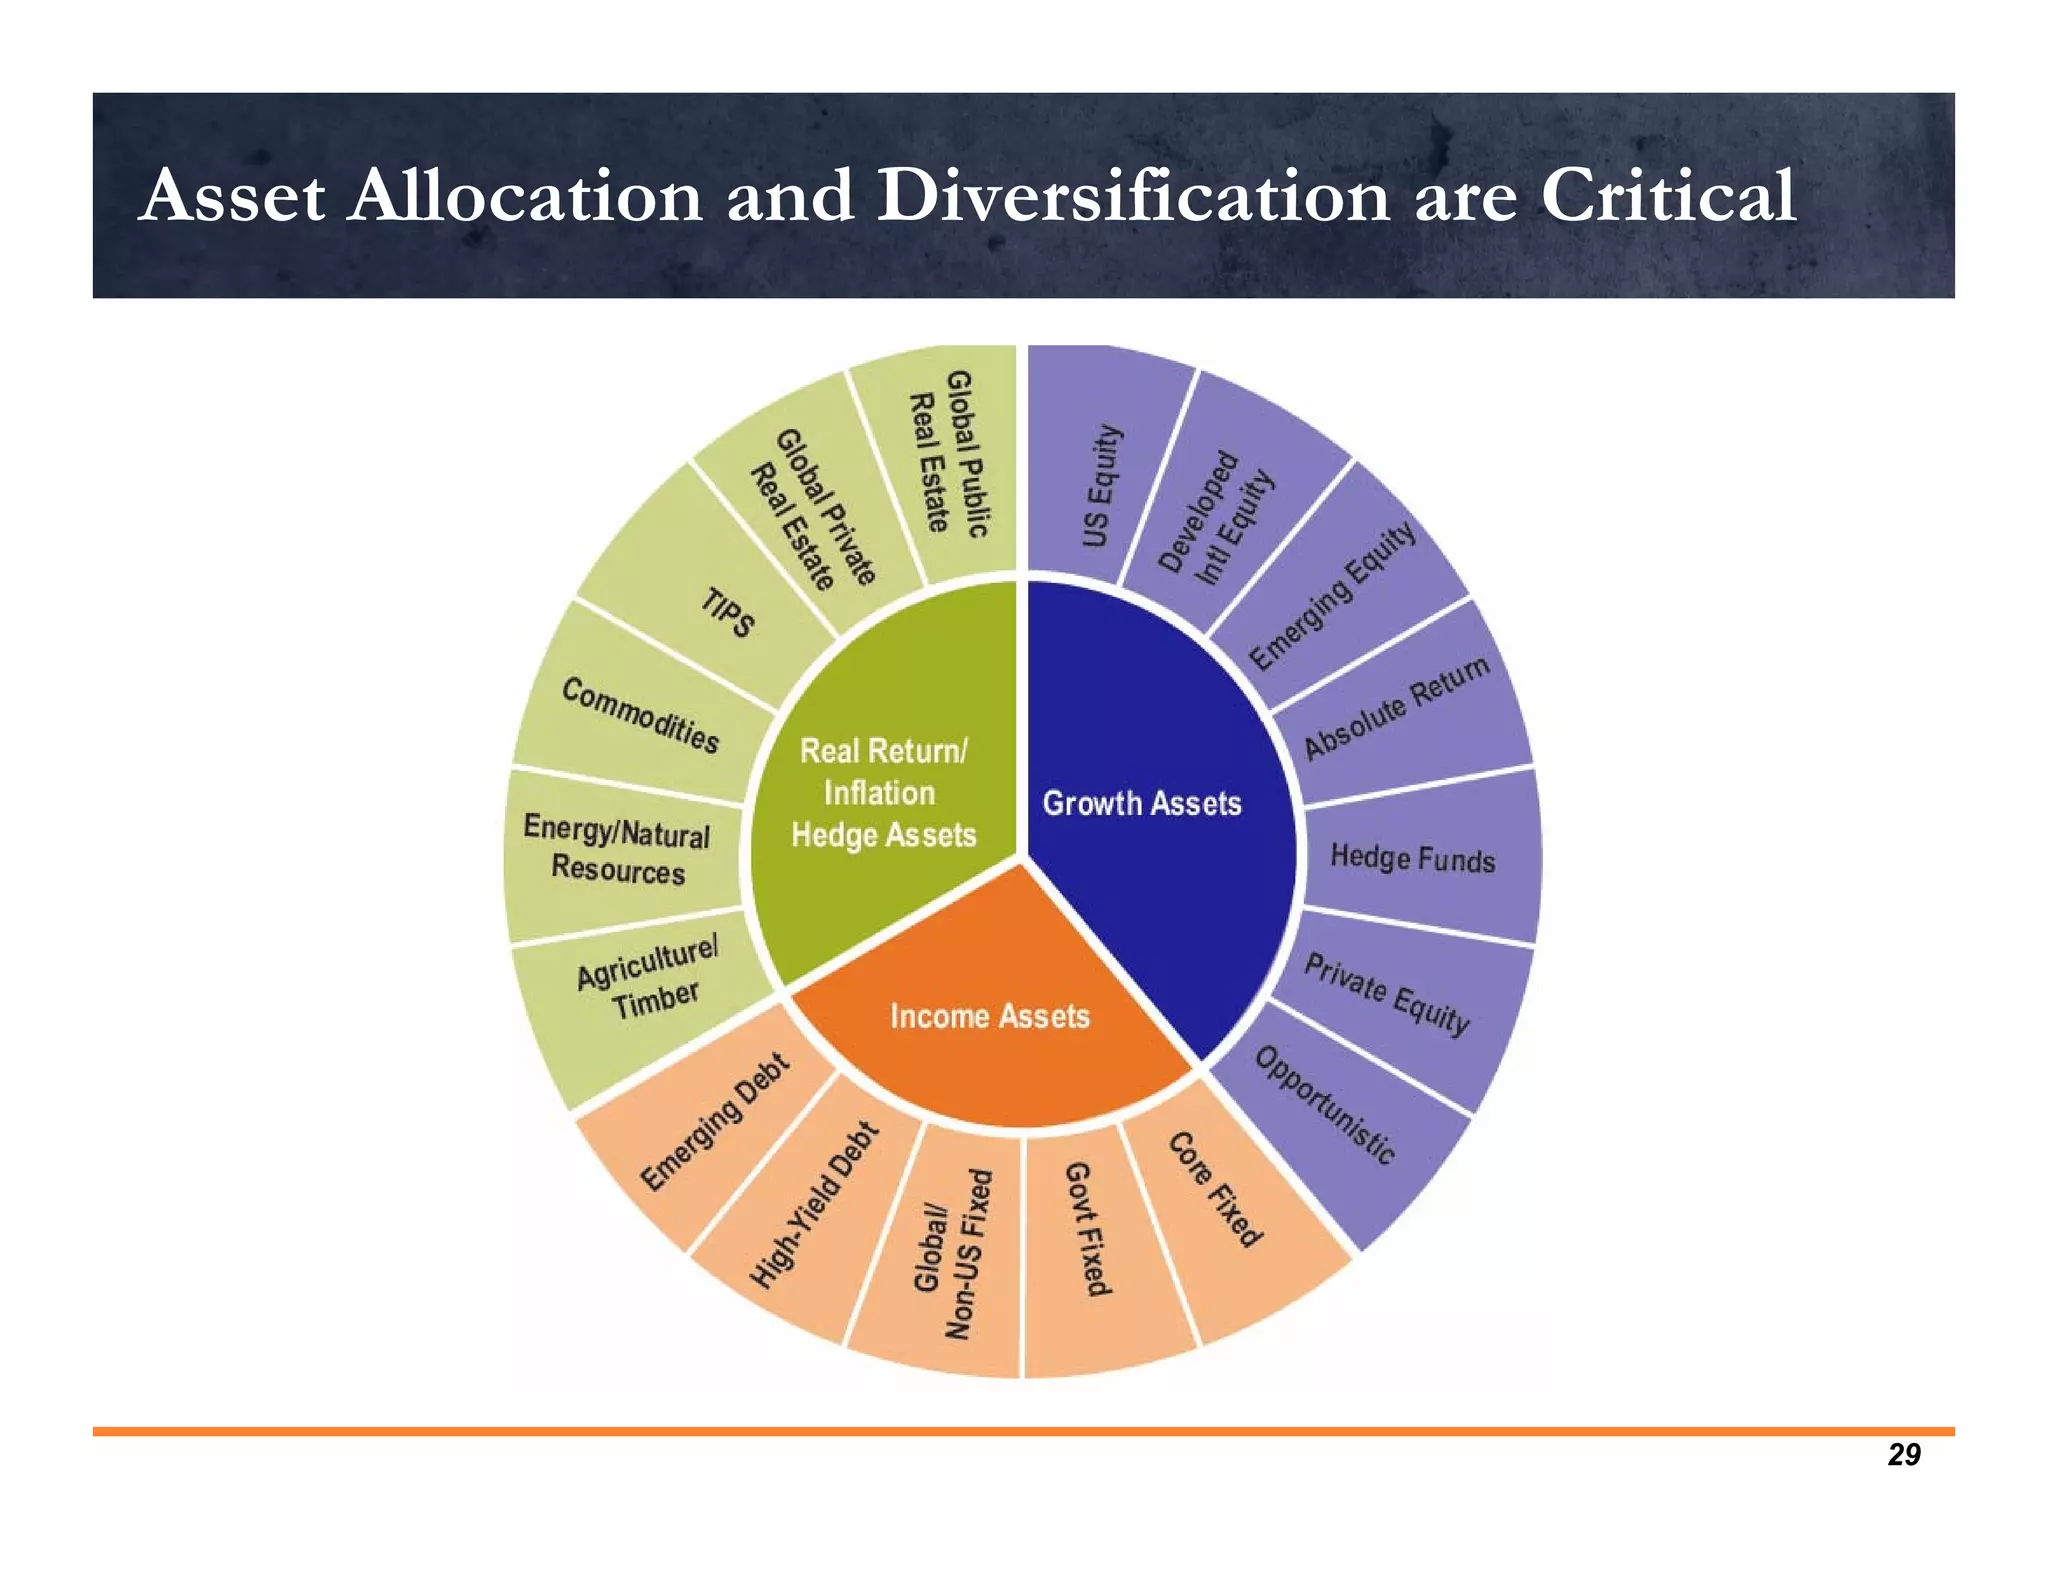
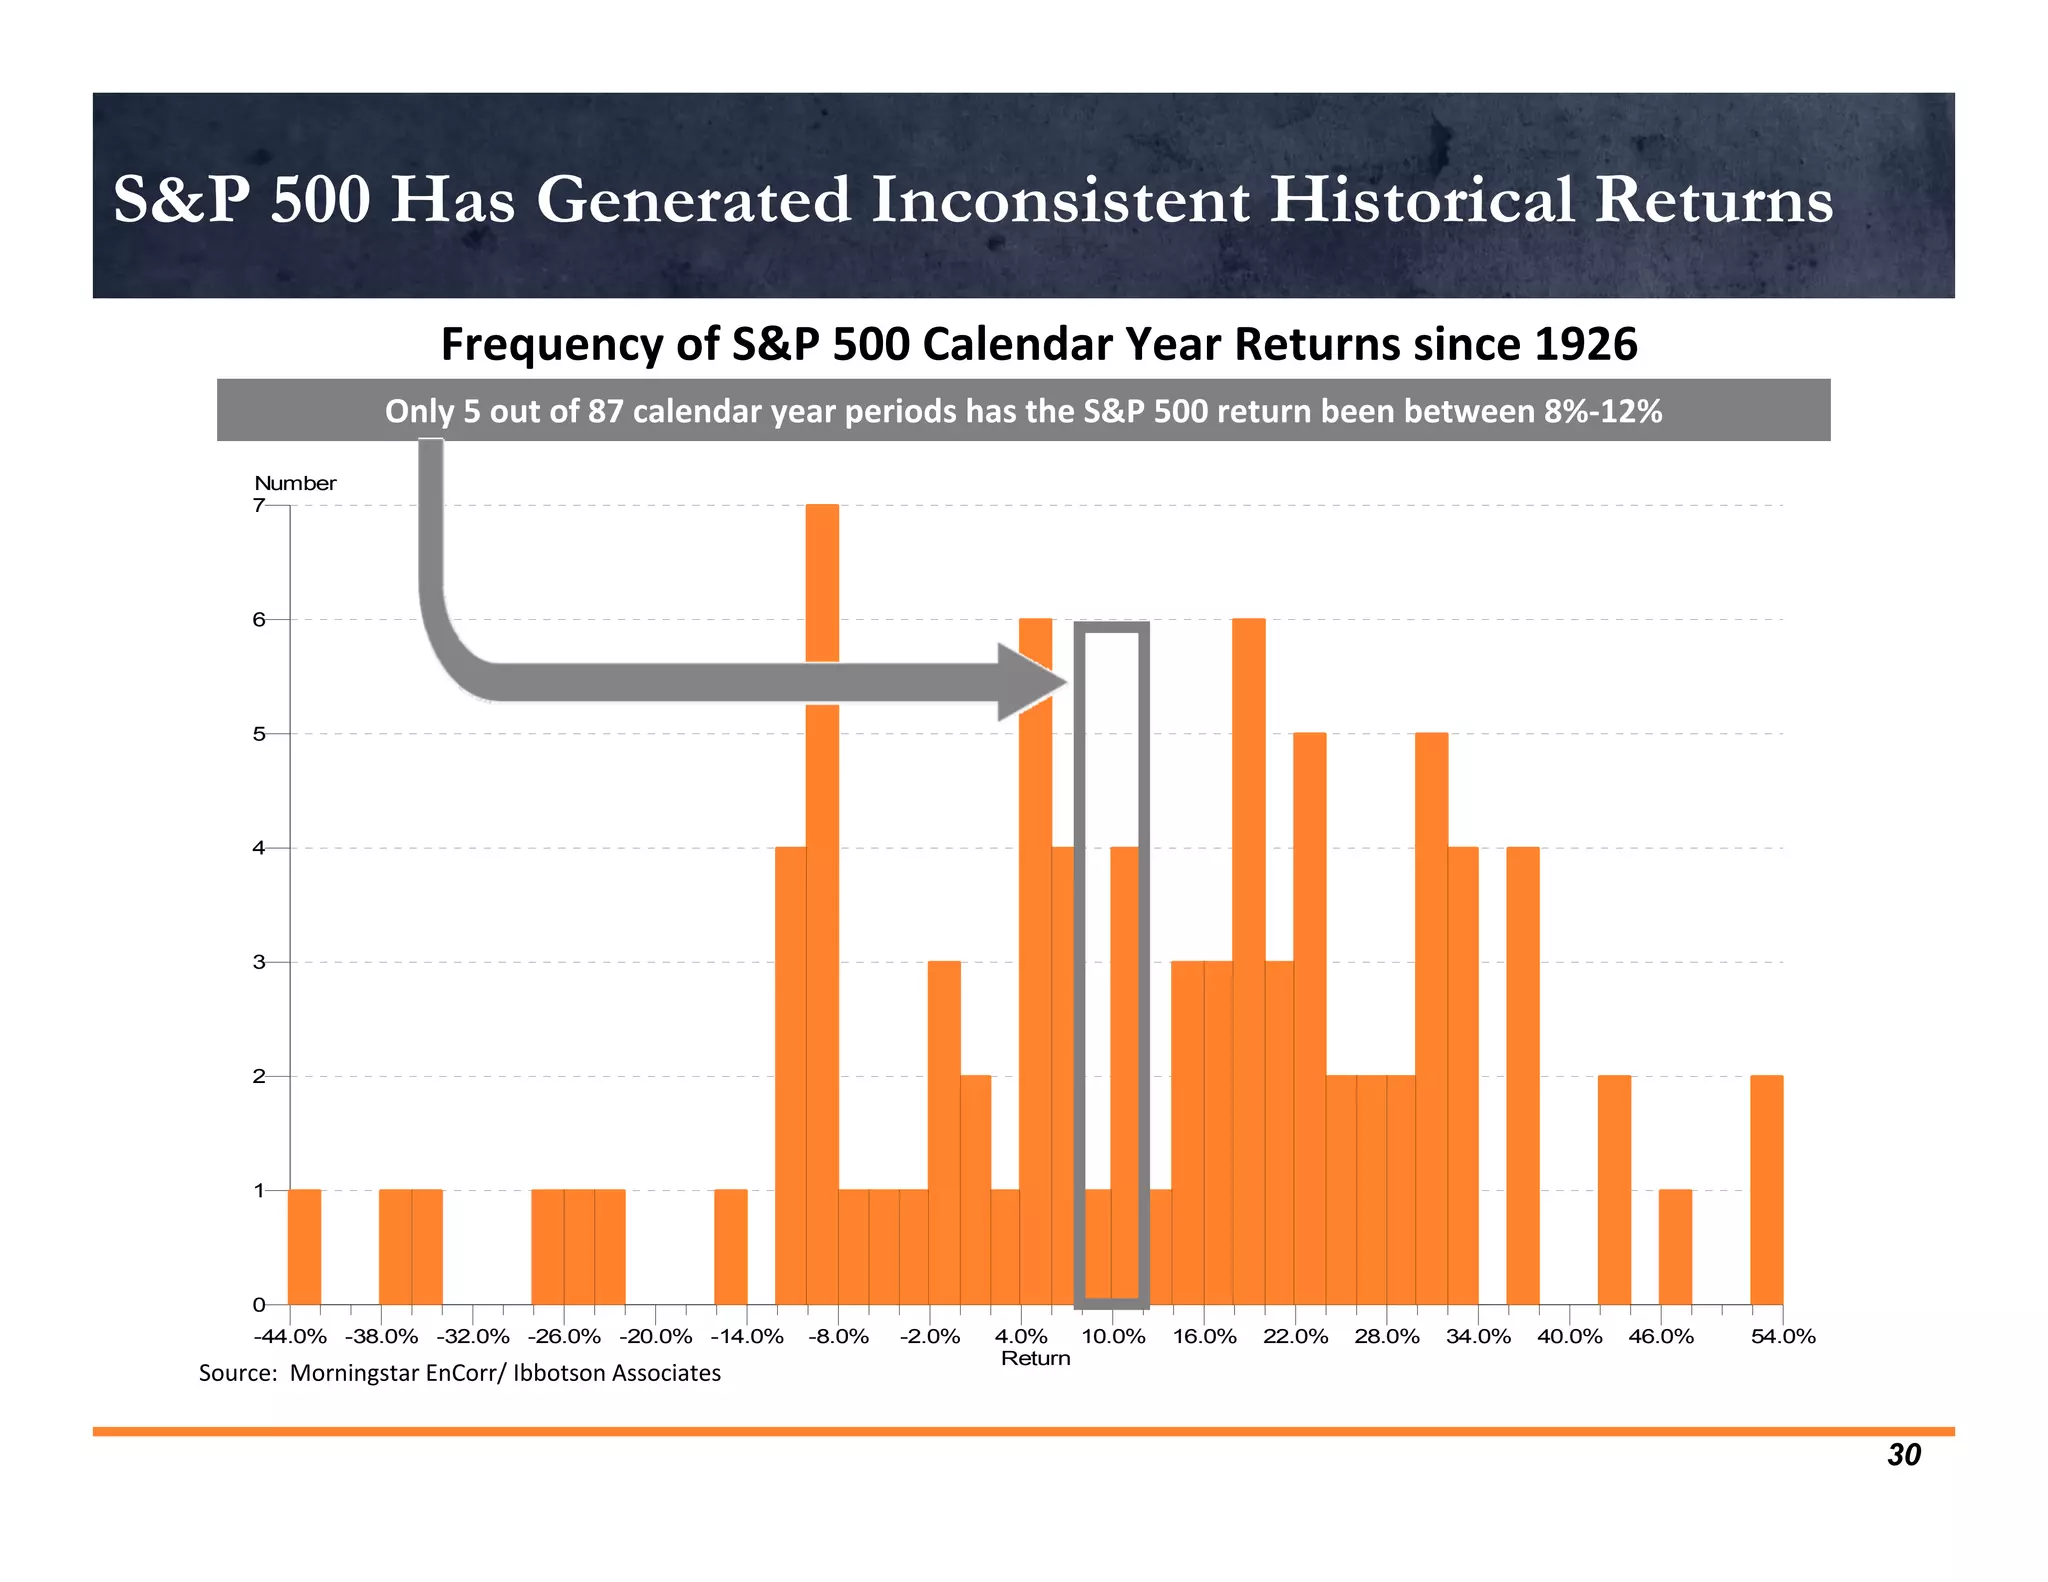
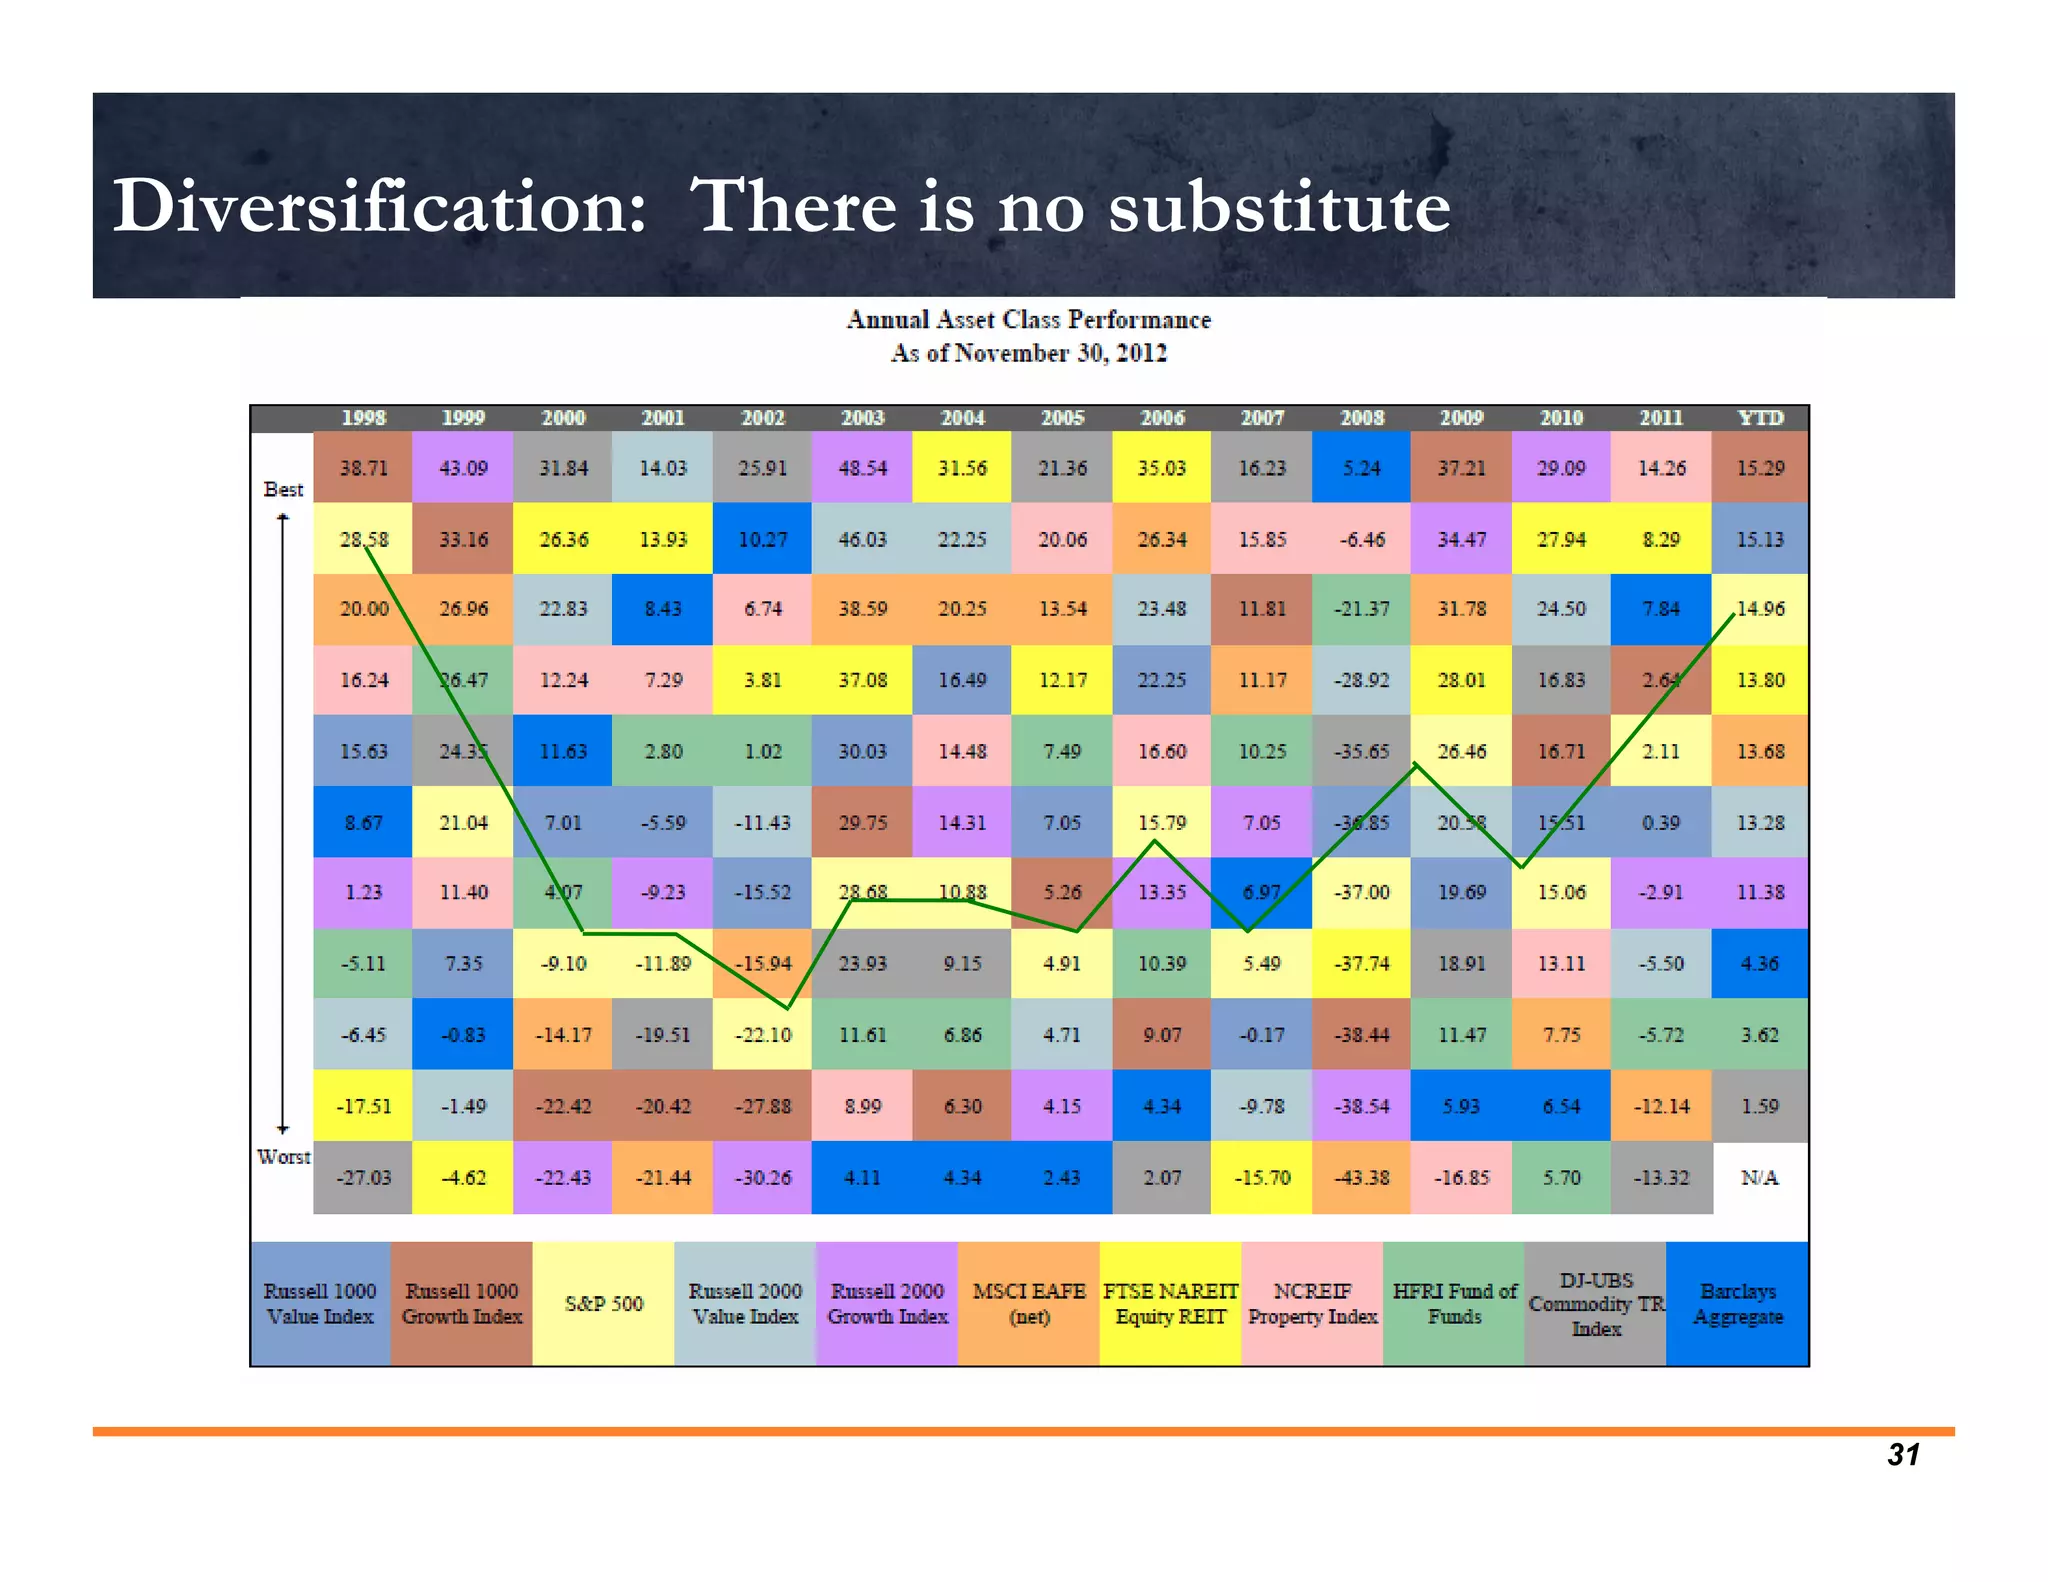
OPEB Investments:
            The DANGER in Playing it Safe
                                           January 17, 2013


                Tony Jacobs      Mark D. Meyer, JD, FSA                       Mary Fedorak              Donn Hanson
Treasurer, LCWM School Board     Van Iwaarden Associates     MACM Regional Product Specialist                 Director
             607 Knights Lane      840 Lumber Exchange                     222 North LaSalle          800 Nicollet Mall
       Lake Crystal, MN 56055        10 South Fifth Street                         Suite 910                Suite 2710
               (507)726-2323      Minneapolis, MN 55402                    Chicago, IL 60601    Minneapolis, MN 55402
                                          (888) 596-5960                     (312) 523-2438            (612) 371-3720
                                markm@vaniwaarden.com                   fedorakm@pfm.com           hansond@pfm.com
                                   www.vaniwaarden.com                         www.pfm.com              www.pfm.com
Presentation Overview

• OPEB Basics

• Actuarial Implications

• Investment Implications

• Board Implications

• Questions and Answers


                            2
GASB Accounting for OPEB


              Other
     Post-Employment
             Benefits

                           3
Background of GASB Statements


     OPEB in the Media
        “School districts struggle to pay retirees' health benefits”


        “The next retirement time bomb”
        “Officials continue to grapple with liability issue”


        “District is stretching out OPEB burden”


                                                                       4
What is an OPEB?

• Form of deferred compensation
• Promise to provide retiree benefits must now be accrued
  during the working years of employees
• Post-retirement benefit other than pension
   – Including:
      • Retiree medical, life, vision, dental
      • Implicit retiree medical subsidy
   – Not Including:
      • Early retirement incentives, severance based on unused sick pay,
        vacation and compensated absences


                                                                           5
Implicit Rate Subsidies for Retirees

• In health insurance plans where a government’s retirees
  and current employees are insured together as a group
• The premiums paid by the retirees are lower than they
  would have been if the retirees were insured separately


                                                            6
The Actuarial Model for OPEB Liability


         Data          Assumptions                      Methods         Plan Provisions


                                 Actuarial Model


                              (Present Value of Benefits)


 Liabilities                Accounting Results
 • Accrued liability        • Balance sheet liability             Projected Payments
 • Normal cost              • Accounting expense


                                                                                          7
Important Actuarial Assumptions


                    Factors that affect liability
  Economic                           Demographic
   Discount rate                     Participation rates
                                         – Employee
   Pay increase rates (severance)
                                         – Spouse
   Healthcare trend rates               – Pre/post Medicare

   Amortization method               Retirement/turnover rates
                                      Plan election


                                                                   8
Distinction Between Accounting and Funding

• Accounting is required by GASB
   – Measure liabilities
   – Allocate expense to current year
   – Report
• Funding is a management choice
   – Balance assets and liabilities
   – Match contributions and expense
   – OPEB bonds now require a referendum


                                             9
Two Methods of Funding


     Pay-as-you-go           Actuarial Method
   Paying an amount each       Paying to an OPEB
      year equal to the      plan an amount that is
   benefits distributed or        expected to be
    claimed in that year     sufficient to pay for the
                              benefits of employees
                             after they are no longer
                                     working


                                                         10
Health Care Costs Are Age Related

               Age    Monthly Cost     Index to 45
               25        $245             55%
               30         284             64%
               35         329             74%
               40         382             86%
               45         442            100%
               50         513            116%
               55         594            134%
               60         689            156%
               65         287             65%
               70         333             75%
               75         387             88%

  Difference between actual cost and premium is Implicit Subsidy
                                                                   11
Implicit Healthcare Subsidy


              Insured Medical Plan Costs
        Monthly premium                  $400
        Retiree monthly contribution     $200
        Net employer cost                $200

               GASB 43/45 Interpretation
        Retiree age-specific cost        $520
        Retiree monthly contribution     $200
        Net employer OPEB cost           $320


                                                12
GASB Actuarial Valuation Required

• Groups over 200 total membership – every 2 years
• Groups under 200 – every 3rd year
• Groups under 100 – “alternative measurement method”
  permitted (intended to make it possible to do calculations
  without using an actuary)


                                                               13
Annual OPEB Cost Definitions

• Annual Required Contribution (ARC)
– Normal cost + amortization of unfunded actuarial accrued liability over
  maximum 30 year period

• Net OPEB Obligation (NOO)
– The cumulative difference since implementation between the annual
  OPEB cost and the employer’s contributions

• If Net OPEB Obligation exists…
– Annual OPEB Cost=ARC + one year’s interest on NOO + adjustment to
  ARC
        •ARC adjustment is the discounted value of the balance of the net OPEB
        obligation


                                                                                 14
OPEB Funding Rules

• GASB’s requirements for a funded plan
   – Employer contributions irrevocable
   – Assets dedicated to providing retiree benefits (establishing a Trust)
   – Assets protected from creditors


• Trust funding vehicles
   – 501(c)(9) trust, aka VEBA
   – Section 115 Trust
   – Insurance Contract


                                                                             15
Implications of Funding

•   Potential higher discount rate
•   Greater flexibility in investments
•   Smaller ARC and Net OPEB Obligation
•   Better credit rating


* Note that pre‐funding is not required
                                          16
Authorized Investment Considerations

• Permitted ‘NON’ OPEB Trust considerations
   – Short term horizon
   – Uncertain cash flow
   – 1st priority…protect investment principal
   – Limited by M.S. 118A
       •   Bank Deposits and Certificates of Deposit
       •   Local Government Investment Pools
       •   Municipal Notes
       •   Commercial Paper, etc.
   – Local investment policy guides investment strategy
       • MSBA model policy
       • Often written with no consideration of OPEB Trusts


                                                              17
Authorized Investment Considerations (cont.)

• OPEB Trust considerations
   –   Long term horizon
   –   Predictable cash flow needs
   –   1st priority…achieve long term growth
   –   Limited by M.S. 356A
        • All provisions of 118A permitted
        • Equity exposure permitted
   – Local investment policy guides investment strategy
        • Identify asset allocation targets
        • Clarify liquidity needs
        • Portfolio limitations


                                                          18
Long-term Equity and Bond Returns Have Outpaced Inflation

                                    Annualized 5 Year Rolling Equity & Bond Returns
          Return Values
         30.0%

         28.0%

         26.0%

         24.0%

         22.0%

         20.0%
                                                             DOMESTIC EQUITY
                                                              DOMESTIC EQUITY
         18.0%                                             Geometric Mean: 10.67%
                                                            Geometric Mean: 10.67%
         16.0%

         14.0%

         12.0%

         10.0%

          8.0%

          6.0%

          4.0%

          2.0%

          0.0%                                                                                              AGGREGATE
                                                                                                              AGGREGATE
         -2.0%                                                                                             FIXED INCOME
                                   U.S. INFLATION                                                            FIXED INCOME
                                    U.S. INFLATION                                                      Geometric Mean: 5.60%
         -4.0%                                                                                           Geometric Mean: 5.60%
                                Geometric Mean: 3.86%
                                 Geometric Mean: 3.86%
         -6.0%

         -8.0%

        -10.0%
               Dec        Dec         Dec      Dec        Dec        Dec         Dec        Dec       Dec        Dec        Dec        Dec            Dec
               1950       1955        1960     1965       1970       1975       1980        1985      1990       1995       2000       2005           2012
                                                                             Interval: 60
         S&P 500 TR                    Barclays Aggregate Bond (1976-2011) and 50% Intermediate Corporate; 25% Int. Govt; and 25% US Long-term Govt (1950-1976)
   _____ Consumer Price Index                                                                                             Source: Morningstar En Corr/ Ibbotson Associates

                                                                                                                                                                             19
Pre-Funding Advantage

• Best practices in managing OPEB liabilities include
  funding
  – Pay-as-you-go funding basis is unsecured borrowing
    against future revenues
  – Fund OPEB at the same time as other compensation

• Major advantages to having an OPEB trust:
  – Improved credit rating
  – Uses current tax dollars to pay for current compensation
  – Prudent long term investments reduces the cost


                                                               20
Discount Rate Advantage

• Discount rate is based on expected rate of return
• OPEB Trust assets will earn a higher rate of return
  – Higher rate of return means higher discount rates
  – Higher discount rate means lower liabilities
  – Lower liabilities produces a stronger balance sheet

• Unfunded OPEB liabilities come from general assets
  – Internal School District assets are severely restricted to the
    safest and lowest return investments
  – Lower discount rate means higher liabilities


                                                                 21
Discount Rate Advantage Example


                                 6% Return 4% Return Increase

Retiree liability - for
                                  $478,311     $499,169       4%
payments before age 65

Active liability                  $594,320     $686,001       15%

Total liability                  $1,072,631 $1,185,170        10%


      The higher the investment return the smaller the liability and
      the less assets needed to pay for the promised benefits.


                                                                       22
Predictable Long Term Cash Flow


  Why invest for the short term when the cash flows are long term?
                                                                     23
How Long Will the Assets Last?


                                 24
Properly Structured Portfolios are Key


Source: Bloomberg
                                          25
Short term strategy for long term obligation


                    An investment strategy based upon M.S.
                    118A restrictions will likely deplete OPEB
                    Trust prematurely!


                    2‐Year U.S. Treasury Note Yield
Source: Bloomberg
                                                                 26
Projected Total OPEB Liability


                                 27
2.5% Return Depletes the Trust Rapidly!


                                          28
Asset Allocation and Diversification are Critical


                                                    29
S&P 500 Has Generated Inconsistent Historical Returns
                        Frequency of S&P 500 Calendar Year Returns since 1926
                   Only 5 out of 87 calendar year periods has the S&P 500 return been between 8%‐12%
      Number
      7


      6


      5


      4


      3


      2


      1


      0
       -44.0% -38.0% -32.0% -26.0% -20.0% -14.0%     -8.0%   -2.0%   4.0%   10.0%   16.0%   22.0%   28.0%   34.0%   40.0%   46.0%   54.0%
                                                                     Return
  Source:  Morningstar EnCorr/ Ibbotson Associates


                                                                                                                                            30
Diversification: There is no substitute


                                          31
Great Opportunities Exist Outside The U.S.
                                                   World Market Capitalization

                           1970 1                                                       2012 2


                                                                         2030 3


                  2012 Total Market Capitalization: $29.5                               Trillion 2
   1) Data from BlackRock, Inc. which includes developed only
   2) Data from MSCI: includes total U.S. ($13.4 Trillion), ACWI ex US ($16 Trillion)
   3) Projection from Goldman Sachs
                                                                                                     32
Board Member Implications

• Fiduciary Responsibility
   – Know the Investment Policy
   – Monitor the Investment Performance
   – Rely on the Experts
• Investment Expertise
   – No requirement to be an expert
   – Hire expertise
• Administration Expertise
   – Experts at school administration are probably not experts on OPEB
     investments


                                                                         33
DANGER in Playing it Safe

• Safe does not automatically mean prudent
    – Fiduciary duty to be prudent
•   Bond proceeds may be depleted prior to final bond payment
•   Investment earnings may be lower than bond interest
•   Disappointed constituents
•   Less money for school operations
•   Lost opportunity cost
•   Headline risk


                                                                34
School Board Action Plan

• Estimate the projected life of the OPEB Trust
• Review investment policy and its handling of OPEB
• Amend policy and investment strategy appropriately

A detailed actuarial report is the start of the process


                                                          35
Actuarial Caveats

• Retiree medical cash flows are less predictable than
  retirement benefits
• Changes in federal health care laws and benefits materially
  affect the projected benefits
• Changes in investment policy materially affect investment
  return expectations and the discount rate
• Health care cost inflation is higher and more variable than
  general consumer price inflation


                                                                36
Disclaimers

Any investment advice in this document is provided solely by PFM Asset
Management LLC. PFM Asset Management LLC (“PFMAM”) is an investment
advisor registered under the Investment Advisers Act of 1940. PFM Advisors is
a division of PFM Asset Management LLC. Public Financial Management Inc. is
not providing and is not responsible for any investment advice herein.


This material is based on information obtained from sources generally believed
to be reliable and available to the public, however PFM Asset Management LLC
cannot guarantee its accuracy, completeness or suitability. This material is for
general information purposes only and is not intended to provide specific advice
or a specific recommendation. All statements as to what will or may happen
under certain circumstances are based on assumptions, some but not all of
which are noted in the presentation. Assumptions may or may not be proven
correct as actual events occur, and results may depend on events outside of
your or our control. Changes in assumptions may have a material effect on
results. Past performance does not necessarily reflect and is not a guaranty of
future results. The information contained in this presentation is not an offer to
purchase or sell any securities.


                                                                                    37

OPEB Investments: The Danger in Playing it Safe

  • 1.
    OPEB Investments: The DANGER in Playing it Safe January 17, 2013 Tony Jacobs Mark D. Meyer, JD, FSA Mary Fedorak Donn Hanson Treasurer, LCWM School Board Van Iwaarden Associates MACM Regional Product Specialist Director 607 Knights Lane 840 Lumber Exchange 222 North LaSalle 800 Nicollet Mall Lake Crystal, MN 56055 10 South Fifth Street Suite 910 Suite 2710 (507)726-2323 Minneapolis, MN 55402 Chicago, IL 60601 Minneapolis, MN 55402 (888) 596-5960 (312) 523-2438 (612) 371-3720 markm@vaniwaarden.com fedorakm@pfm.com hansond@pfm.com www.vaniwaarden.com www.pfm.com www.pfm.com
  • 2.
    Presentation Overview • OPEBBasics • Actuarial Implications • Investment Implications • Board Implications • Questions and Answers 2
  • 3.
    GASB Accounting forOPEB Other Post-Employment Benefits 3
  • 4.
    Background of GASBStatements OPEB in the Media “School districts struggle to pay retirees' health benefits” “The next retirement time bomb” “Officials continue to grapple with liability issue” “District is stretching out OPEB burden” 4
  • 5.
    What is anOPEB? • Form of deferred compensation • Promise to provide retiree benefits must now be accrued during the working years of employees • Post-retirement benefit other than pension – Including: • Retiree medical, life, vision, dental • Implicit retiree medical subsidy – Not Including: • Early retirement incentives, severance based on unused sick pay, vacation and compensated absences 5
  • 6.
    Implicit Rate Subsidiesfor Retirees • In health insurance plans where a government’s retirees and current employees are insured together as a group • The premiums paid by the retirees are lower than they would have been if the retirees were insured separately 6
  • 7.
    The Actuarial Modelfor OPEB Liability Data Assumptions Methods Plan Provisions Actuarial Model (Present Value of Benefits) Liabilities Accounting Results • Accrued liability • Balance sheet liability Projected Payments • Normal cost • Accounting expense 7
  • 8.
    Important Actuarial Assumptions Factors that affect liability Economic Demographic  Discount rate  Participation rates – Employee  Pay increase rates (severance) – Spouse  Healthcare trend rates – Pre/post Medicare  Amortization method  Retirement/turnover rates  Plan election 8
  • 9.
    Distinction Between Accountingand Funding • Accounting is required by GASB – Measure liabilities – Allocate expense to current year – Report • Funding is a management choice – Balance assets and liabilities – Match contributions and expense – OPEB bonds now require a referendum 9
  • 10.
    Two Methods ofFunding Pay-as-you-go Actuarial Method Paying an amount each Paying to an OPEB year equal to the plan an amount that is benefits distributed or expected to be claimed in that year sufficient to pay for the benefits of employees after they are no longer working 10
  • 11.
    Health Care CostsAre Age Related Age Monthly Cost Index to 45 25 $245 55% 30 284 64% 35 329 74% 40 382 86% 45 442 100% 50 513 116% 55 594 134% 60 689 156% 65 287 65% 70 333 75% 75 387 88% Difference between actual cost and premium is Implicit Subsidy 11
  • 12.
    Implicit Healthcare Subsidy Insured Medical Plan Costs Monthly premium $400 Retiree monthly contribution $200 Net employer cost $200 GASB 43/45 Interpretation Retiree age-specific cost $520 Retiree monthly contribution $200 Net employer OPEB cost $320 12
  • 13.
    GASB Actuarial ValuationRequired • Groups over 200 total membership – every 2 years • Groups under 200 – every 3rd year • Groups under 100 – “alternative measurement method” permitted (intended to make it possible to do calculations without using an actuary) 13
  • 14.
    Annual OPEB CostDefinitions • Annual Required Contribution (ARC) – Normal cost + amortization of unfunded actuarial accrued liability over maximum 30 year period • Net OPEB Obligation (NOO) – The cumulative difference since implementation between the annual OPEB cost and the employer’s contributions • If Net OPEB Obligation exists… – Annual OPEB Cost=ARC + one year’s interest on NOO + adjustment to ARC •ARC adjustment is the discounted value of the balance of the net OPEB obligation 14
  • 15.
    OPEB Funding Rules •GASB’s requirements for a funded plan – Employer contributions irrevocable – Assets dedicated to providing retiree benefits (establishing a Trust) – Assets protected from creditors • Trust funding vehicles – 501(c)(9) trust, aka VEBA – Section 115 Trust – Insurance Contract 15
  • 16.
    Implications of Funding • Potential higher discount rate • Greater flexibility in investments • Smaller ARC and Net OPEB Obligation • Better credit rating * Note that pre‐funding is not required 16
  • 17.
    Authorized Investment Considerations •Permitted ‘NON’ OPEB Trust considerations – Short term horizon – Uncertain cash flow – 1st priority…protect investment principal – Limited by M.S. 118A • Bank Deposits and Certificates of Deposit • Local Government Investment Pools • Municipal Notes • Commercial Paper, etc. – Local investment policy guides investment strategy • MSBA model policy • Often written with no consideration of OPEB Trusts 17
  • 18.
    Authorized Investment Considerations(cont.) • OPEB Trust considerations – Long term horizon – Predictable cash flow needs – 1st priority…achieve long term growth – Limited by M.S. 356A • All provisions of 118A permitted • Equity exposure permitted – Local investment policy guides investment strategy • Identify asset allocation targets • Clarify liquidity needs • Portfolio limitations 18
  • 19.
    Long-term Equity andBond Returns Have Outpaced Inflation Annualized 5 Year Rolling Equity & Bond Returns Return Values 30.0% 28.0% 26.0% 24.0% 22.0% 20.0% DOMESTIC EQUITY DOMESTIC EQUITY 18.0% Geometric Mean: 10.67% Geometric Mean: 10.67% 16.0% 14.0% 12.0% 10.0% 8.0% 6.0% 4.0% 2.0% 0.0% AGGREGATE AGGREGATE -2.0% FIXED INCOME U.S. INFLATION FIXED INCOME U.S. INFLATION Geometric Mean: 5.60% -4.0% Geometric Mean: 5.60% Geometric Mean: 3.86% Geometric Mean: 3.86% -6.0% -8.0% -10.0% Dec Dec Dec Dec Dec Dec Dec Dec Dec Dec Dec Dec Dec 1950 1955 1960 1965 1970 1975 1980 1985 1990 1995 2000 2005 2012 Interval: 60 S&P 500 TR Barclays Aggregate Bond (1976-2011) and 50% Intermediate Corporate; 25% Int. Govt; and 25% US Long-term Govt (1950-1976) _____ Consumer Price Index Source: Morningstar En Corr/ Ibbotson Associates 19
  • 20.
    Pre-Funding Advantage • Bestpractices in managing OPEB liabilities include funding – Pay-as-you-go funding basis is unsecured borrowing against future revenues – Fund OPEB at the same time as other compensation • Major advantages to having an OPEB trust: – Improved credit rating – Uses current tax dollars to pay for current compensation – Prudent long term investments reduces the cost 20
  • 21.
    Discount Rate Advantage •Discount rate is based on expected rate of return • OPEB Trust assets will earn a higher rate of return – Higher rate of return means higher discount rates – Higher discount rate means lower liabilities – Lower liabilities produces a stronger balance sheet • Unfunded OPEB liabilities come from general assets – Internal School District assets are severely restricted to the safest and lowest return investments – Lower discount rate means higher liabilities 21
  • 22.
    Discount Rate AdvantageExample 6% Return 4% Return Increase Retiree liability - for $478,311 $499,169 4% payments before age 65 Active liability $594,320 $686,001 15% Total liability $1,072,631 $1,185,170 10% The higher the investment return the smaller the liability and the less assets needed to pay for the promised benefits. 22
  • 23.
    Predictable Long TermCash Flow Why invest for the short term when the cash flows are long term? 23
  • 24.
    How Long Willthe Assets Last? 24
  • 25.
    Properly Structured Portfoliosare Key Source: Bloomberg 25
  • 26.
    Short term strategyfor long term obligation An investment strategy based upon M.S. 118A restrictions will likely deplete OPEB Trust prematurely! 2‐Year U.S. Treasury Note Yield Source: Bloomberg 26
  • 27.
  • 28.
    2.5% Return Depletesthe Trust Rapidly! 28
  • 29.
    Asset Allocation andDiversification are Critical 29
  • 30.
    S&P 500 HasGenerated Inconsistent Historical Returns Frequency of S&P 500 Calendar Year Returns since 1926 Only 5 out of 87 calendar year periods has the S&P 500 return been between 8%‐12% Number 7 6 5 4 3 2 1 0 -44.0% -38.0% -32.0% -26.0% -20.0% -14.0% -8.0% -2.0% 4.0% 10.0% 16.0% 22.0% 28.0% 34.0% 40.0% 46.0% 54.0% Return Source:  Morningstar EnCorr/ Ibbotson Associates 30
  • 31.
    Diversification: There isno substitute 31
  • 32.
    Great Opportunities ExistOutside The U.S. World Market Capitalization 1970 1 2012 2 2030 3 2012 Total Market Capitalization: $29.5 Trillion 2 1) Data from BlackRock, Inc. which includes developed only 2) Data from MSCI: includes total U.S. ($13.4 Trillion), ACWI ex US ($16 Trillion) 3) Projection from Goldman Sachs 32
  • 33.
    Board Member Implications •Fiduciary Responsibility – Know the Investment Policy – Monitor the Investment Performance – Rely on the Experts • Investment Expertise – No requirement to be an expert – Hire expertise • Administration Expertise – Experts at school administration are probably not experts on OPEB investments 33
  • 34.
    DANGER in Playingit Safe • Safe does not automatically mean prudent – Fiduciary duty to be prudent • Bond proceeds may be depleted prior to final bond payment • Investment earnings may be lower than bond interest • Disappointed constituents • Less money for school operations • Lost opportunity cost • Headline risk 34
  • 35.
    School Board ActionPlan • Estimate the projected life of the OPEB Trust • Review investment policy and its handling of OPEB • Amend policy and investment strategy appropriately A detailed actuarial report is the start of the process 35
  • 36.
    Actuarial Caveats • Retireemedical cash flows are less predictable than retirement benefits • Changes in federal health care laws and benefits materially affect the projected benefits • Changes in investment policy materially affect investment return expectations and the discount rate • Health care cost inflation is higher and more variable than general consumer price inflation 36
  • 37.
    Disclaimers Any investment advicein this document is provided solely by PFM Asset Management LLC. PFM Asset Management LLC (“PFMAM”) is an investment advisor registered under the Investment Advisers Act of 1940. PFM Advisors is a division of PFM Asset Management LLC. Public Financial Management Inc. is not providing and is not responsible for any investment advice herein. This material is based on information obtained from sources generally believed to be reliable and available to the public, however PFM Asset Management LLC cannot guarantee its accuracy, completeness or suitability. This material is for general information purposes only and is not intended to provide specific advice or a specific recommendation. All statements as to what will or may happen under certain circumstances are based on assumptions, some but not all of which are noted in the presentation. Assumptions may or may not be proven correct as actual events occur, and results may depend on events outside of your or our control. Changes in assumptions may have a material effect on results. Past performance does not necessarily reflect and is not a guaranty of future results. The information contained in this presentation is not an offer to purchase or sell any securities. 37