Download to read offline


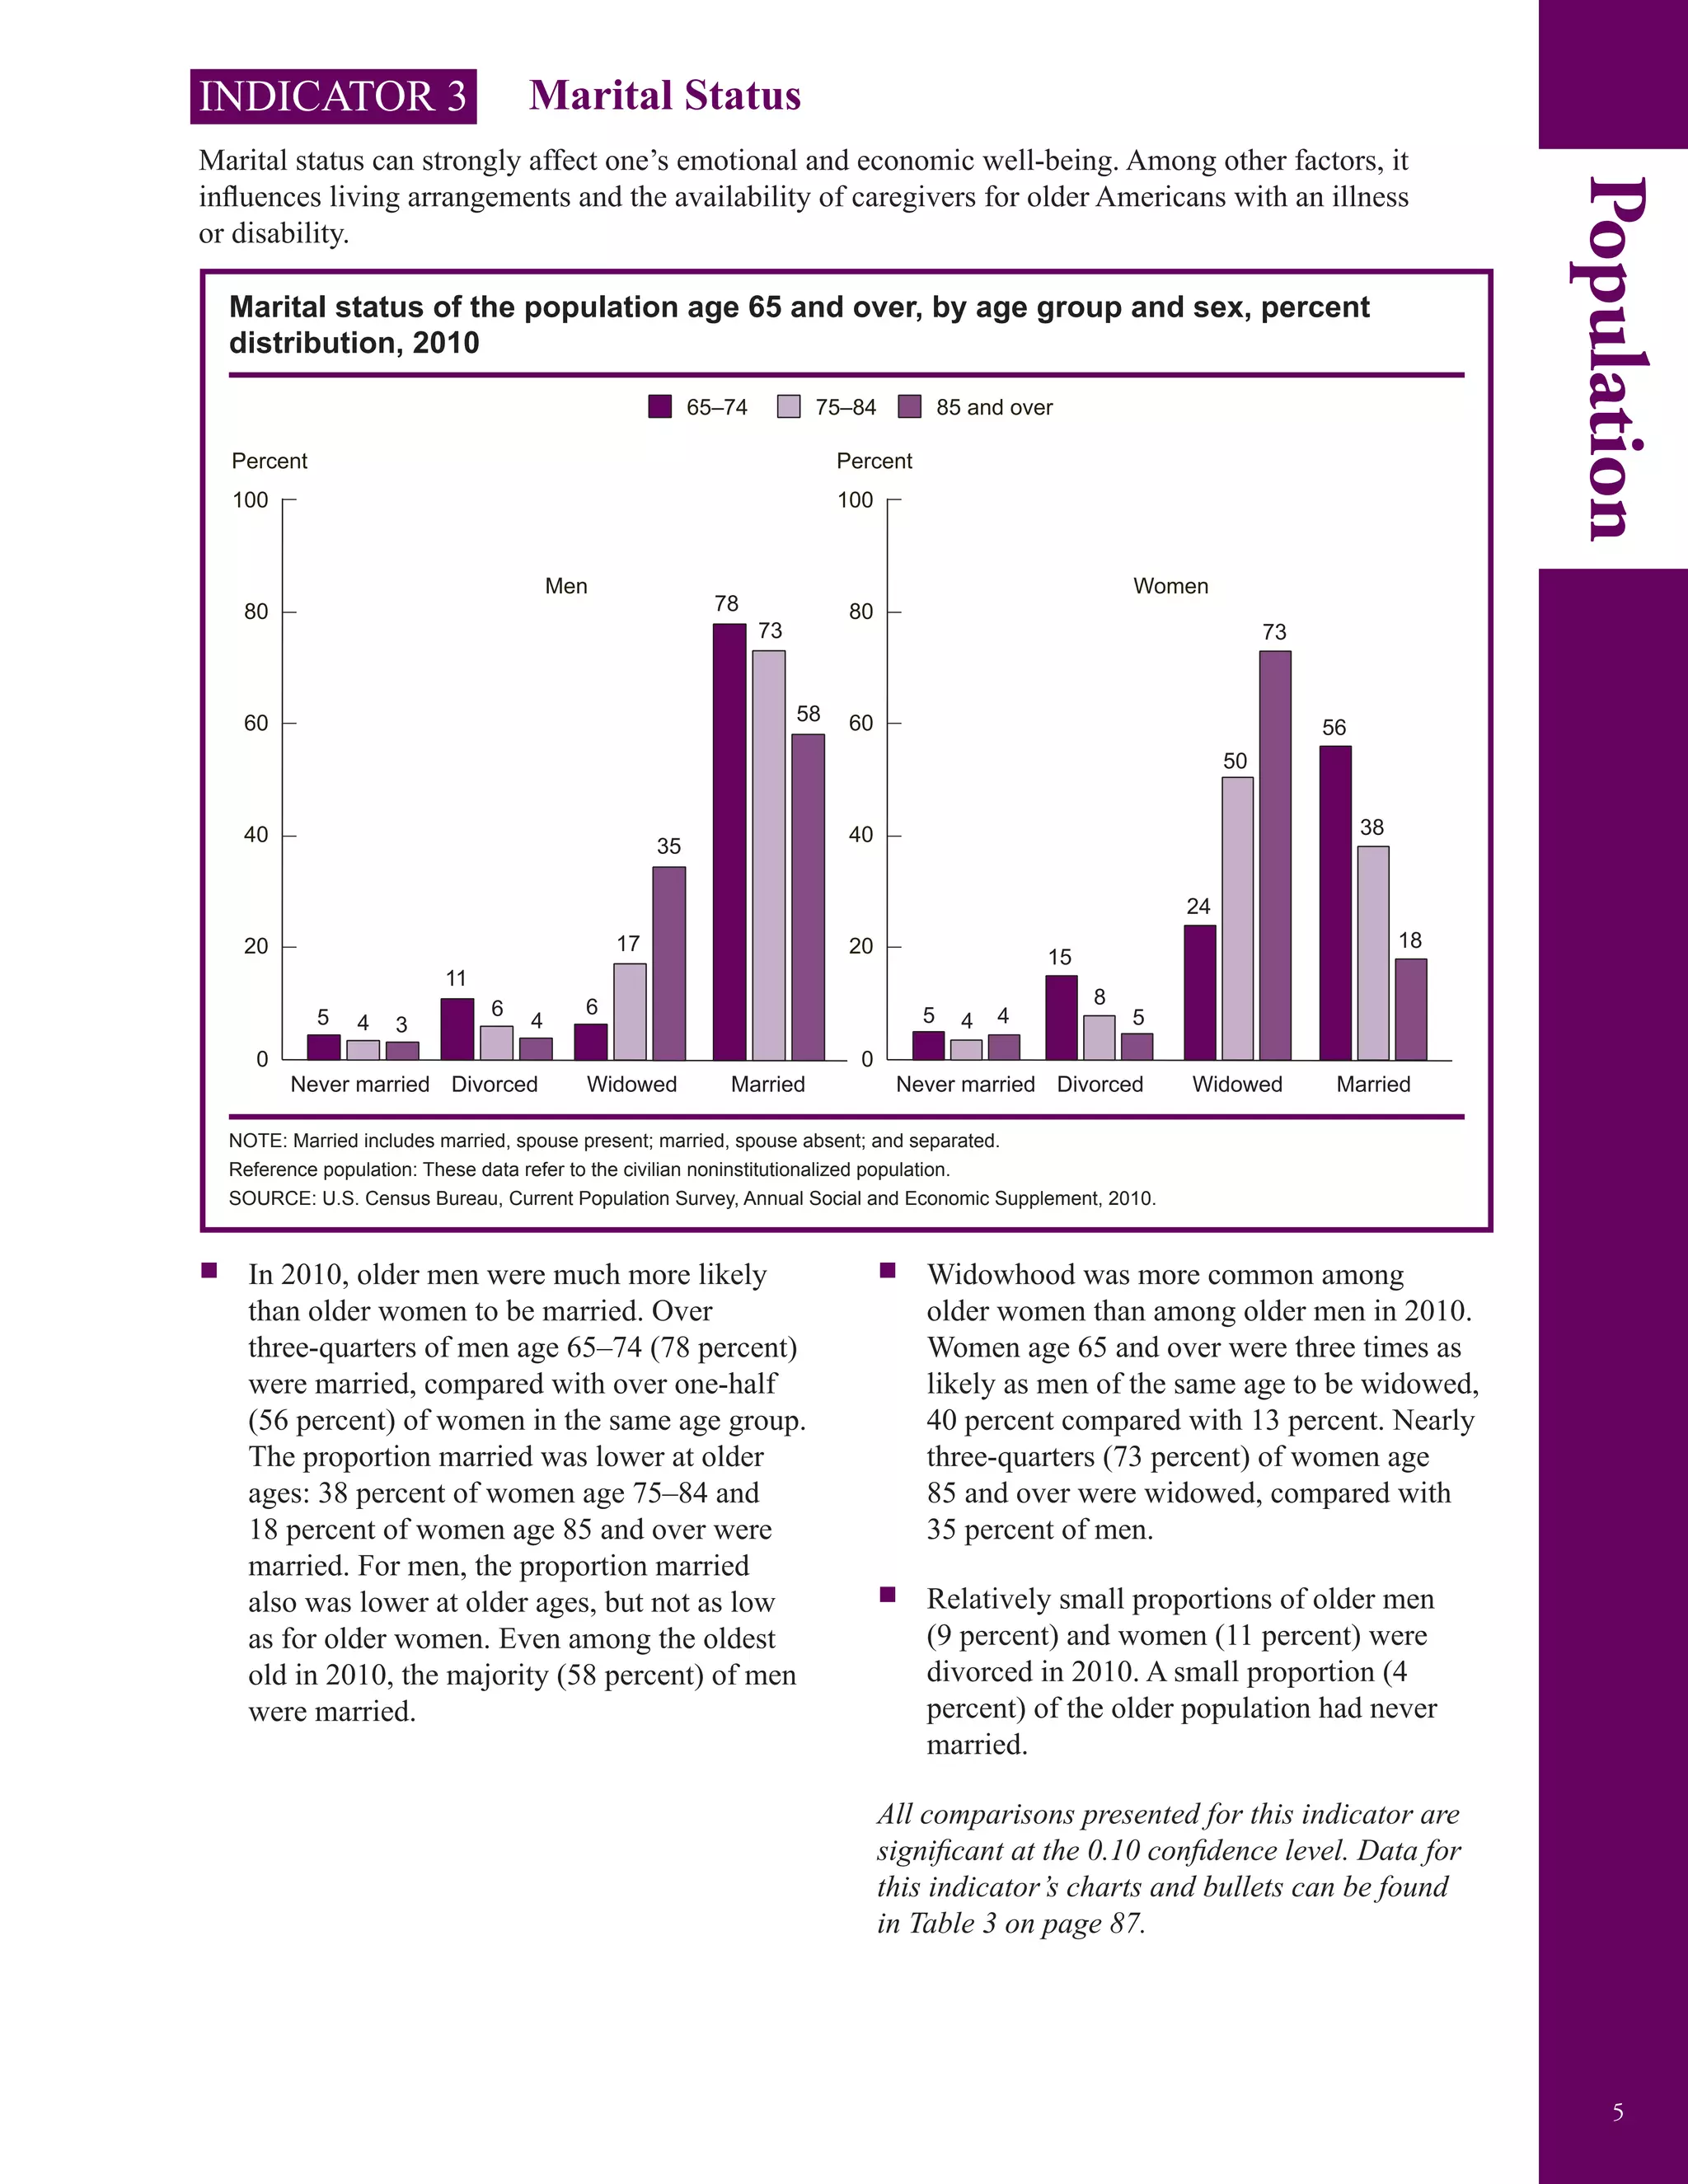


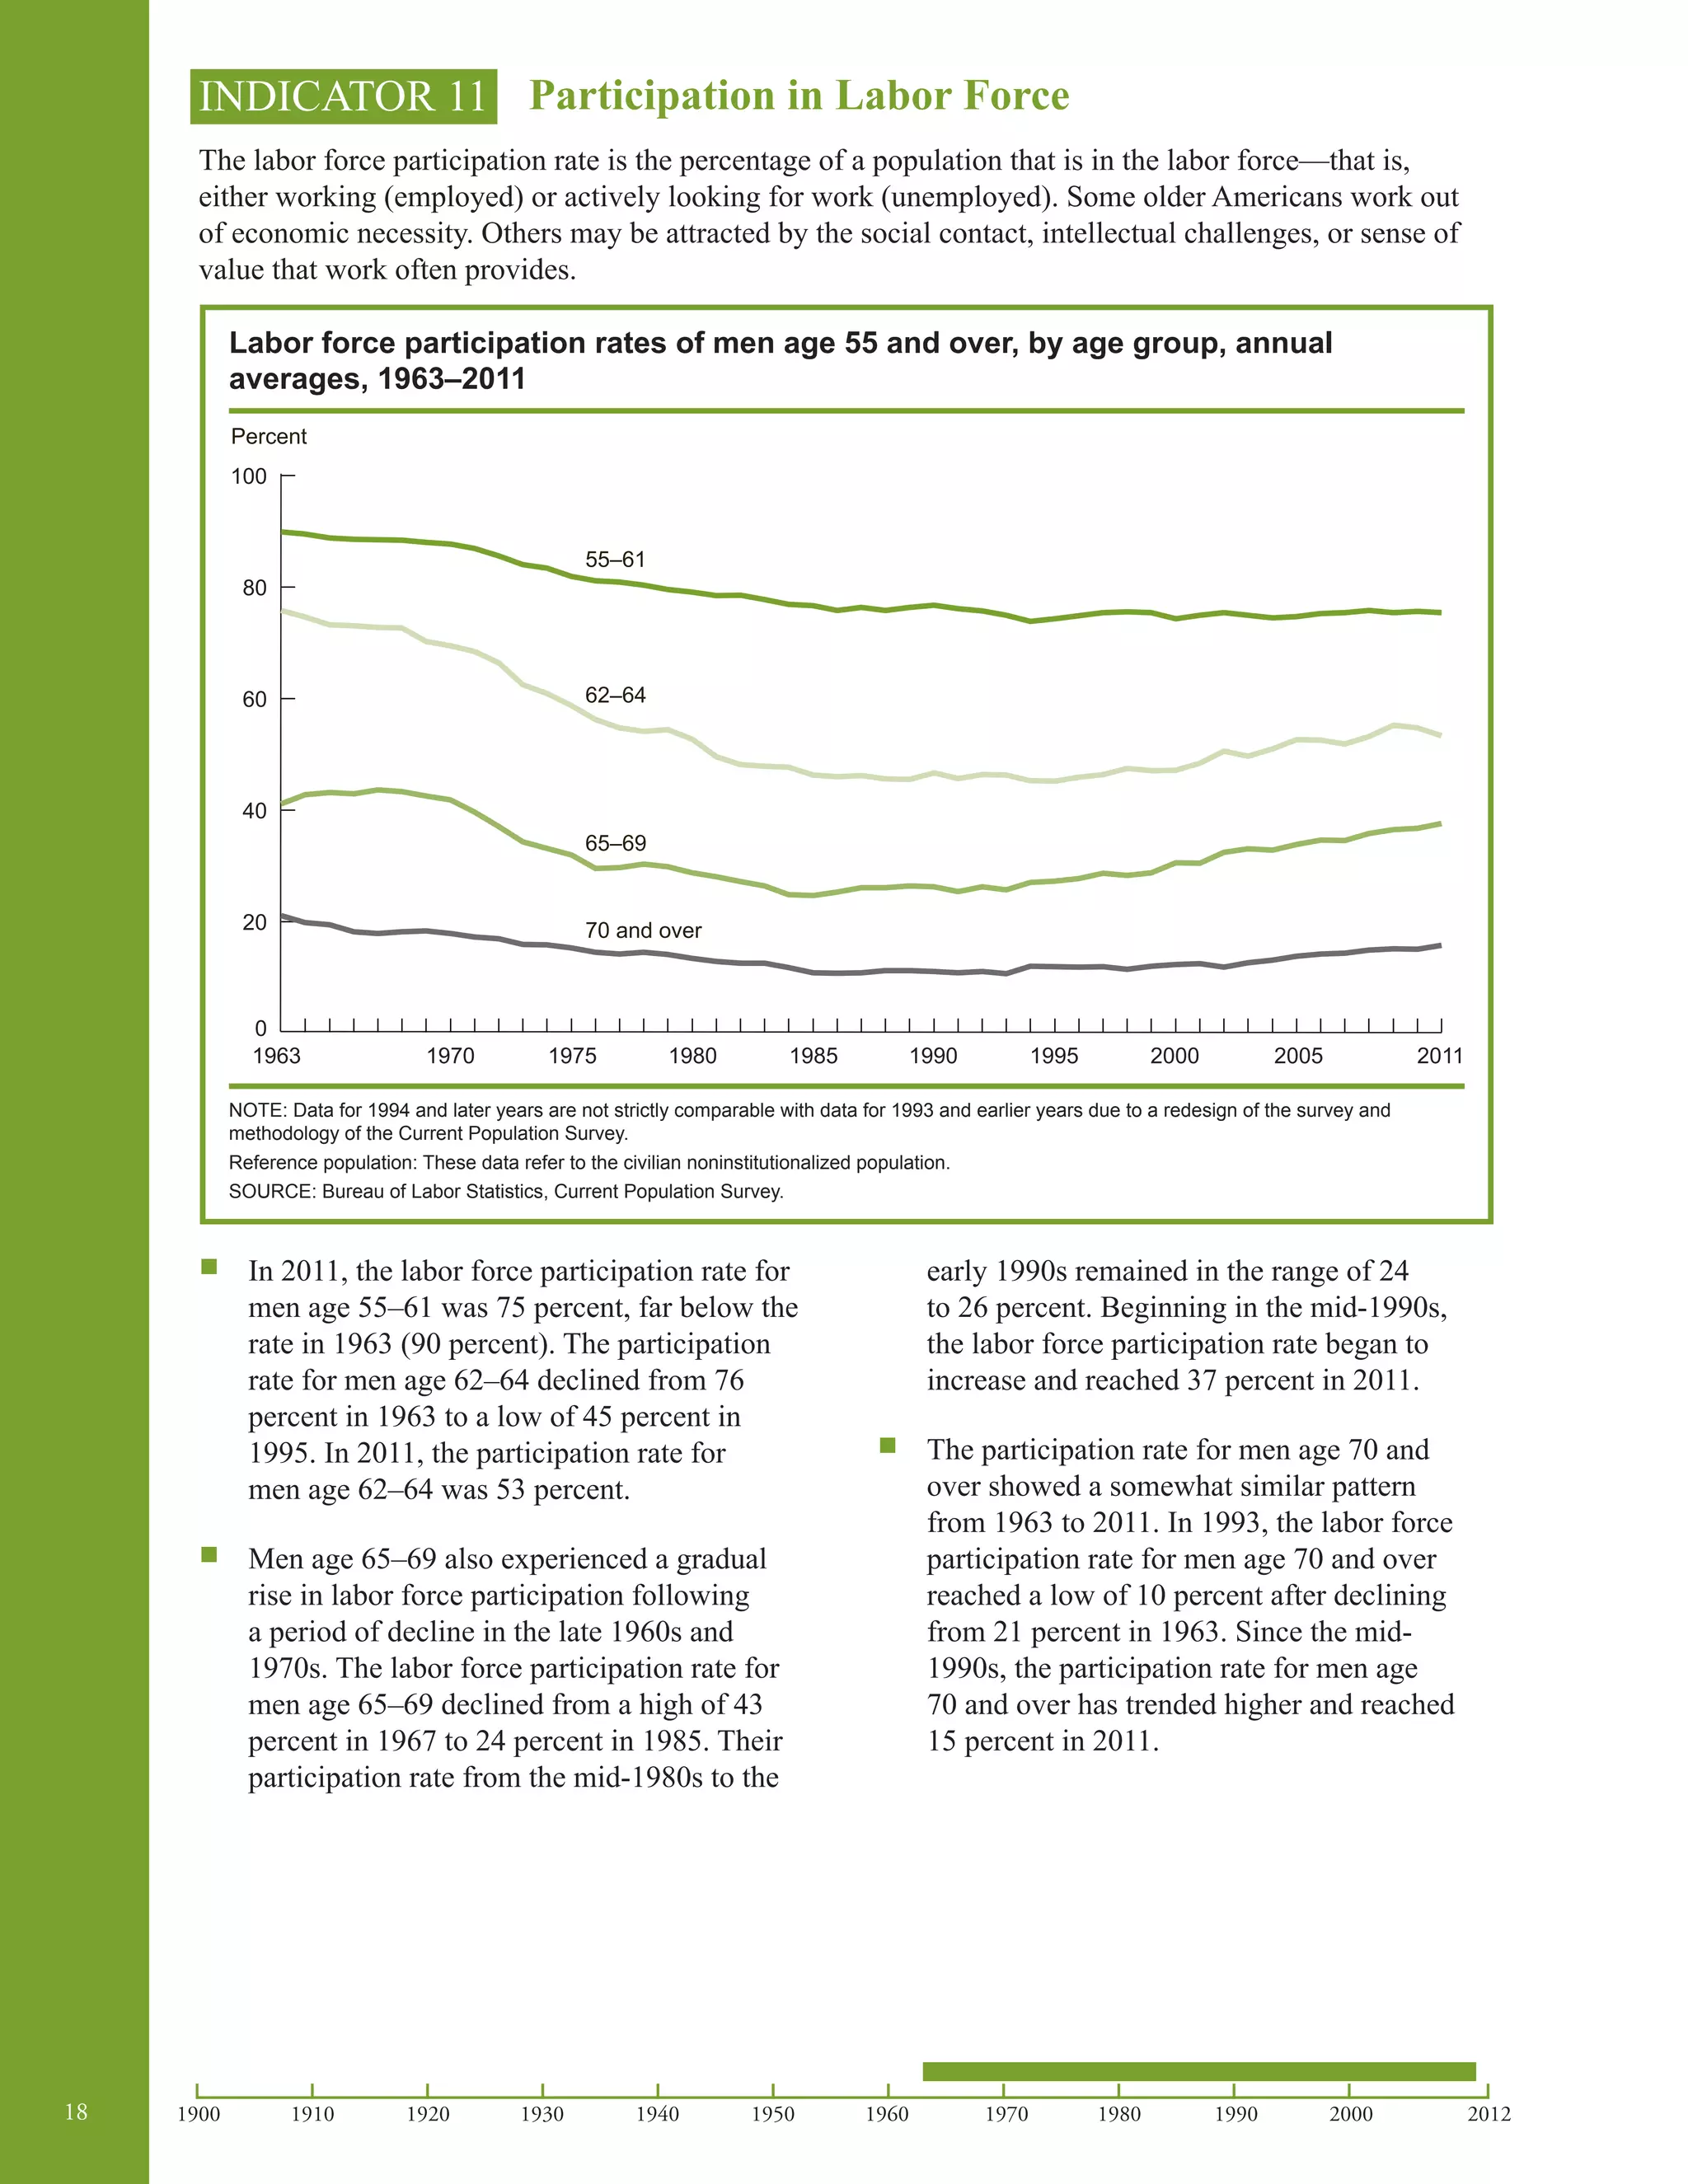


![66 201220001990198019701960195019401930192019101900
SPECIAL FEATURE End of Life
The end of life is a uniquely difficult time for patients and their families. Many issues tend to
arise, including decisions about medical care, formal and informal caregiving, transitions in living
arrangements among community, assisted living, and nursing homes, financial impacts, and whether
to use advance directives and living wills. The previous edition of Older Americans identified this topic
as one of the urgent data needs for which new data collection efforts are needed to address the lack of
knowledge and research. While national data are still lacking in many areas, this special feature will
highlight two important aspects of end-of-life care: the place of death and the type of care received
(hospice and intensive care unit/coronary care unit [ICU/CCU]) in the month prior to death.
The data on type of care received are derived from Medicare claims records. ICU/CCU use often
represents an aggressive style of care, whereas hospice offers a contrasting style emphasizing
palliation and psychosocial support. Many people receive both types of care at the end of life.
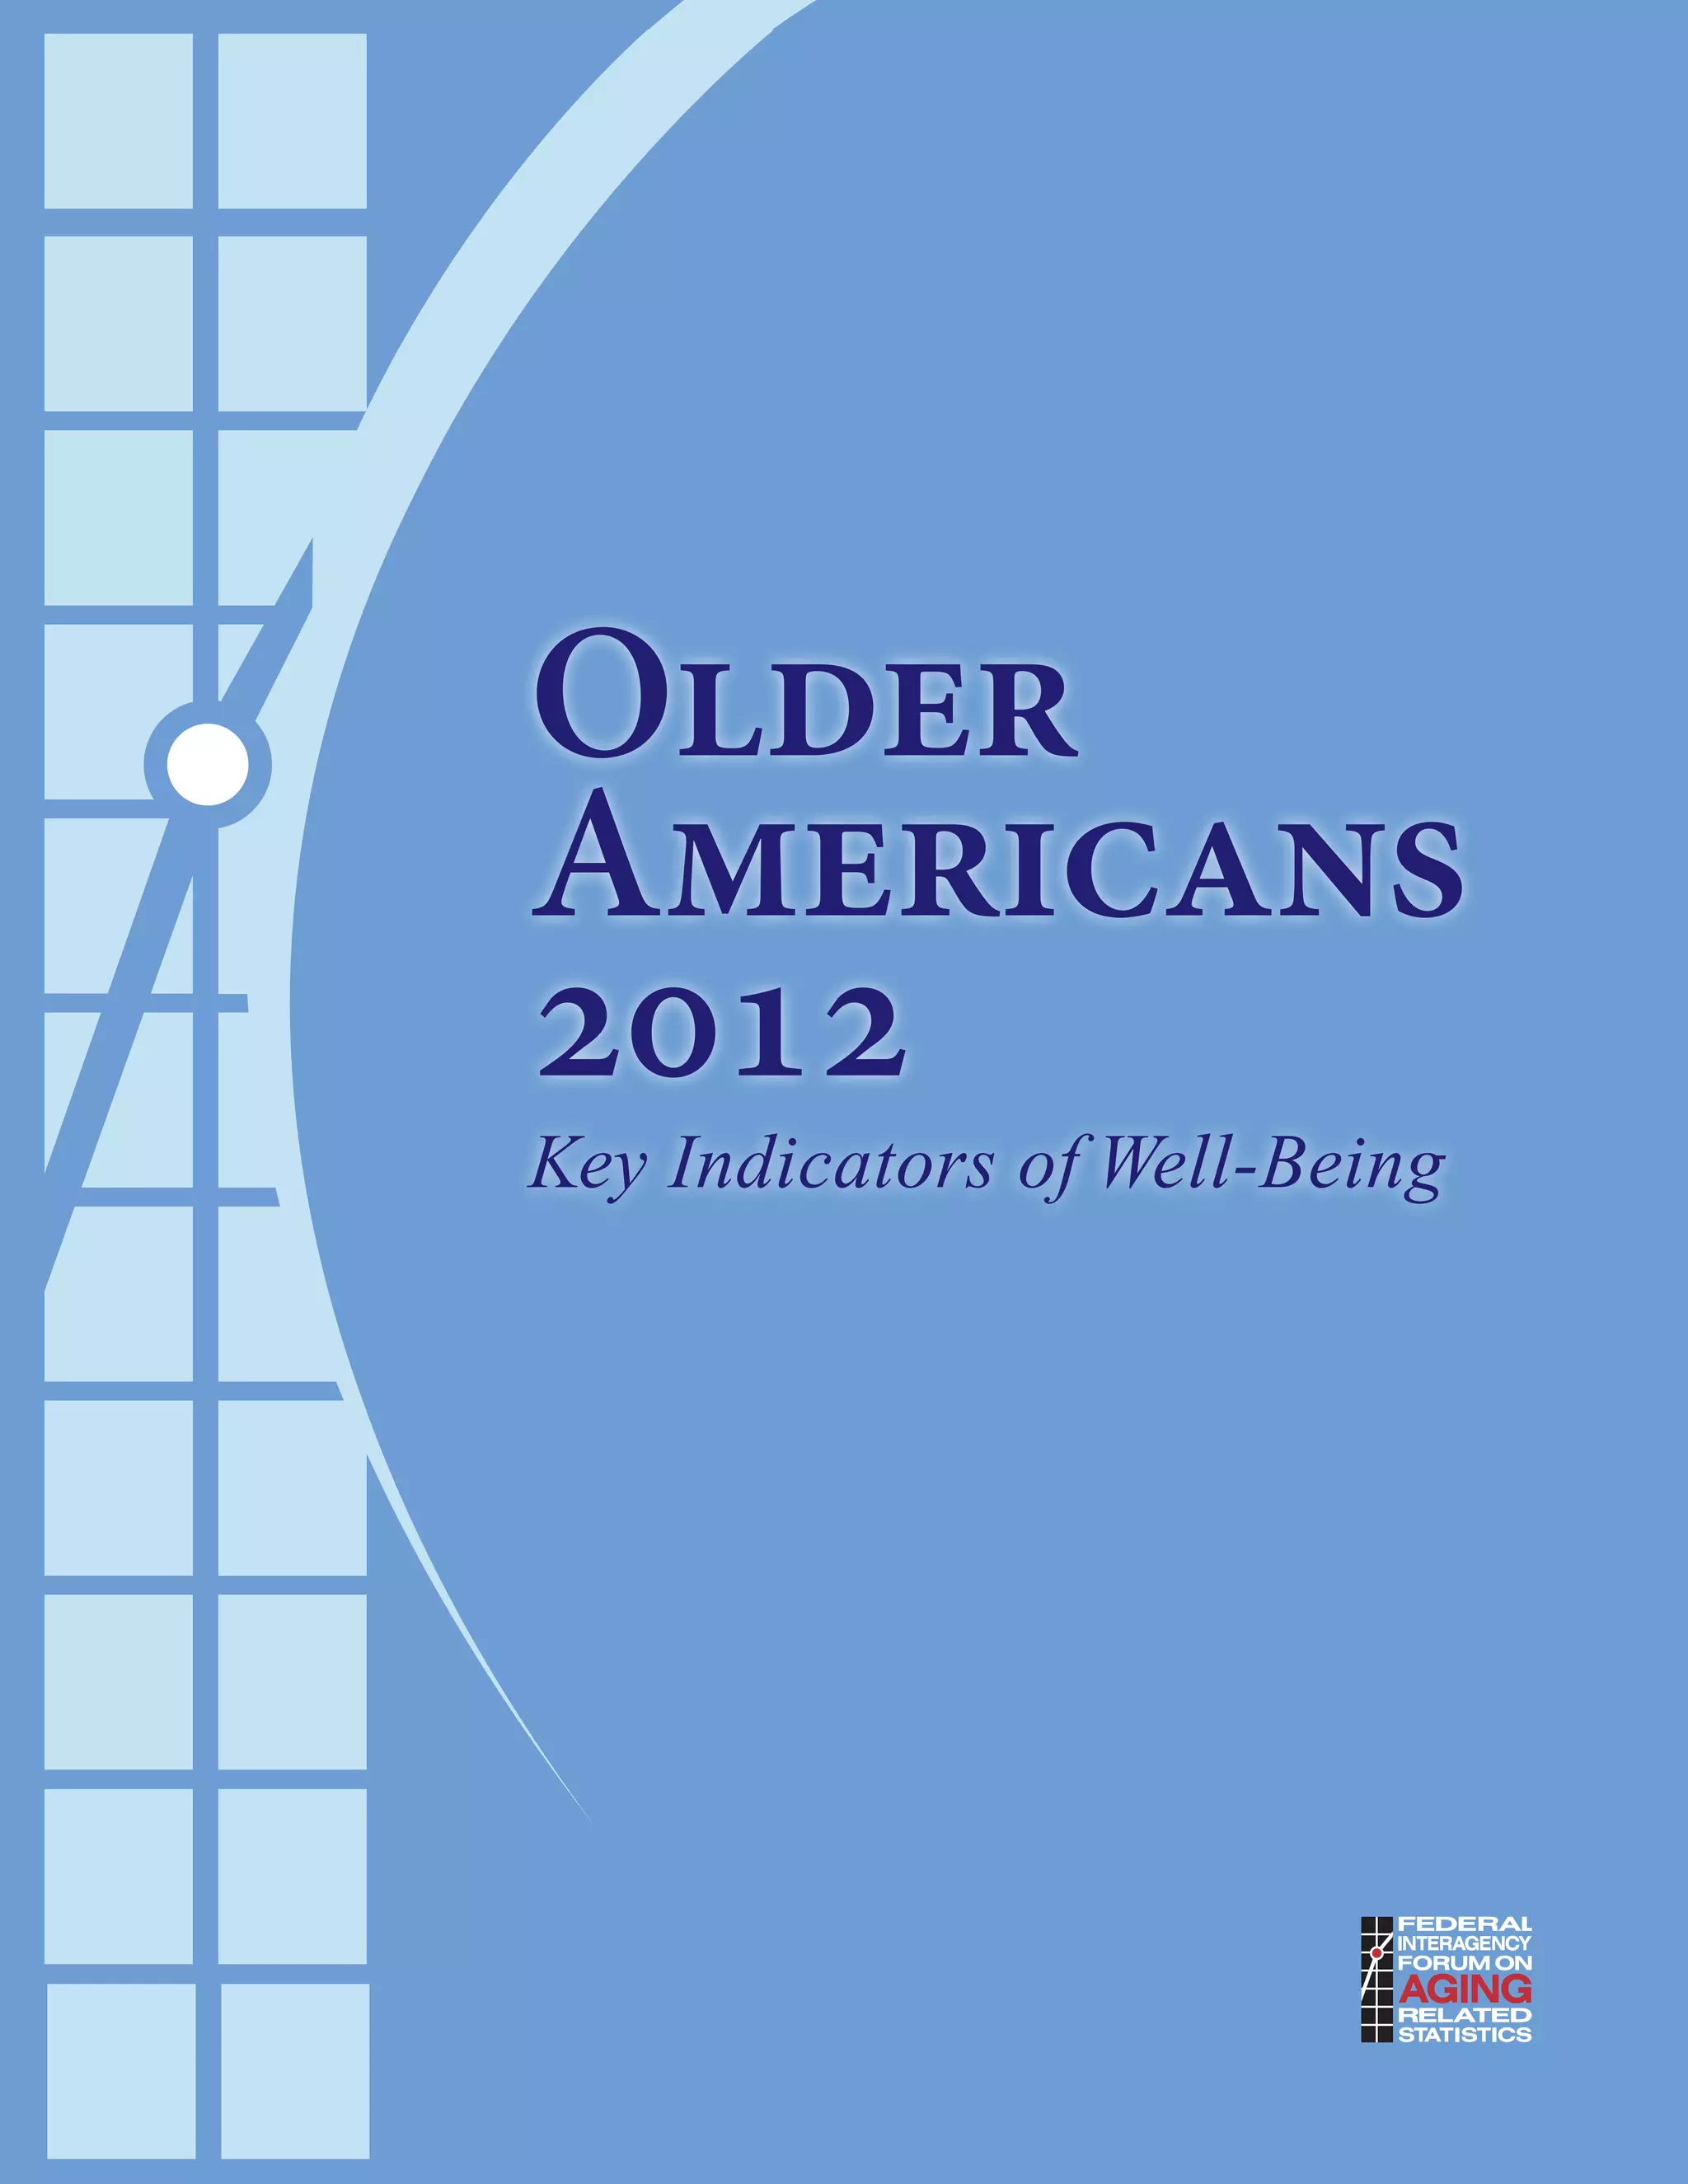
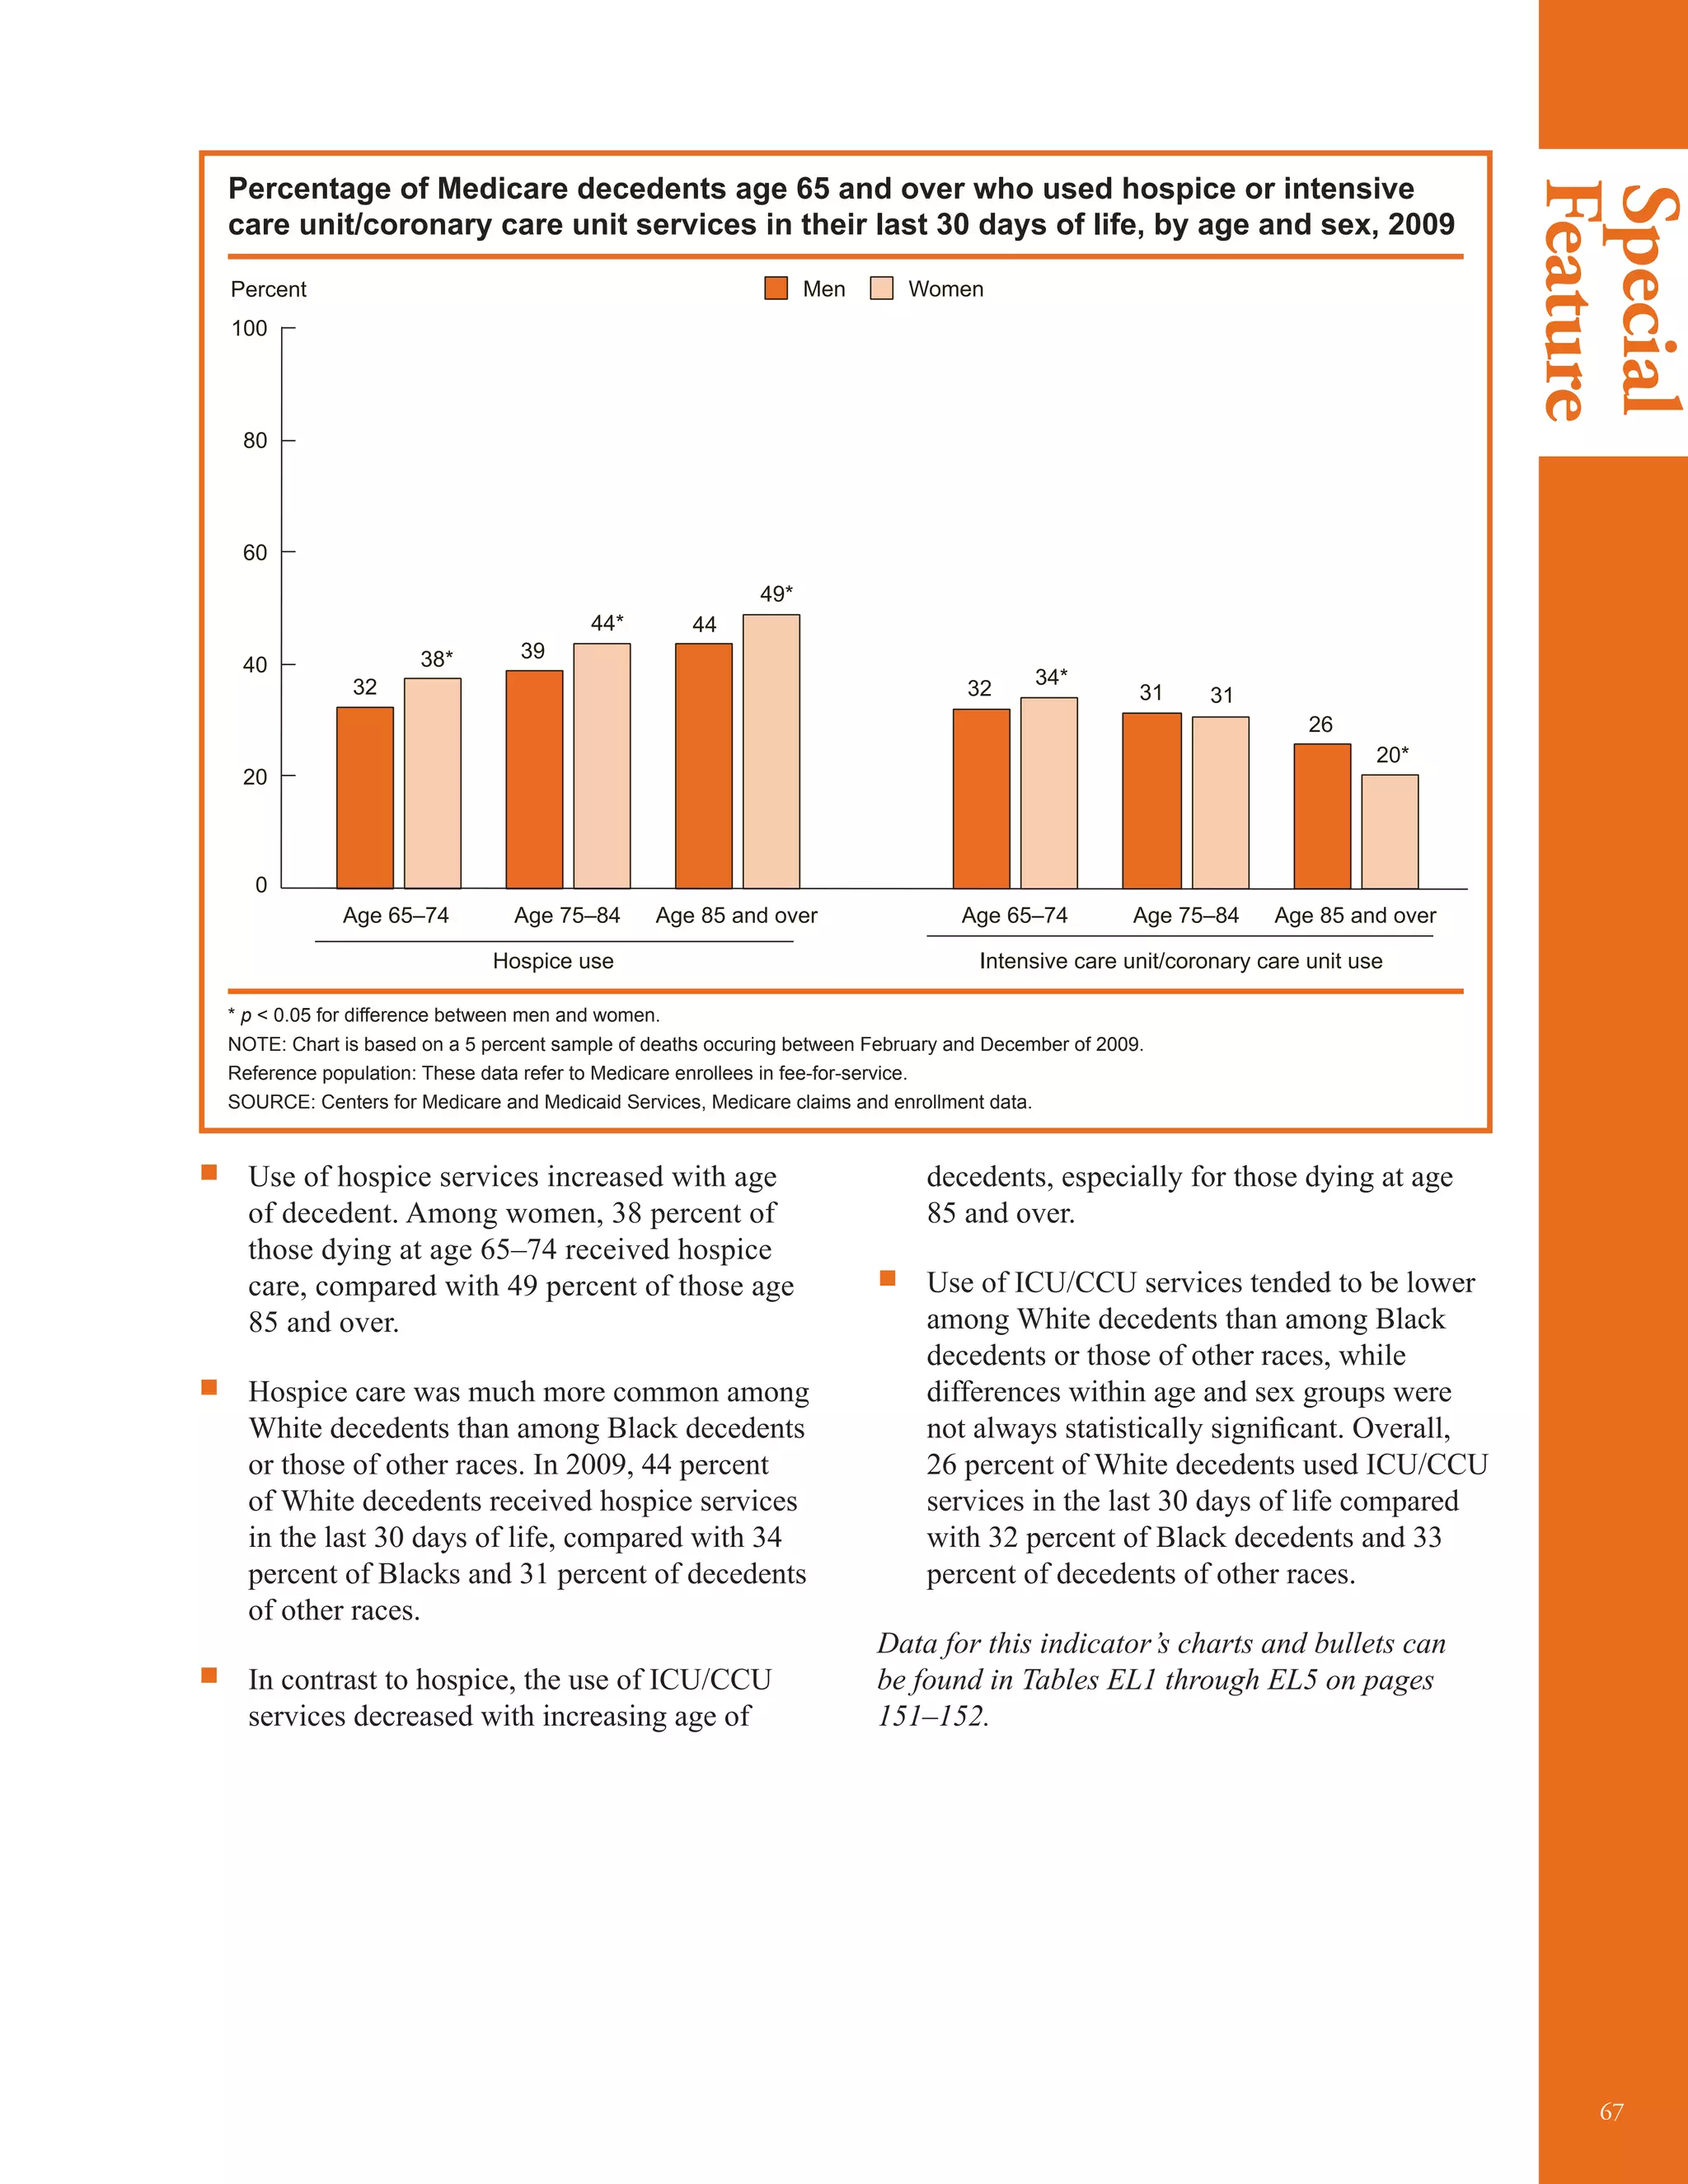
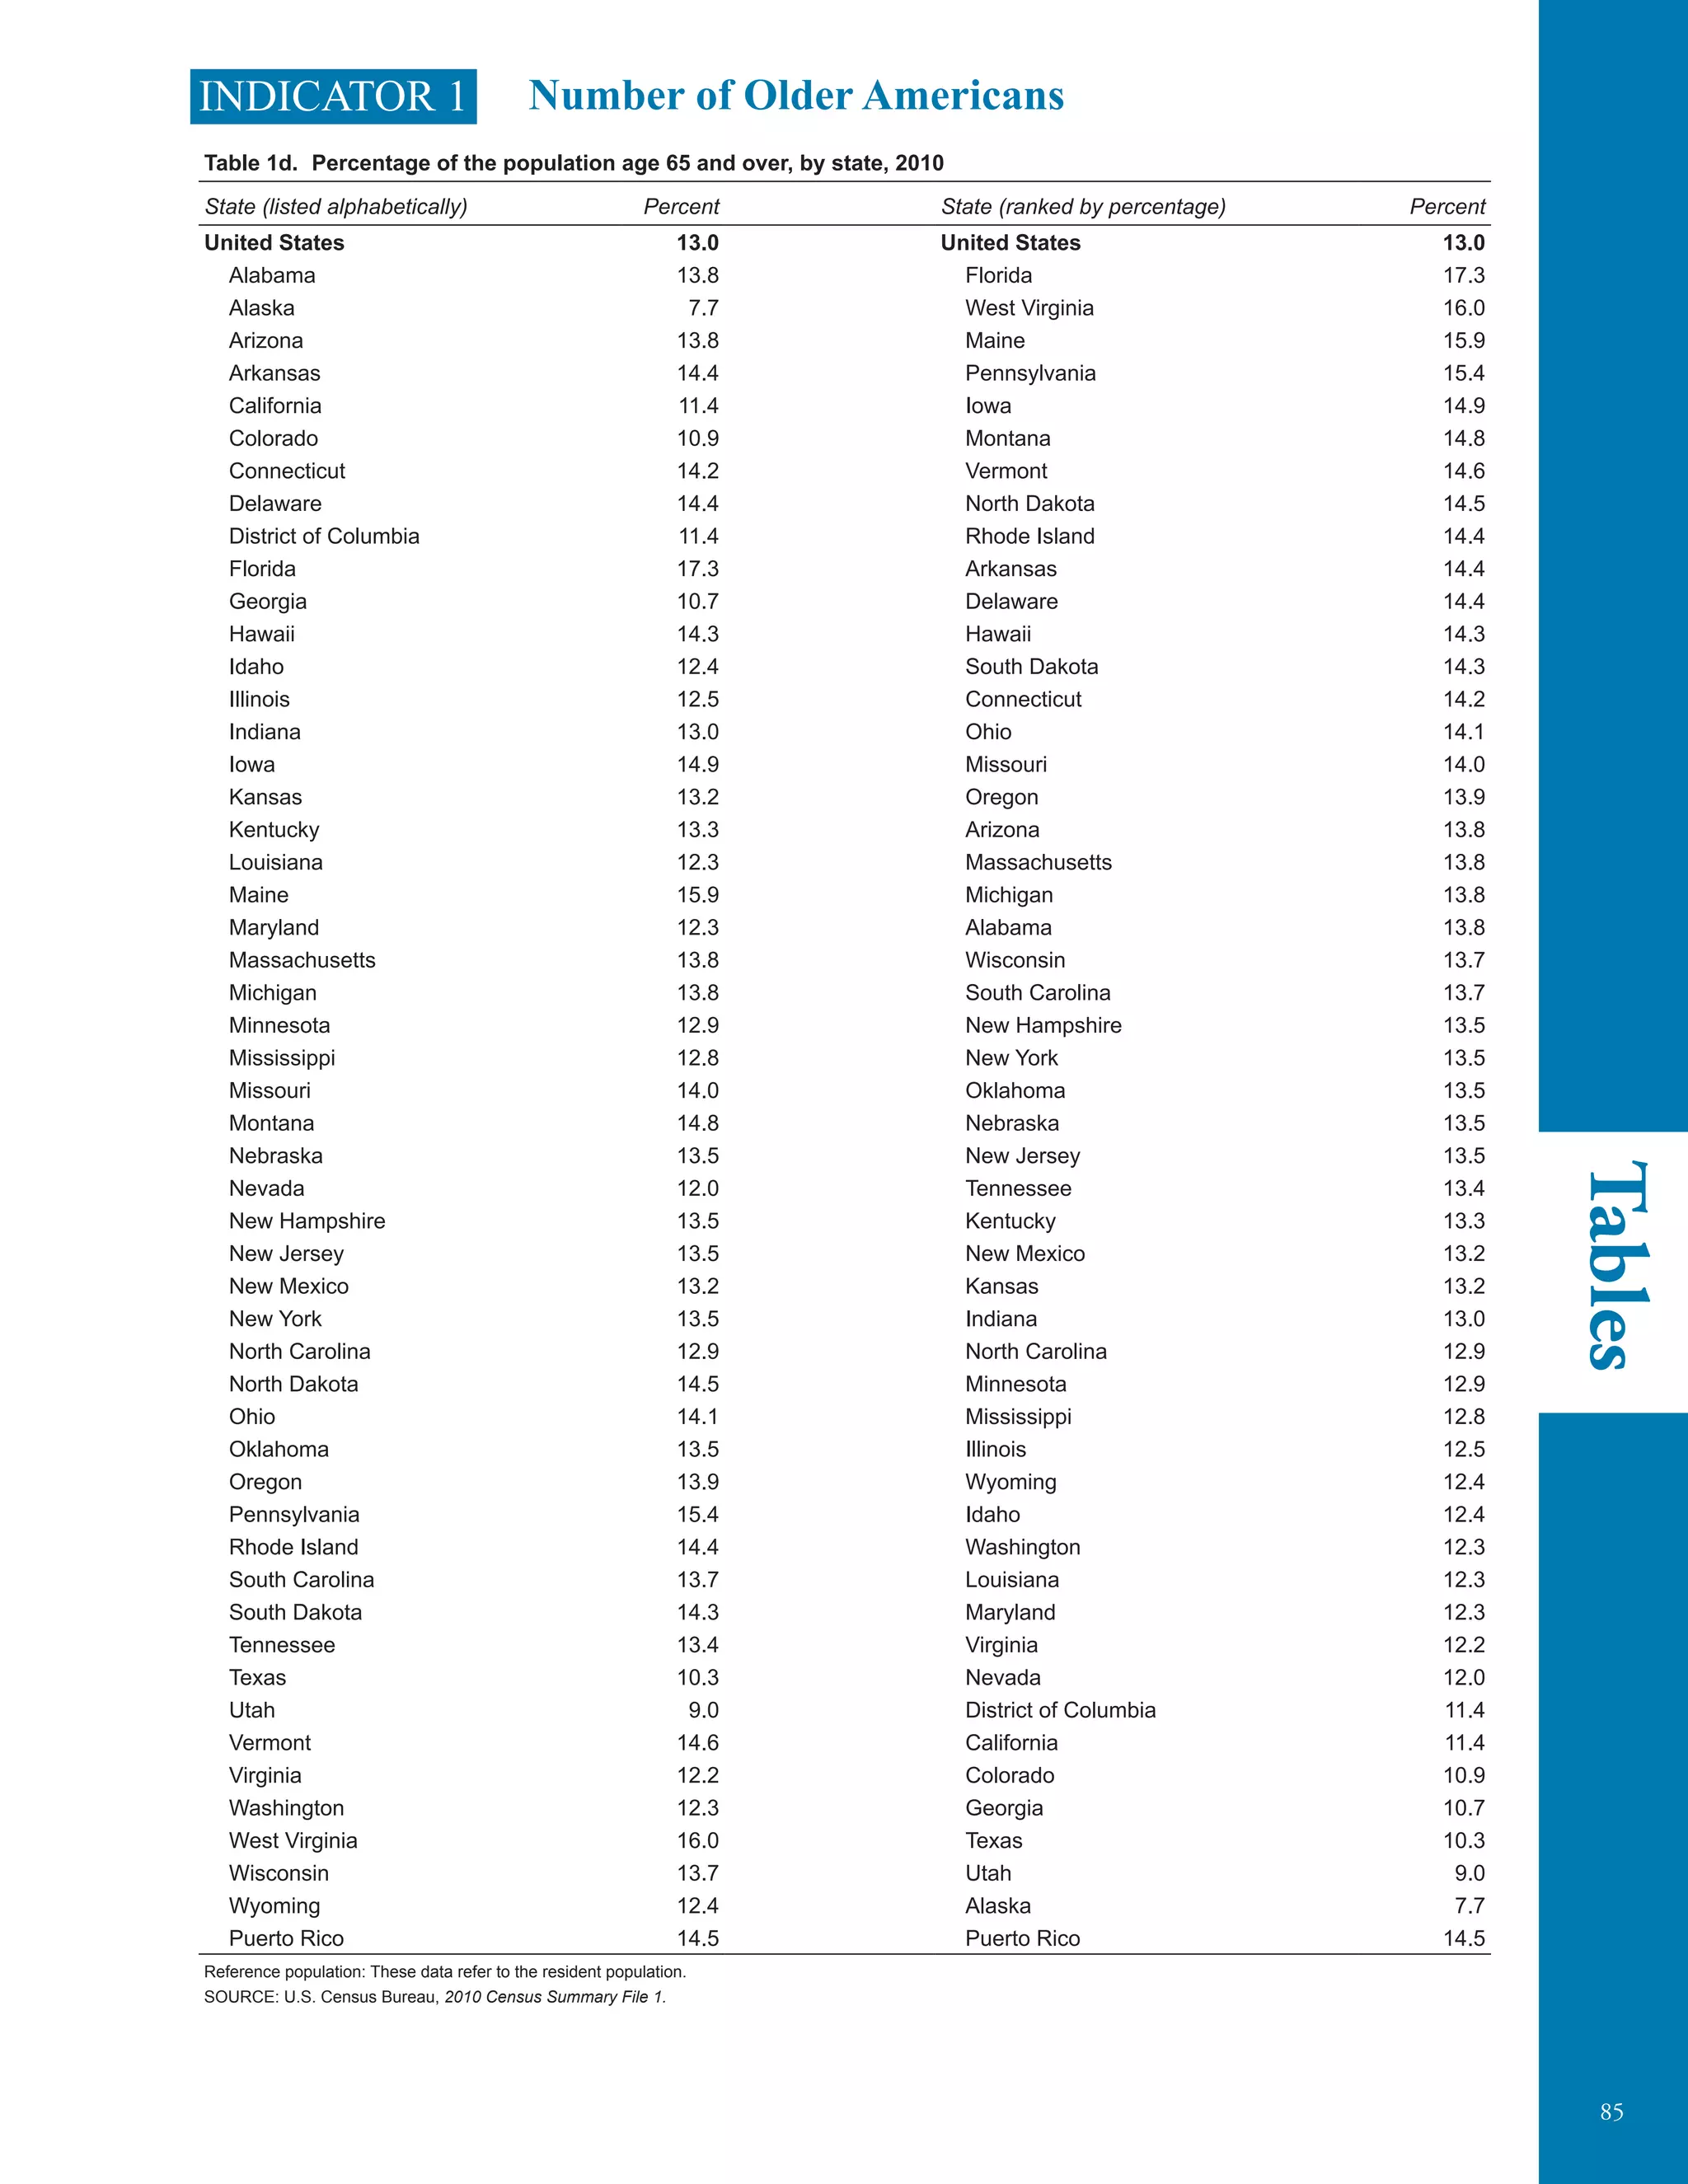
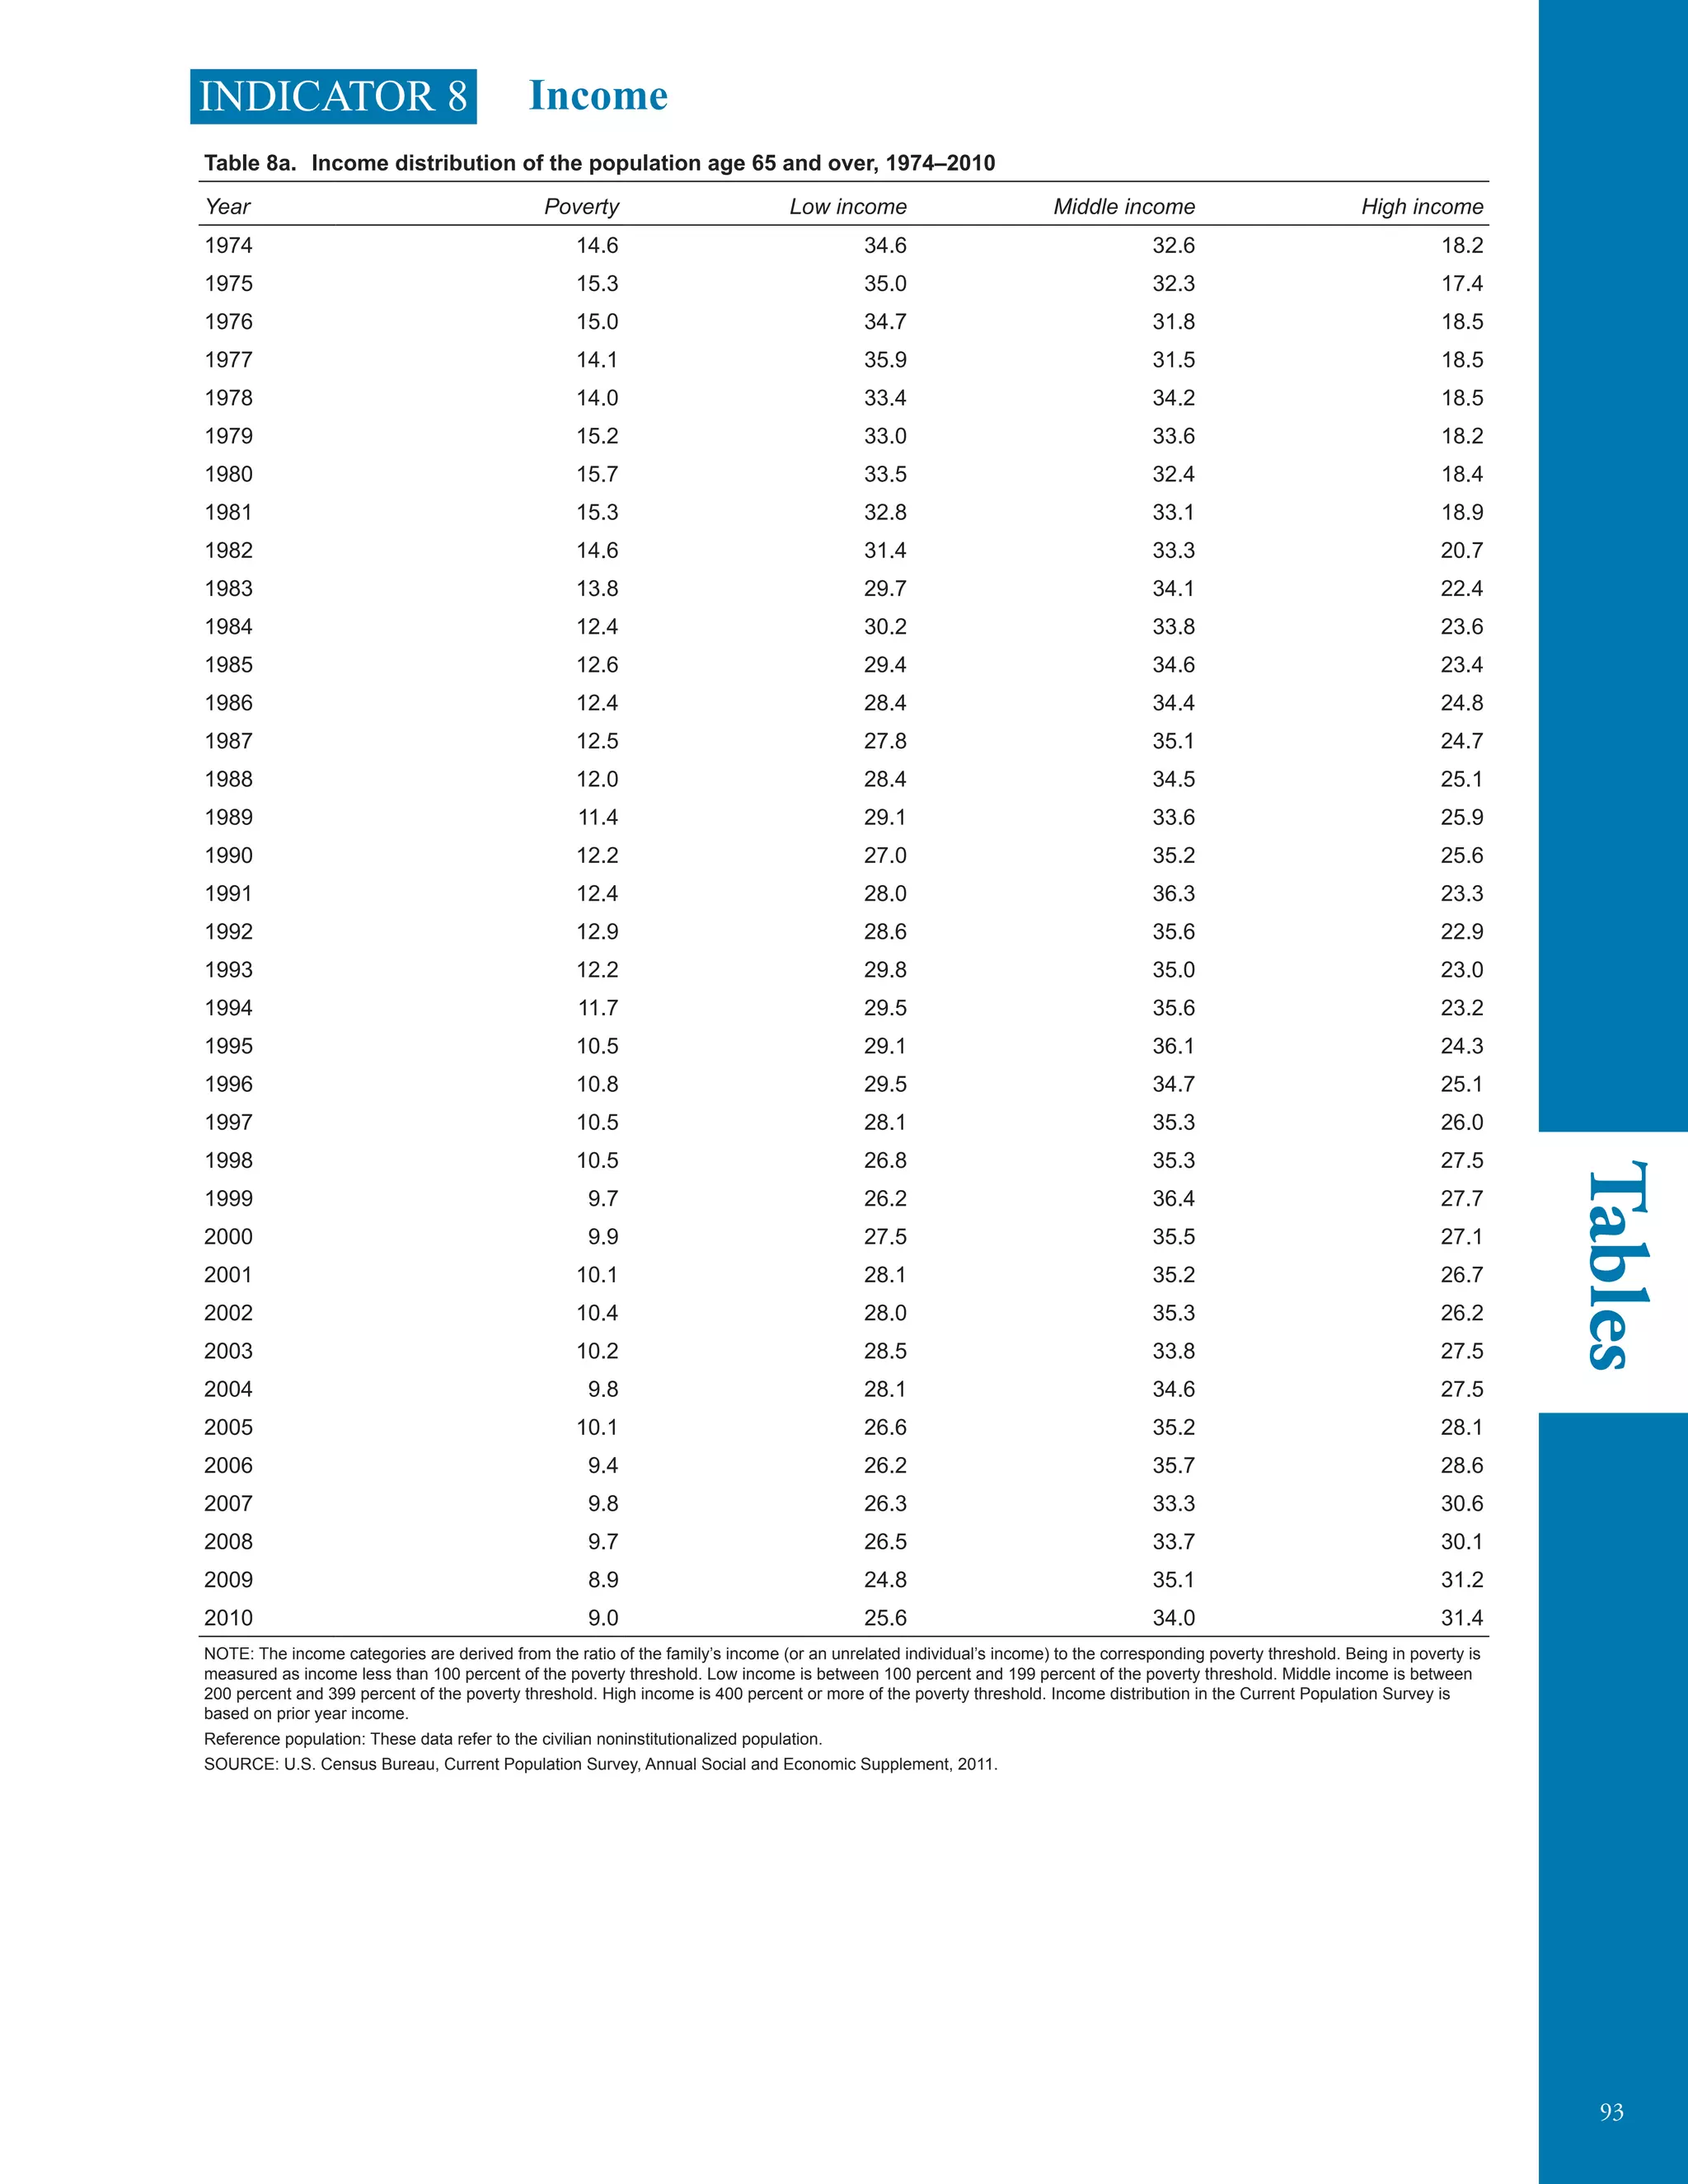
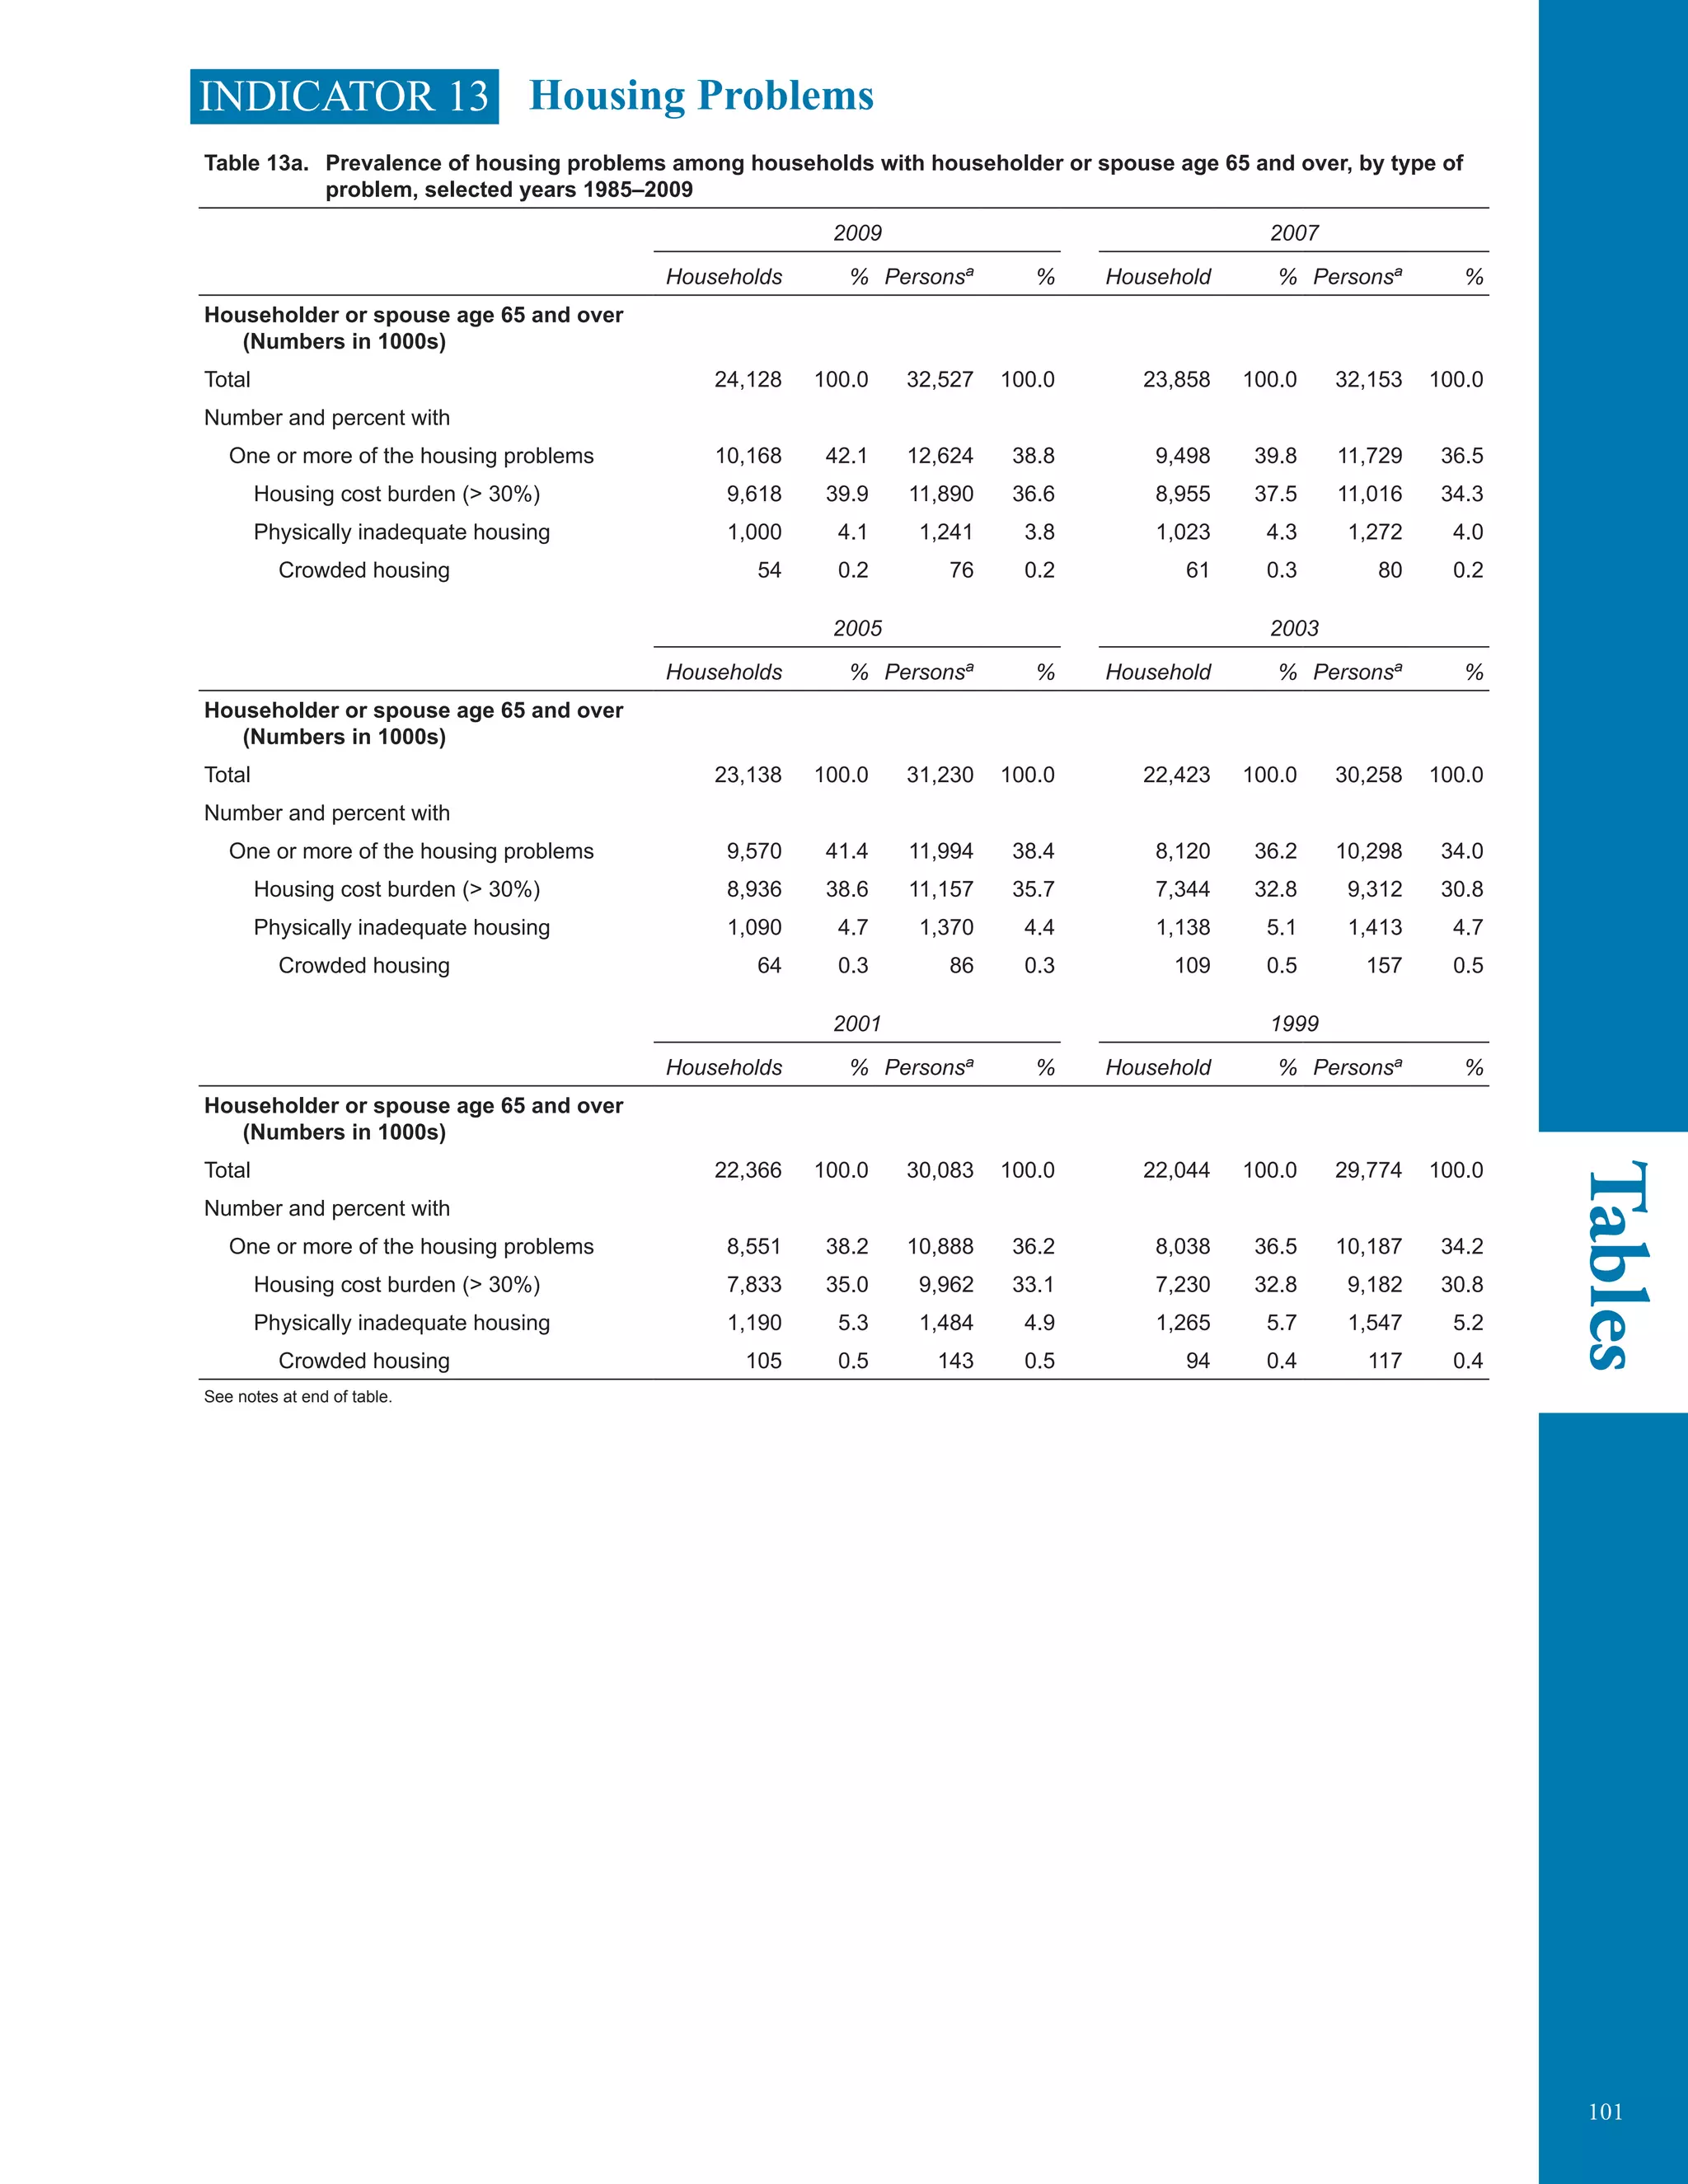
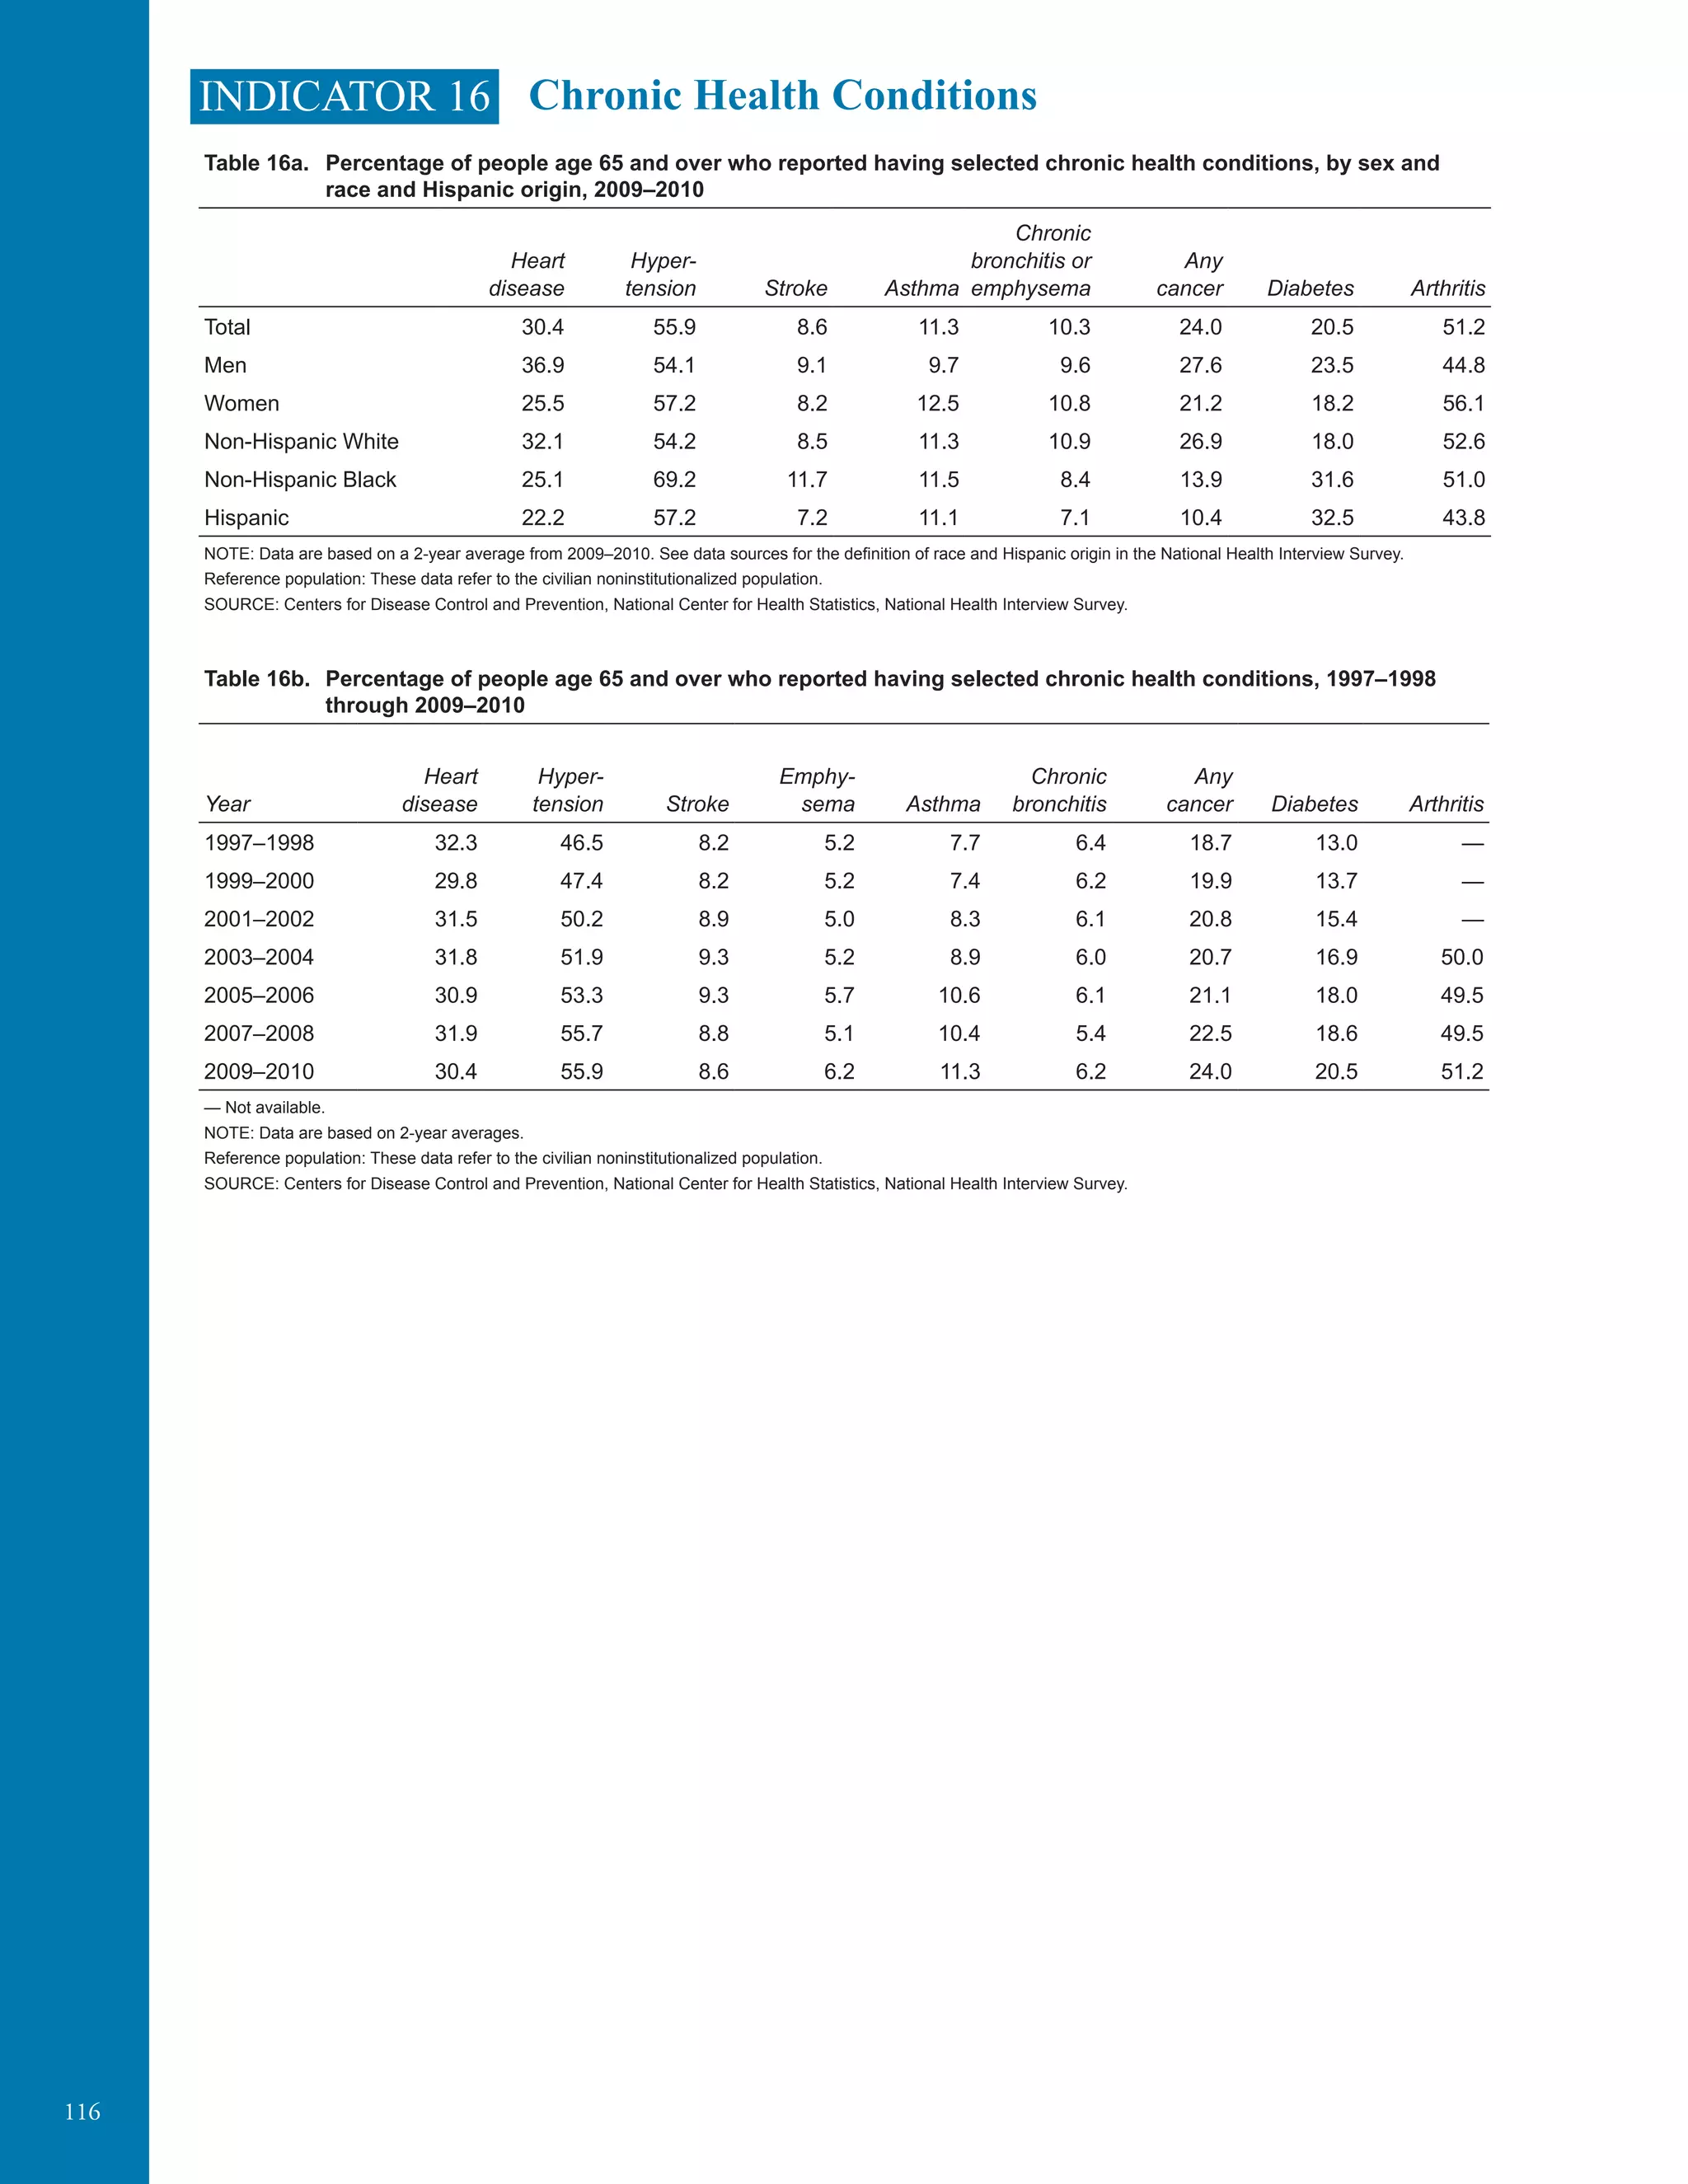
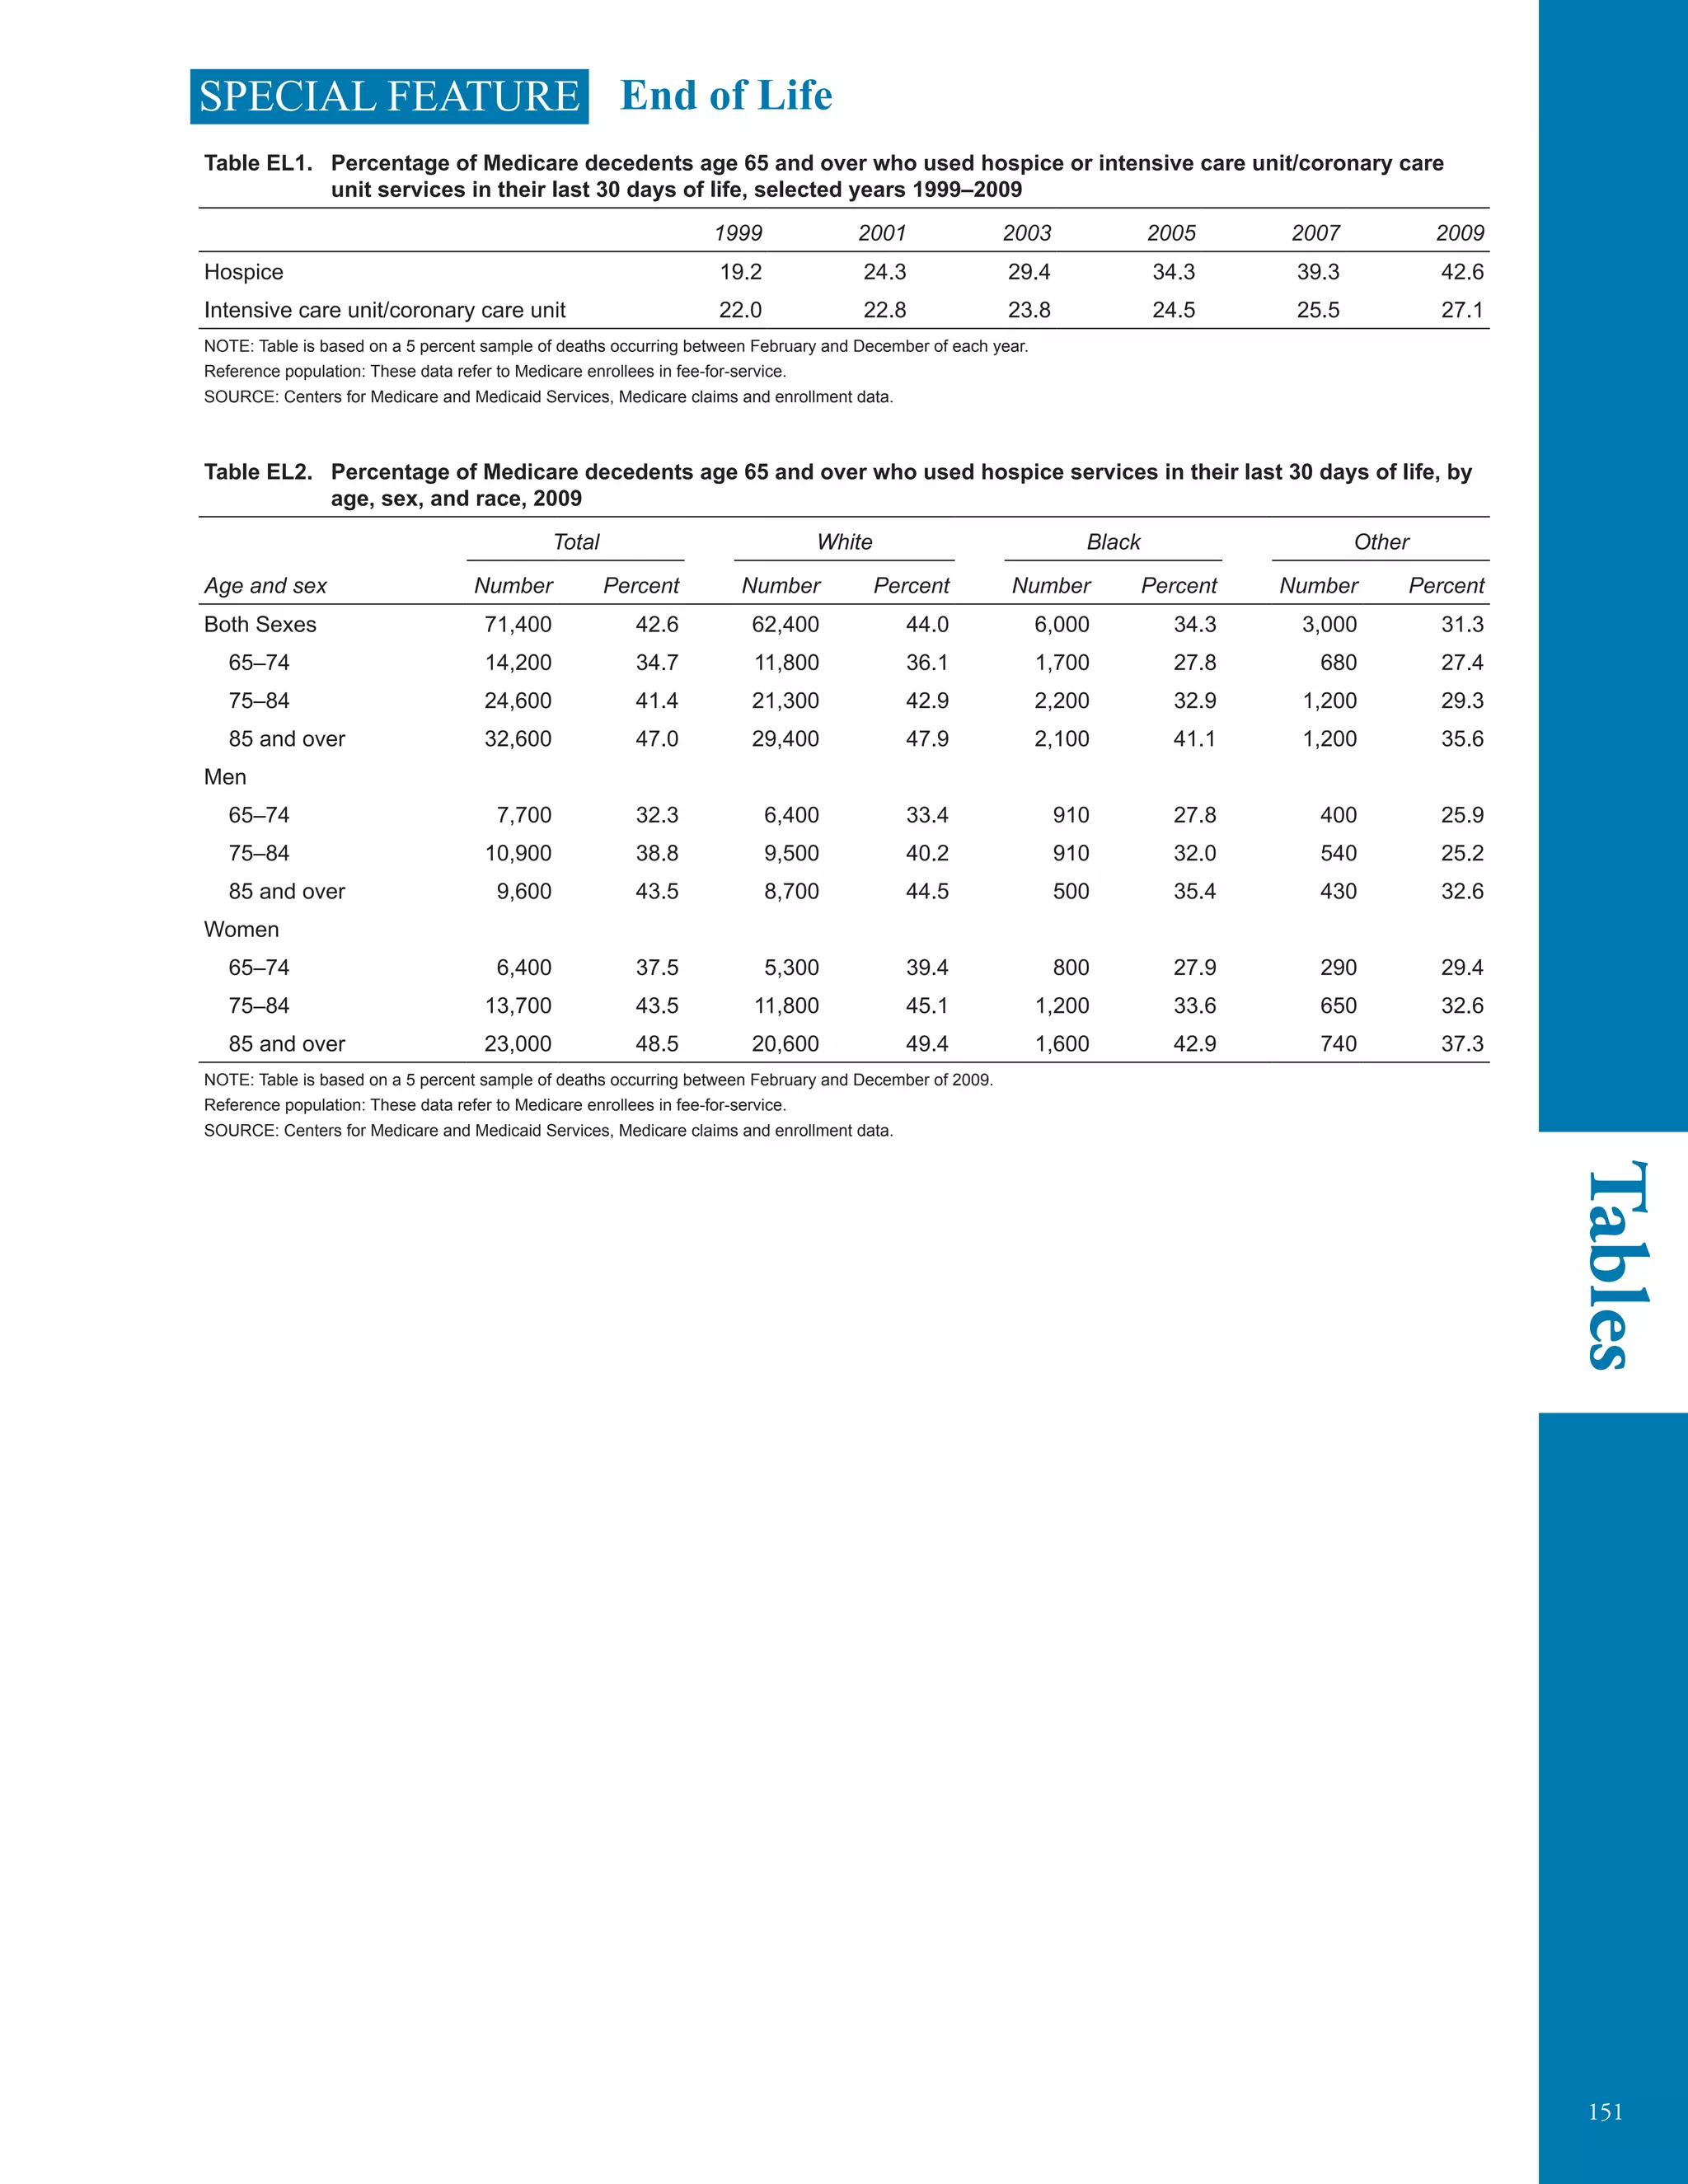
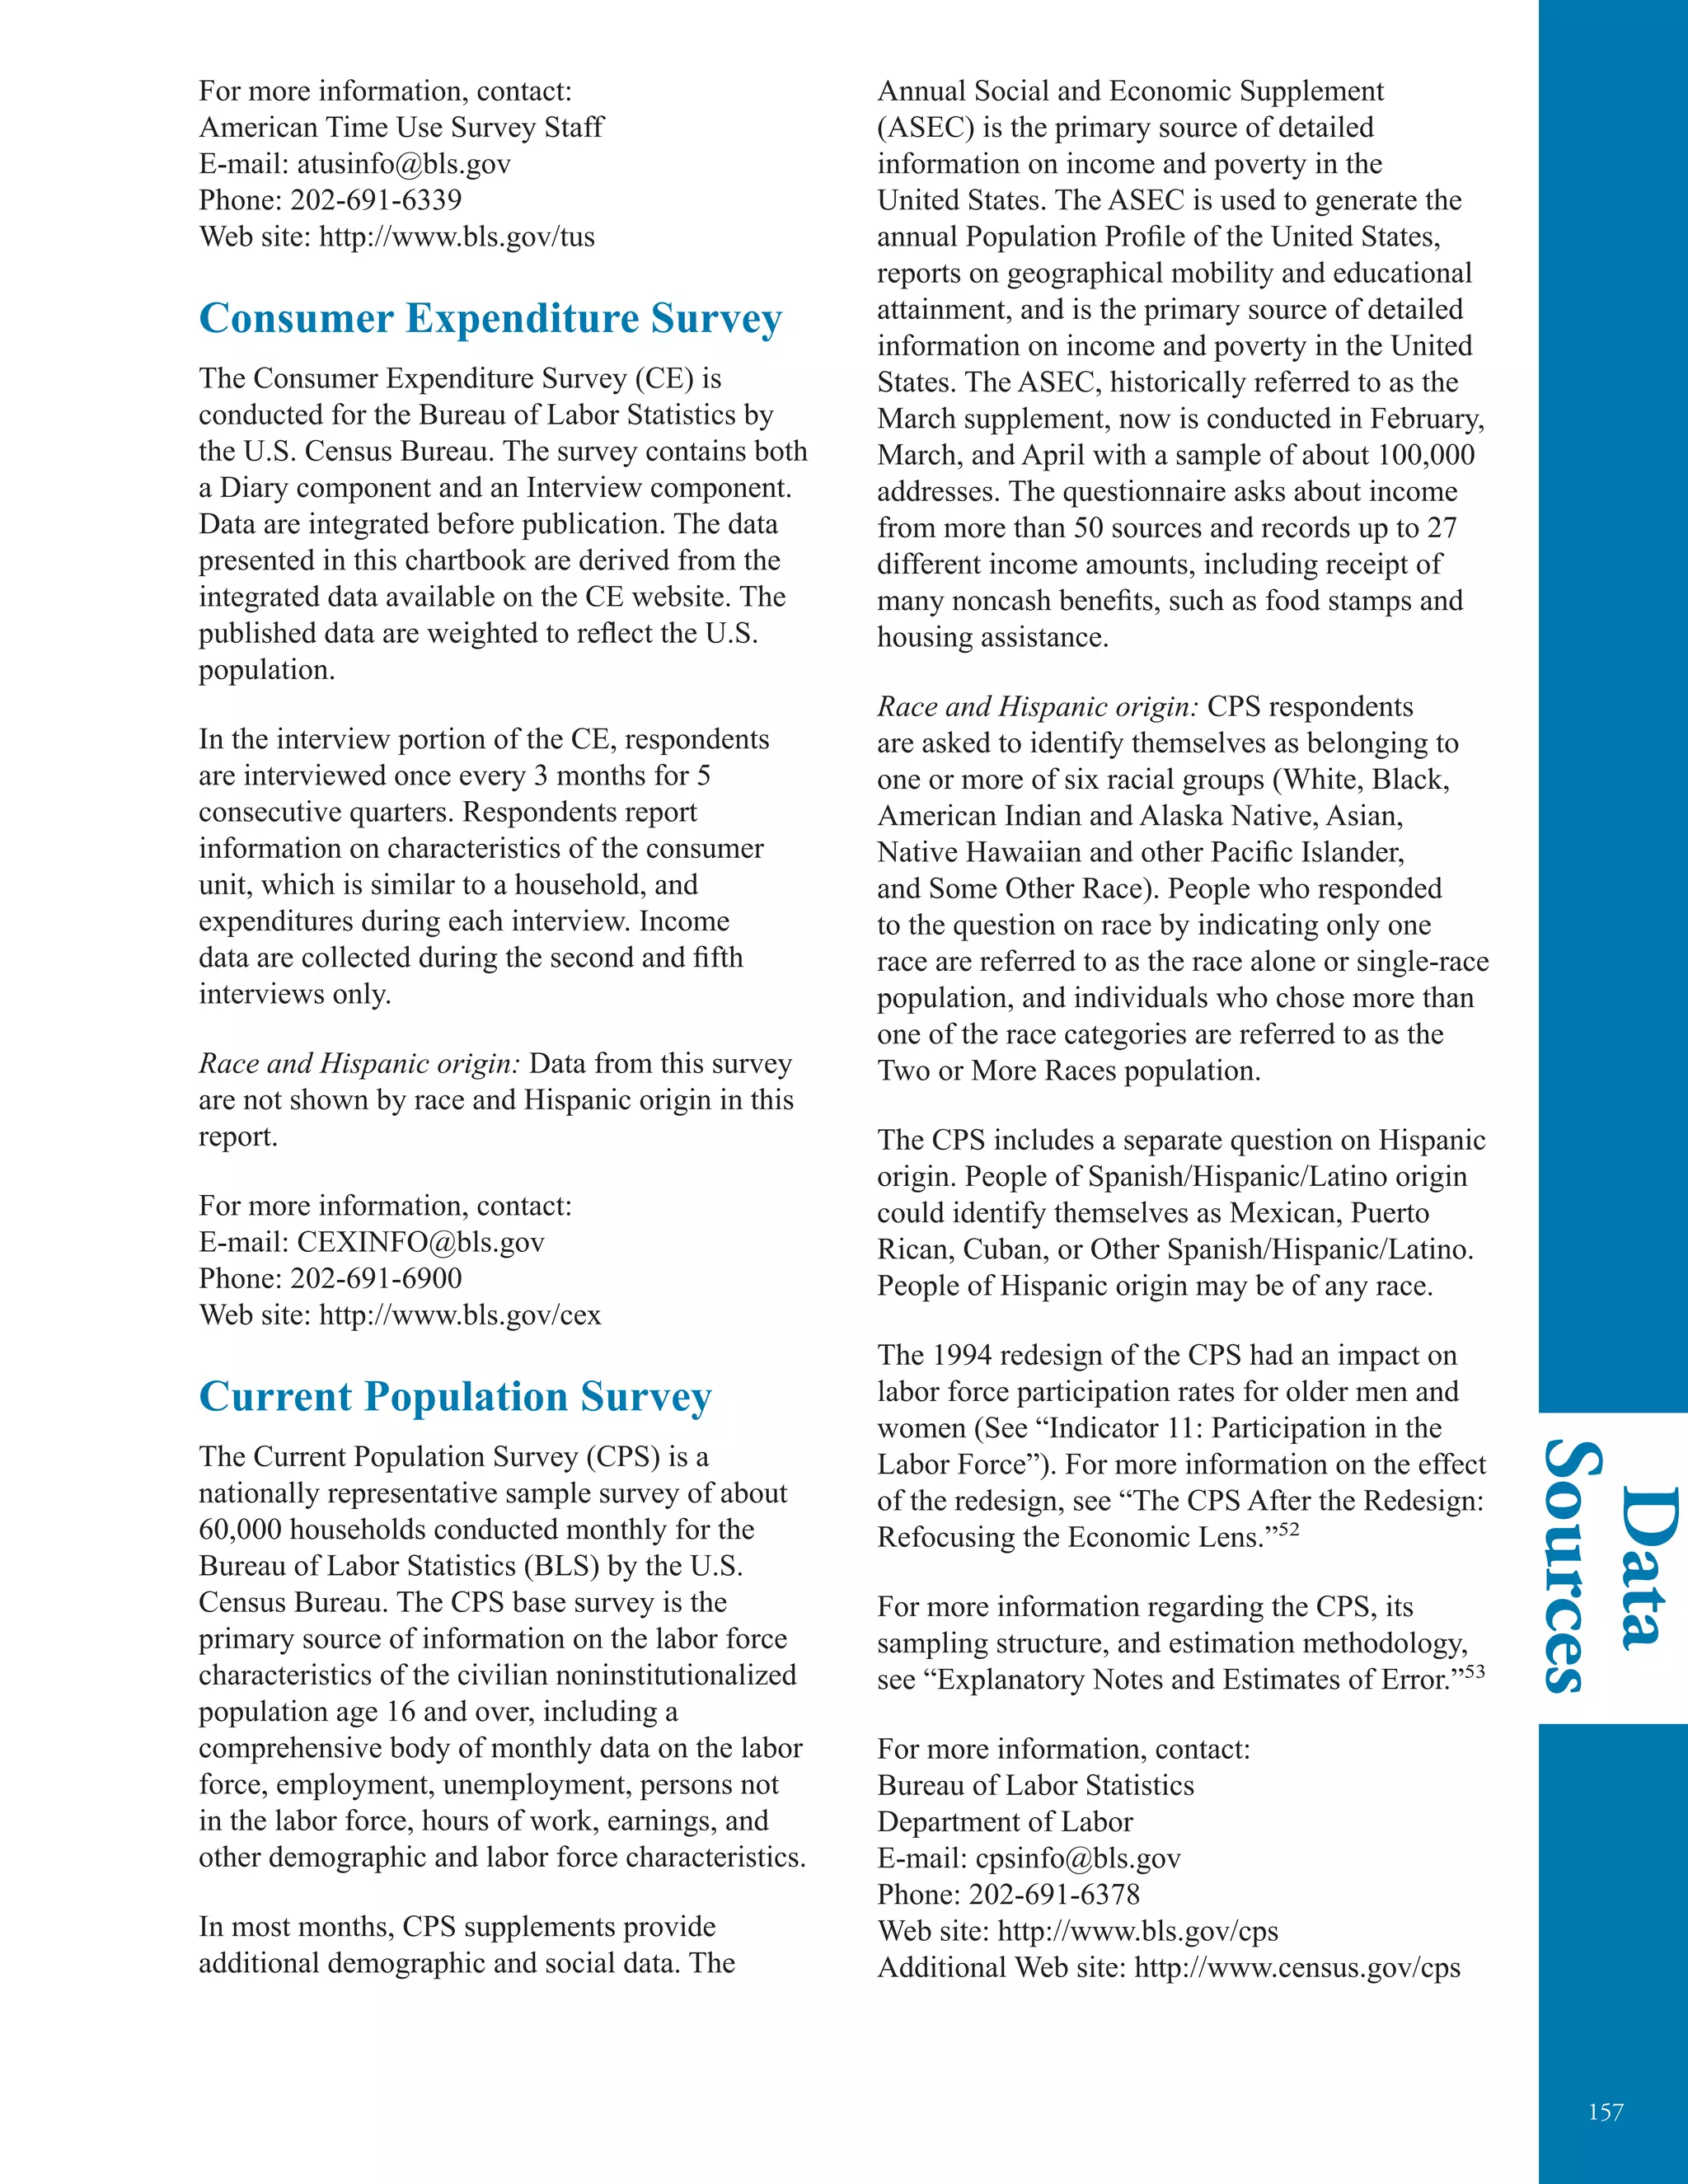
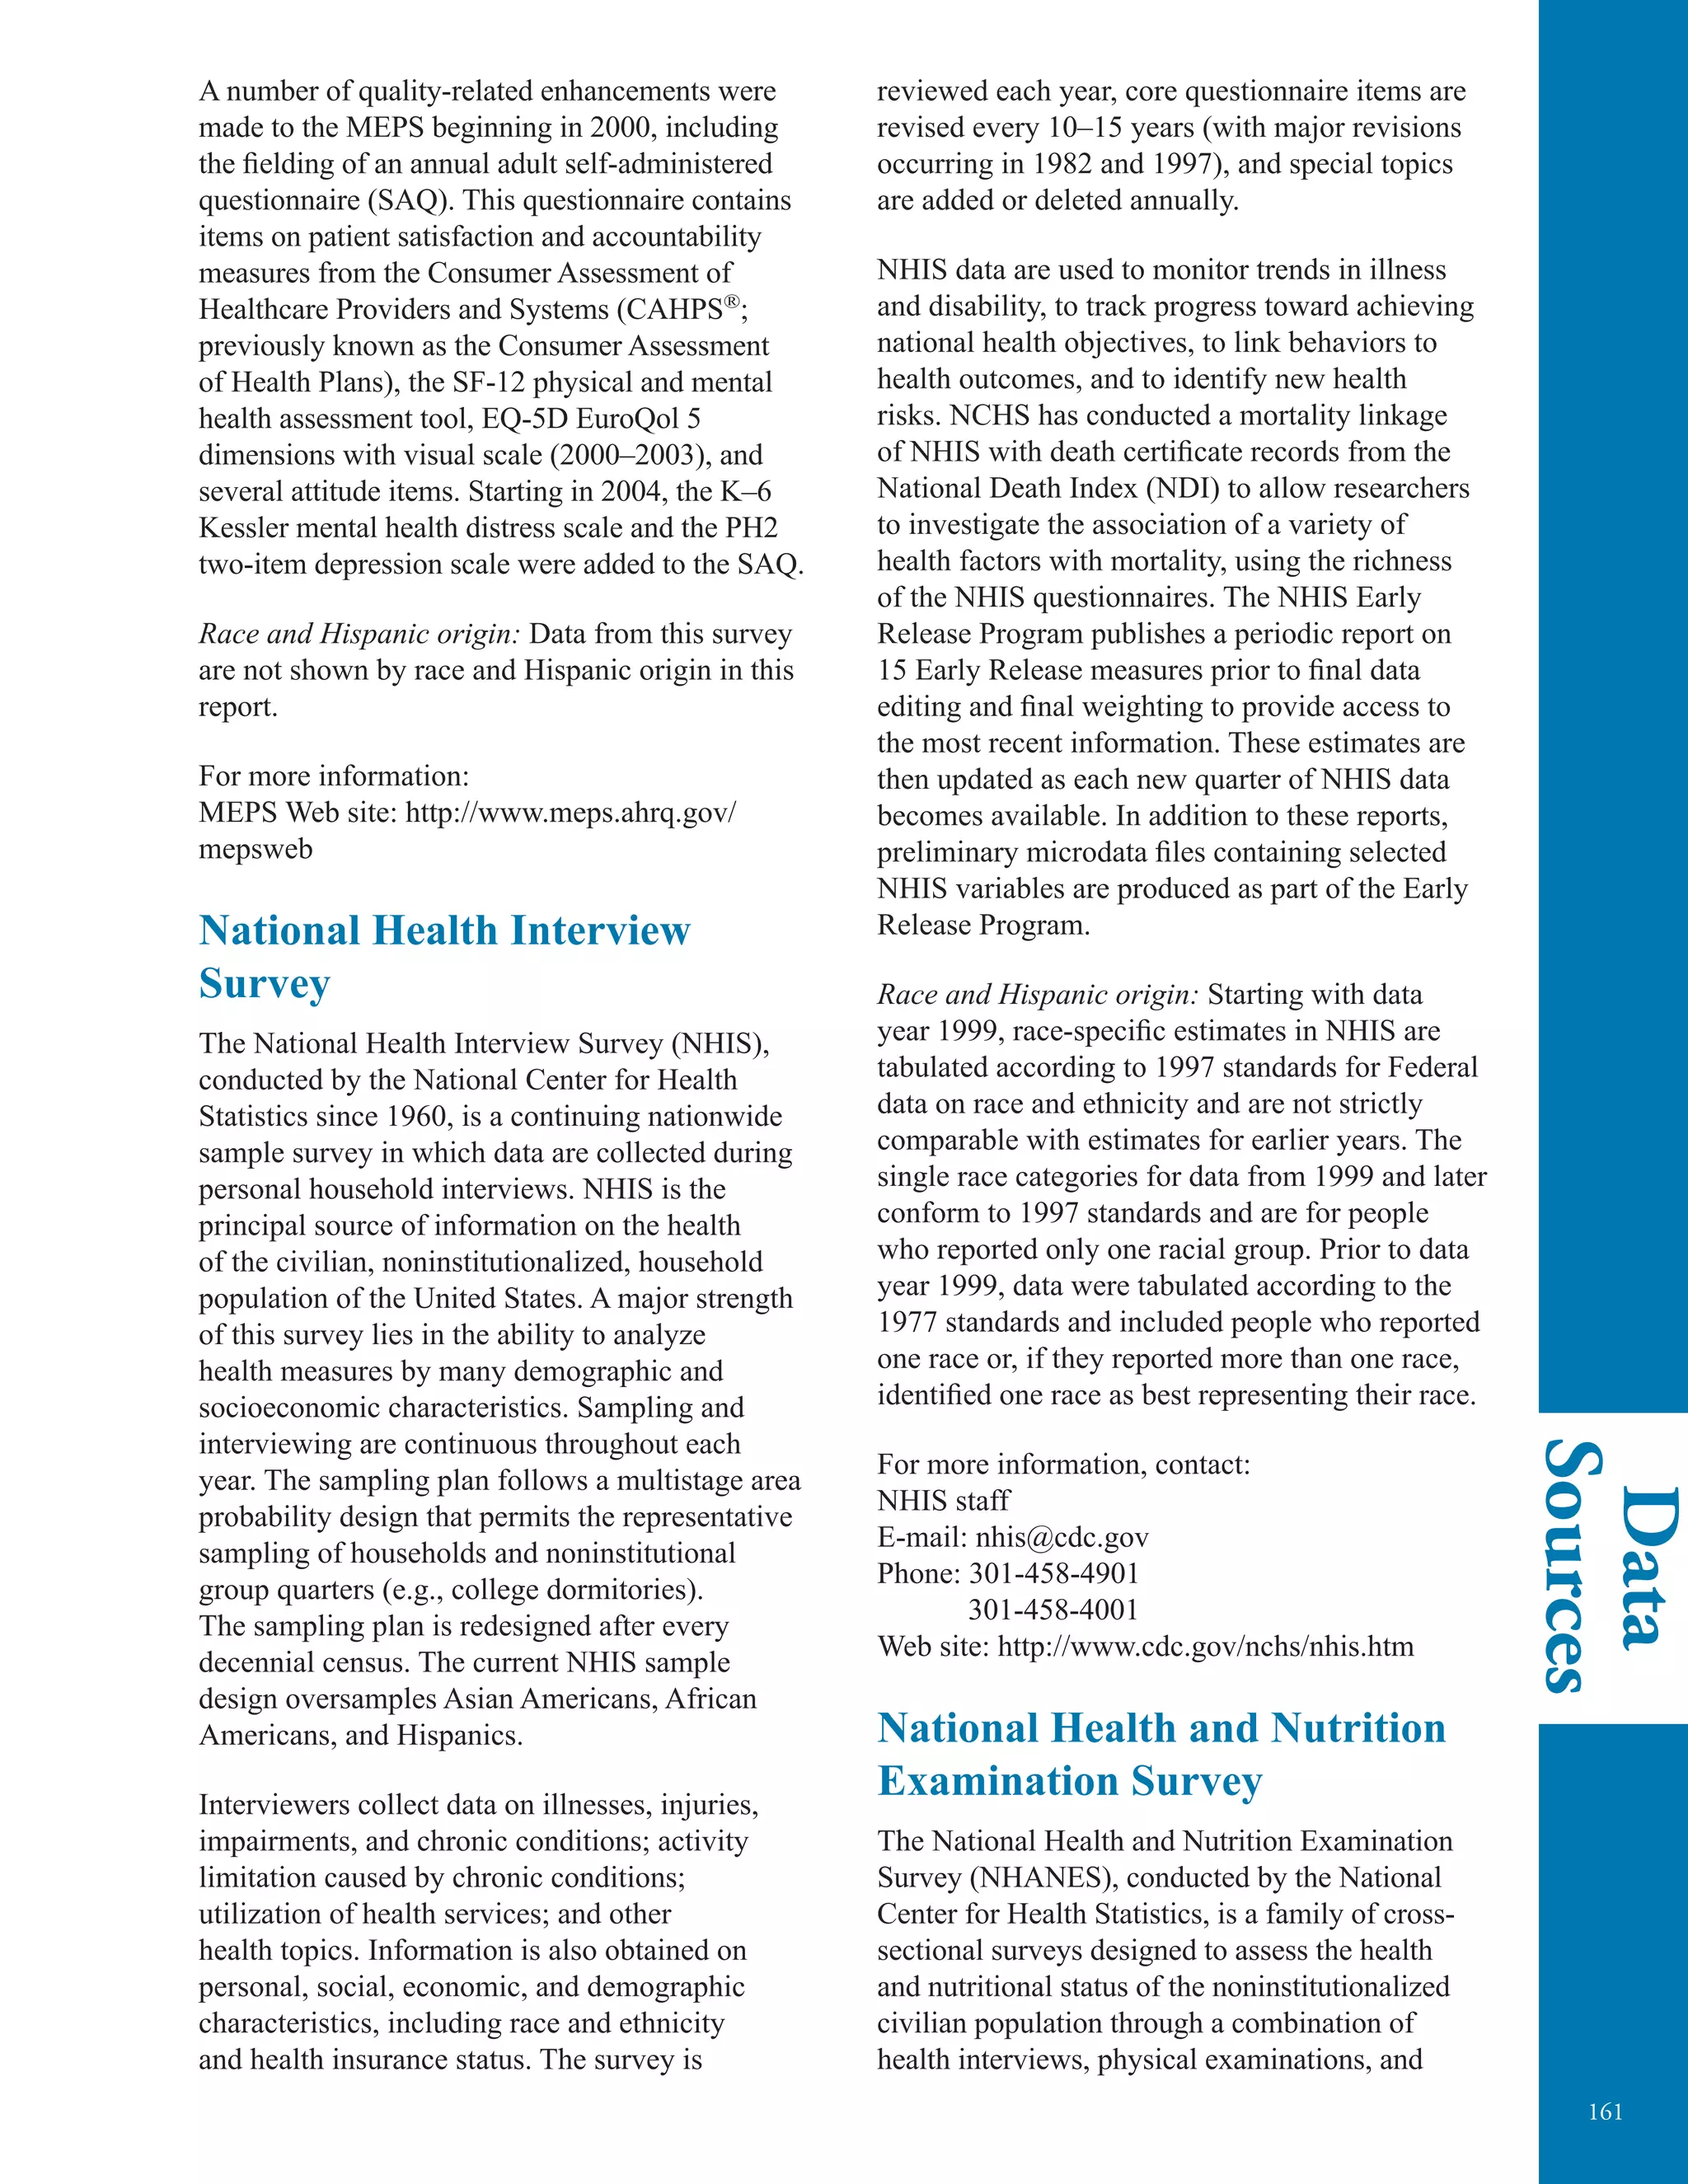
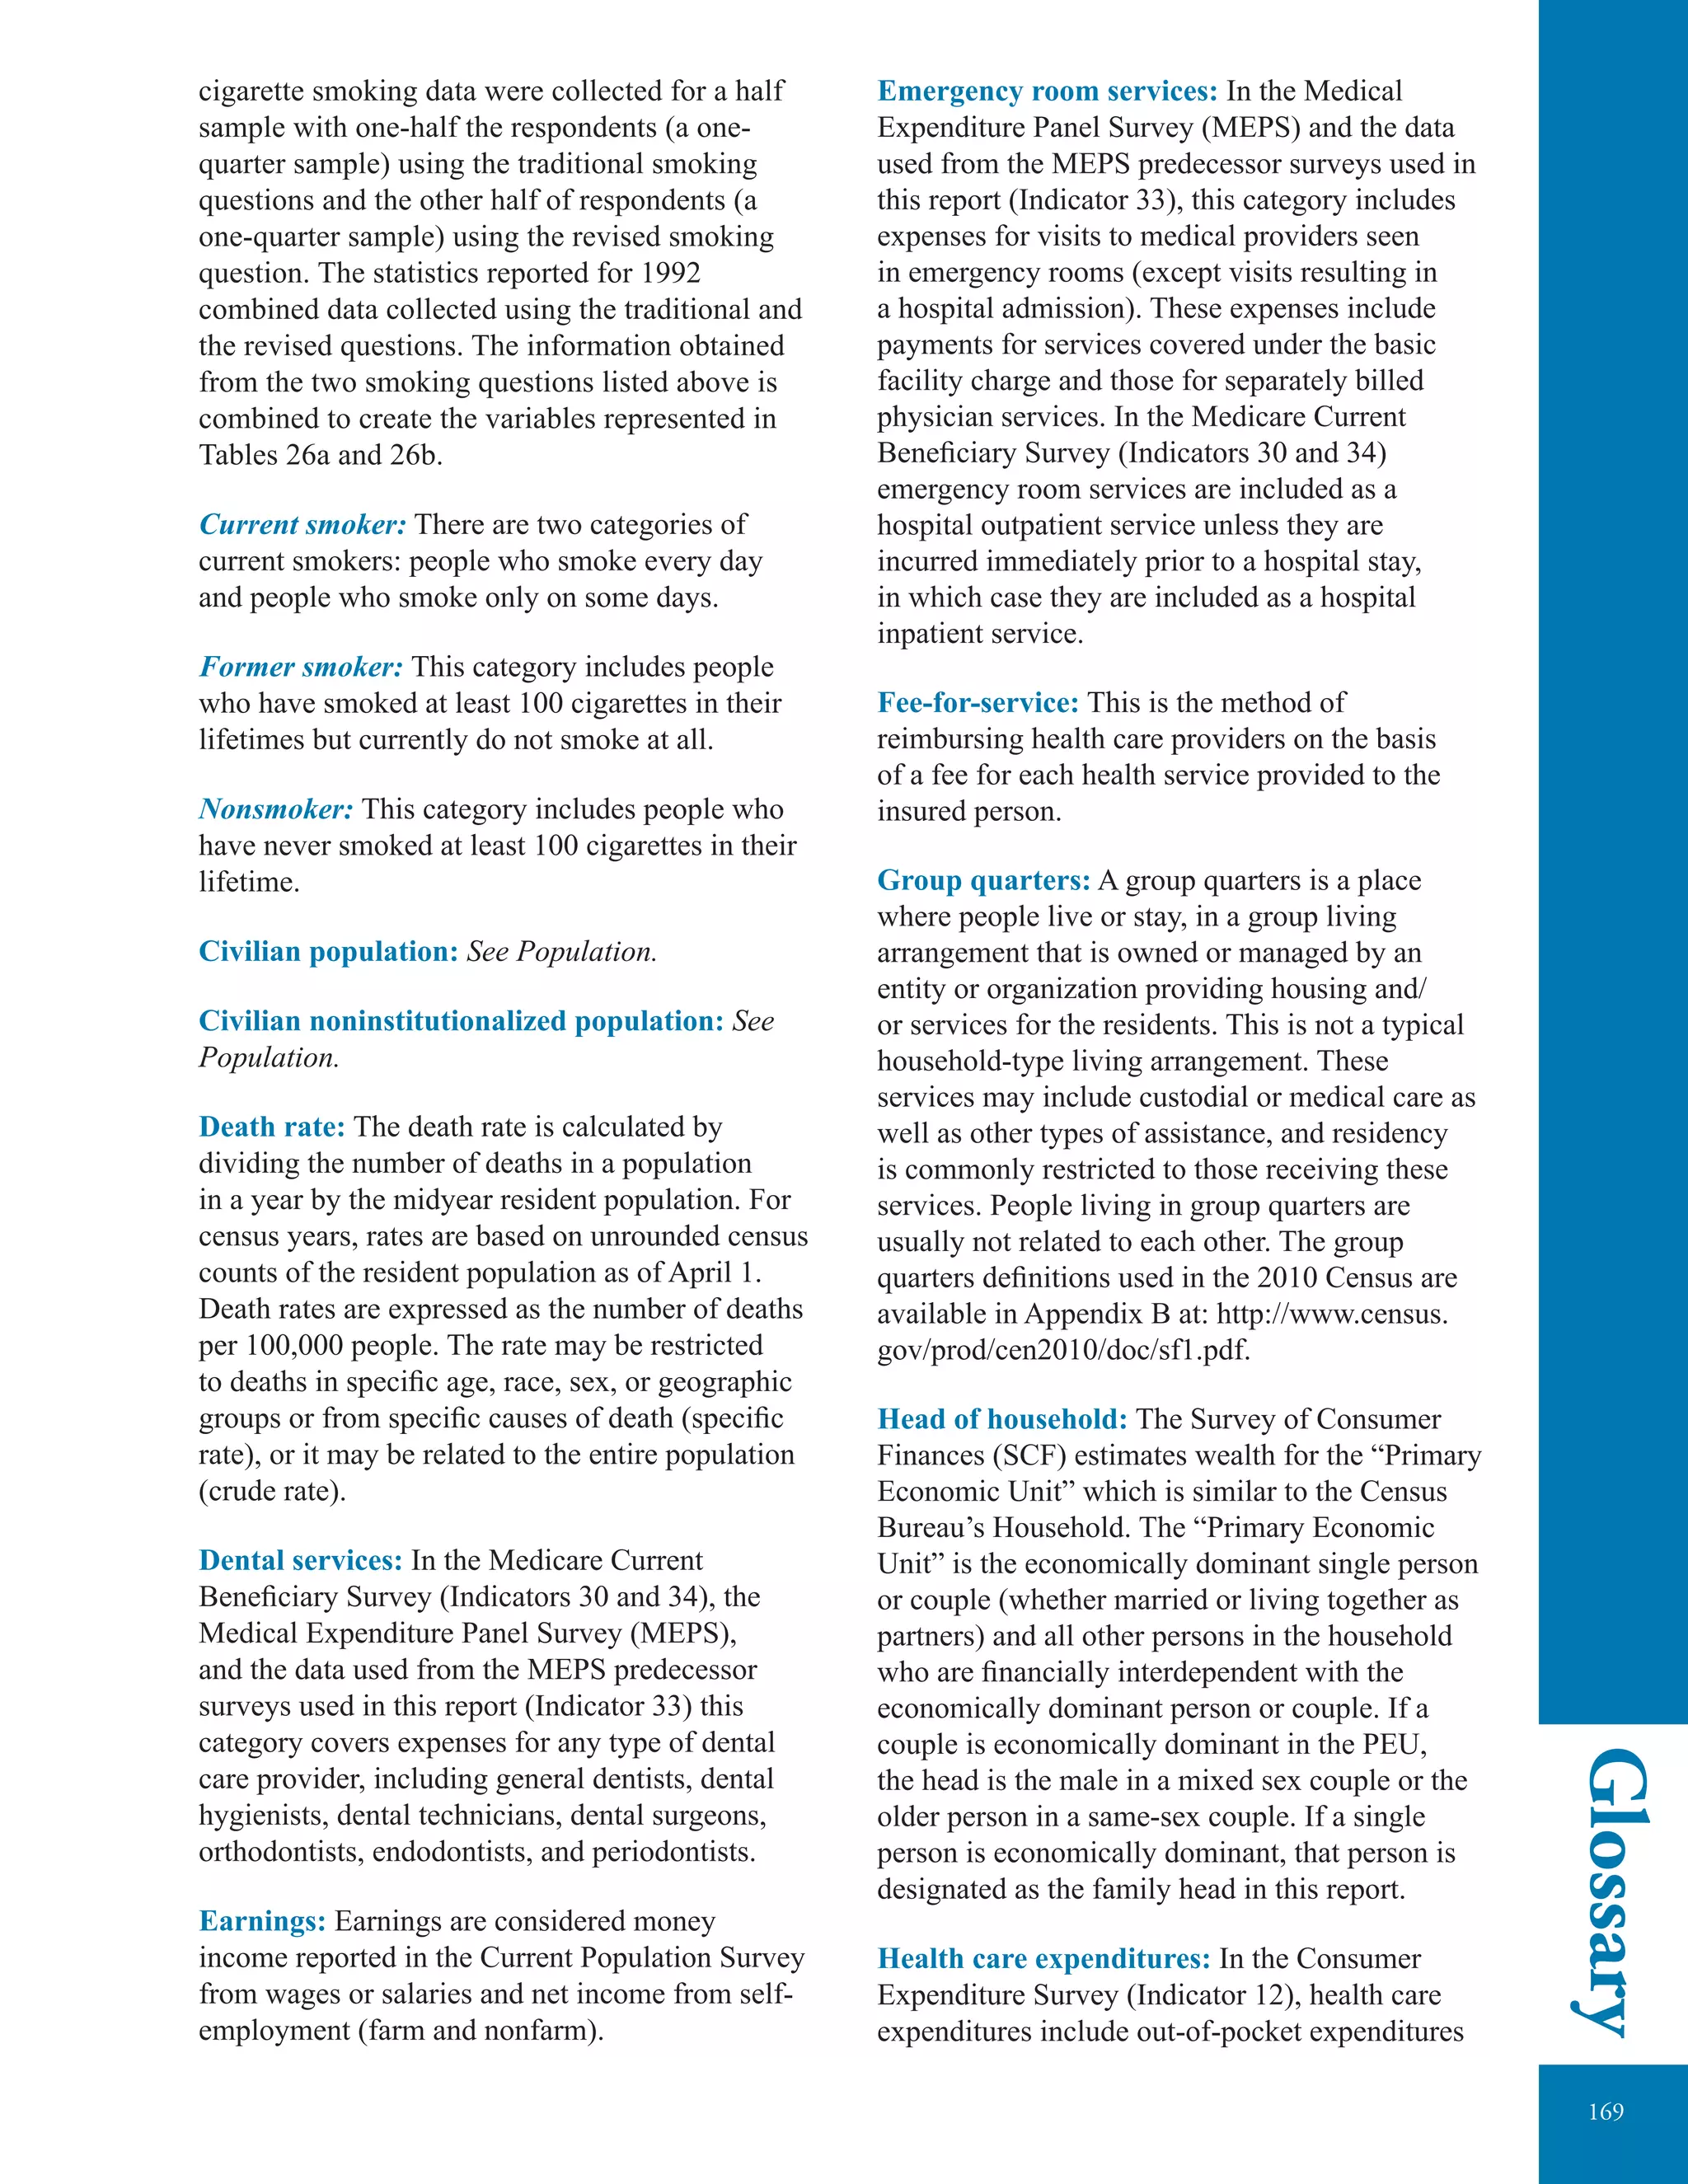
Percentage of Medicare decedents age 65 and over who used hospice or intensive
care unit/coronary care unit services in their last 30 days of life, for selected years
1999–2009
100
Percent
80
60
40
20
0
1999 2001
Hospice services
Intensive care unit/
coronary care unit services
2003 2005 2007 2009
NOTE: Chart is based on a 5 percent sample of deaths occurring between February and December of each year.
Reference population: These data refer to Medicare enrollees in fee-for-service.
SOURCE: Centers for Medicare and Medicaid Services, Medicare claims and enrollment data.
ƒƒ Both hospice and ICU/CCU use are common
in the last month of life. In 2009, 43 percent
of elderly decedents used hospice services in
the last 30 days of life, and 27 percent used
ICU/CCU services.
ƒƒ Use of hospice has increased substantially in
recent years, from 19 percent of decedents in
1999 to 43 percent in 2009. Use of ICU/CCU
services has grown more slowly, from 22
percent in 1999 to 27 percent in 2009.
ƒƒ The primary diagnoses associated with
hospice care have changed over time.
Neoplasms accounted for 53 percent
of hospice stays in 1999 and only 32
percent in 2009. The next most common
primary diagnoses in 2009 were diseases
of the circulatory system (19 percent) and
symptoms, signs, and ill-defined conditions
(17 percent).
ƒƒ In 2009, length of stay in hospice varied
considerably, with 34 percent lasting 7 days
or less and 18 percent lasting more than 90
days. The percent of stays lasting more than
90 days increased from 13 percent in 1999
to 18 percent in 2009.](https://image.slidesharecdn.com/keyindicatorsofwellbeingolderamericans-150117160834-conversion-gate01/75/Global-Medical-Cures-Older-Americans-Key-Indicators-of-Well-Being-86-2048.jpg)


![175
Glossary
Indicator 22: Mammography: Below poverty is
defined as having income less than 100 percent
of the poverty threshold. Above poverty is
grouped into 3 categories: (1) income between
100 percent and 199 percent of the poverty
threshold (2) income between 200 percent and
399 percent of the poverty threshold and (3)
income equal to or greater than 400 percent of the
poverty threshold.
Indicator 32: Sources of Health Insurance:
Below poverty is defined as having income
less than 100 percent of the poverty threshold.
Above poverty is grouped into two categories: (1)
income between 100 percent and 199 percent of
the poverty threshold and (2) income equal to or
greater than 200 percent of the poverty threshold.
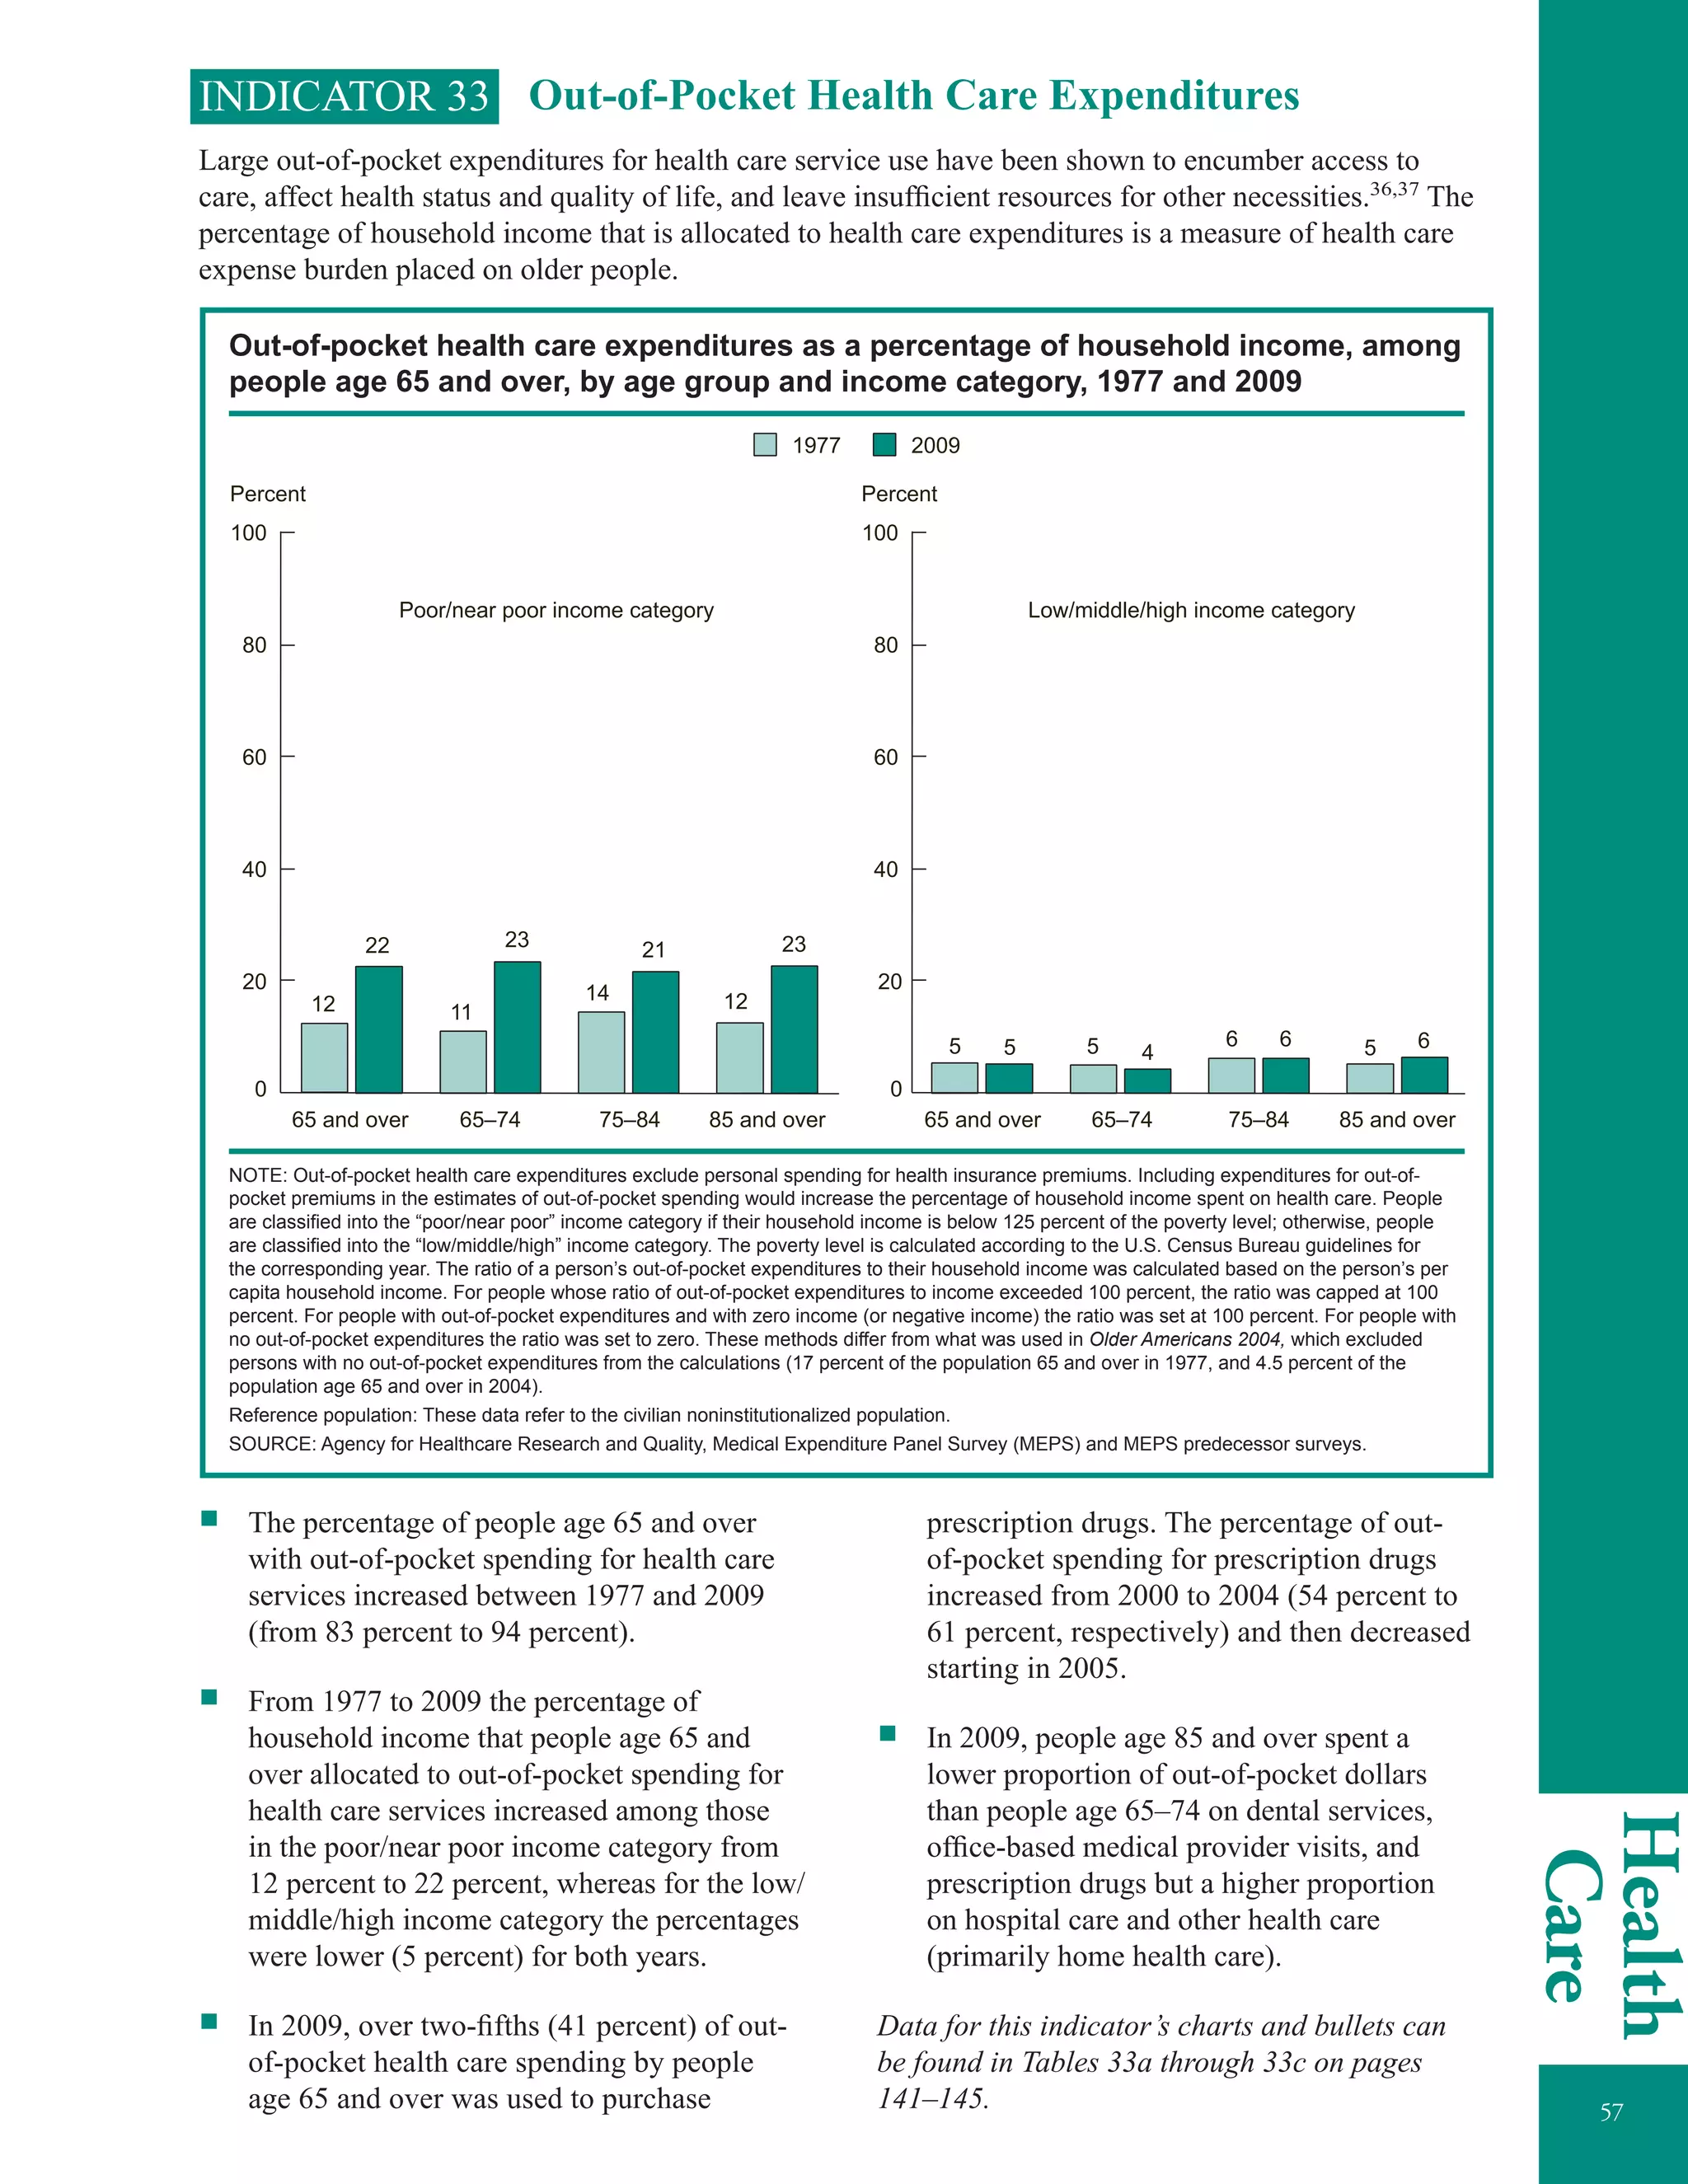
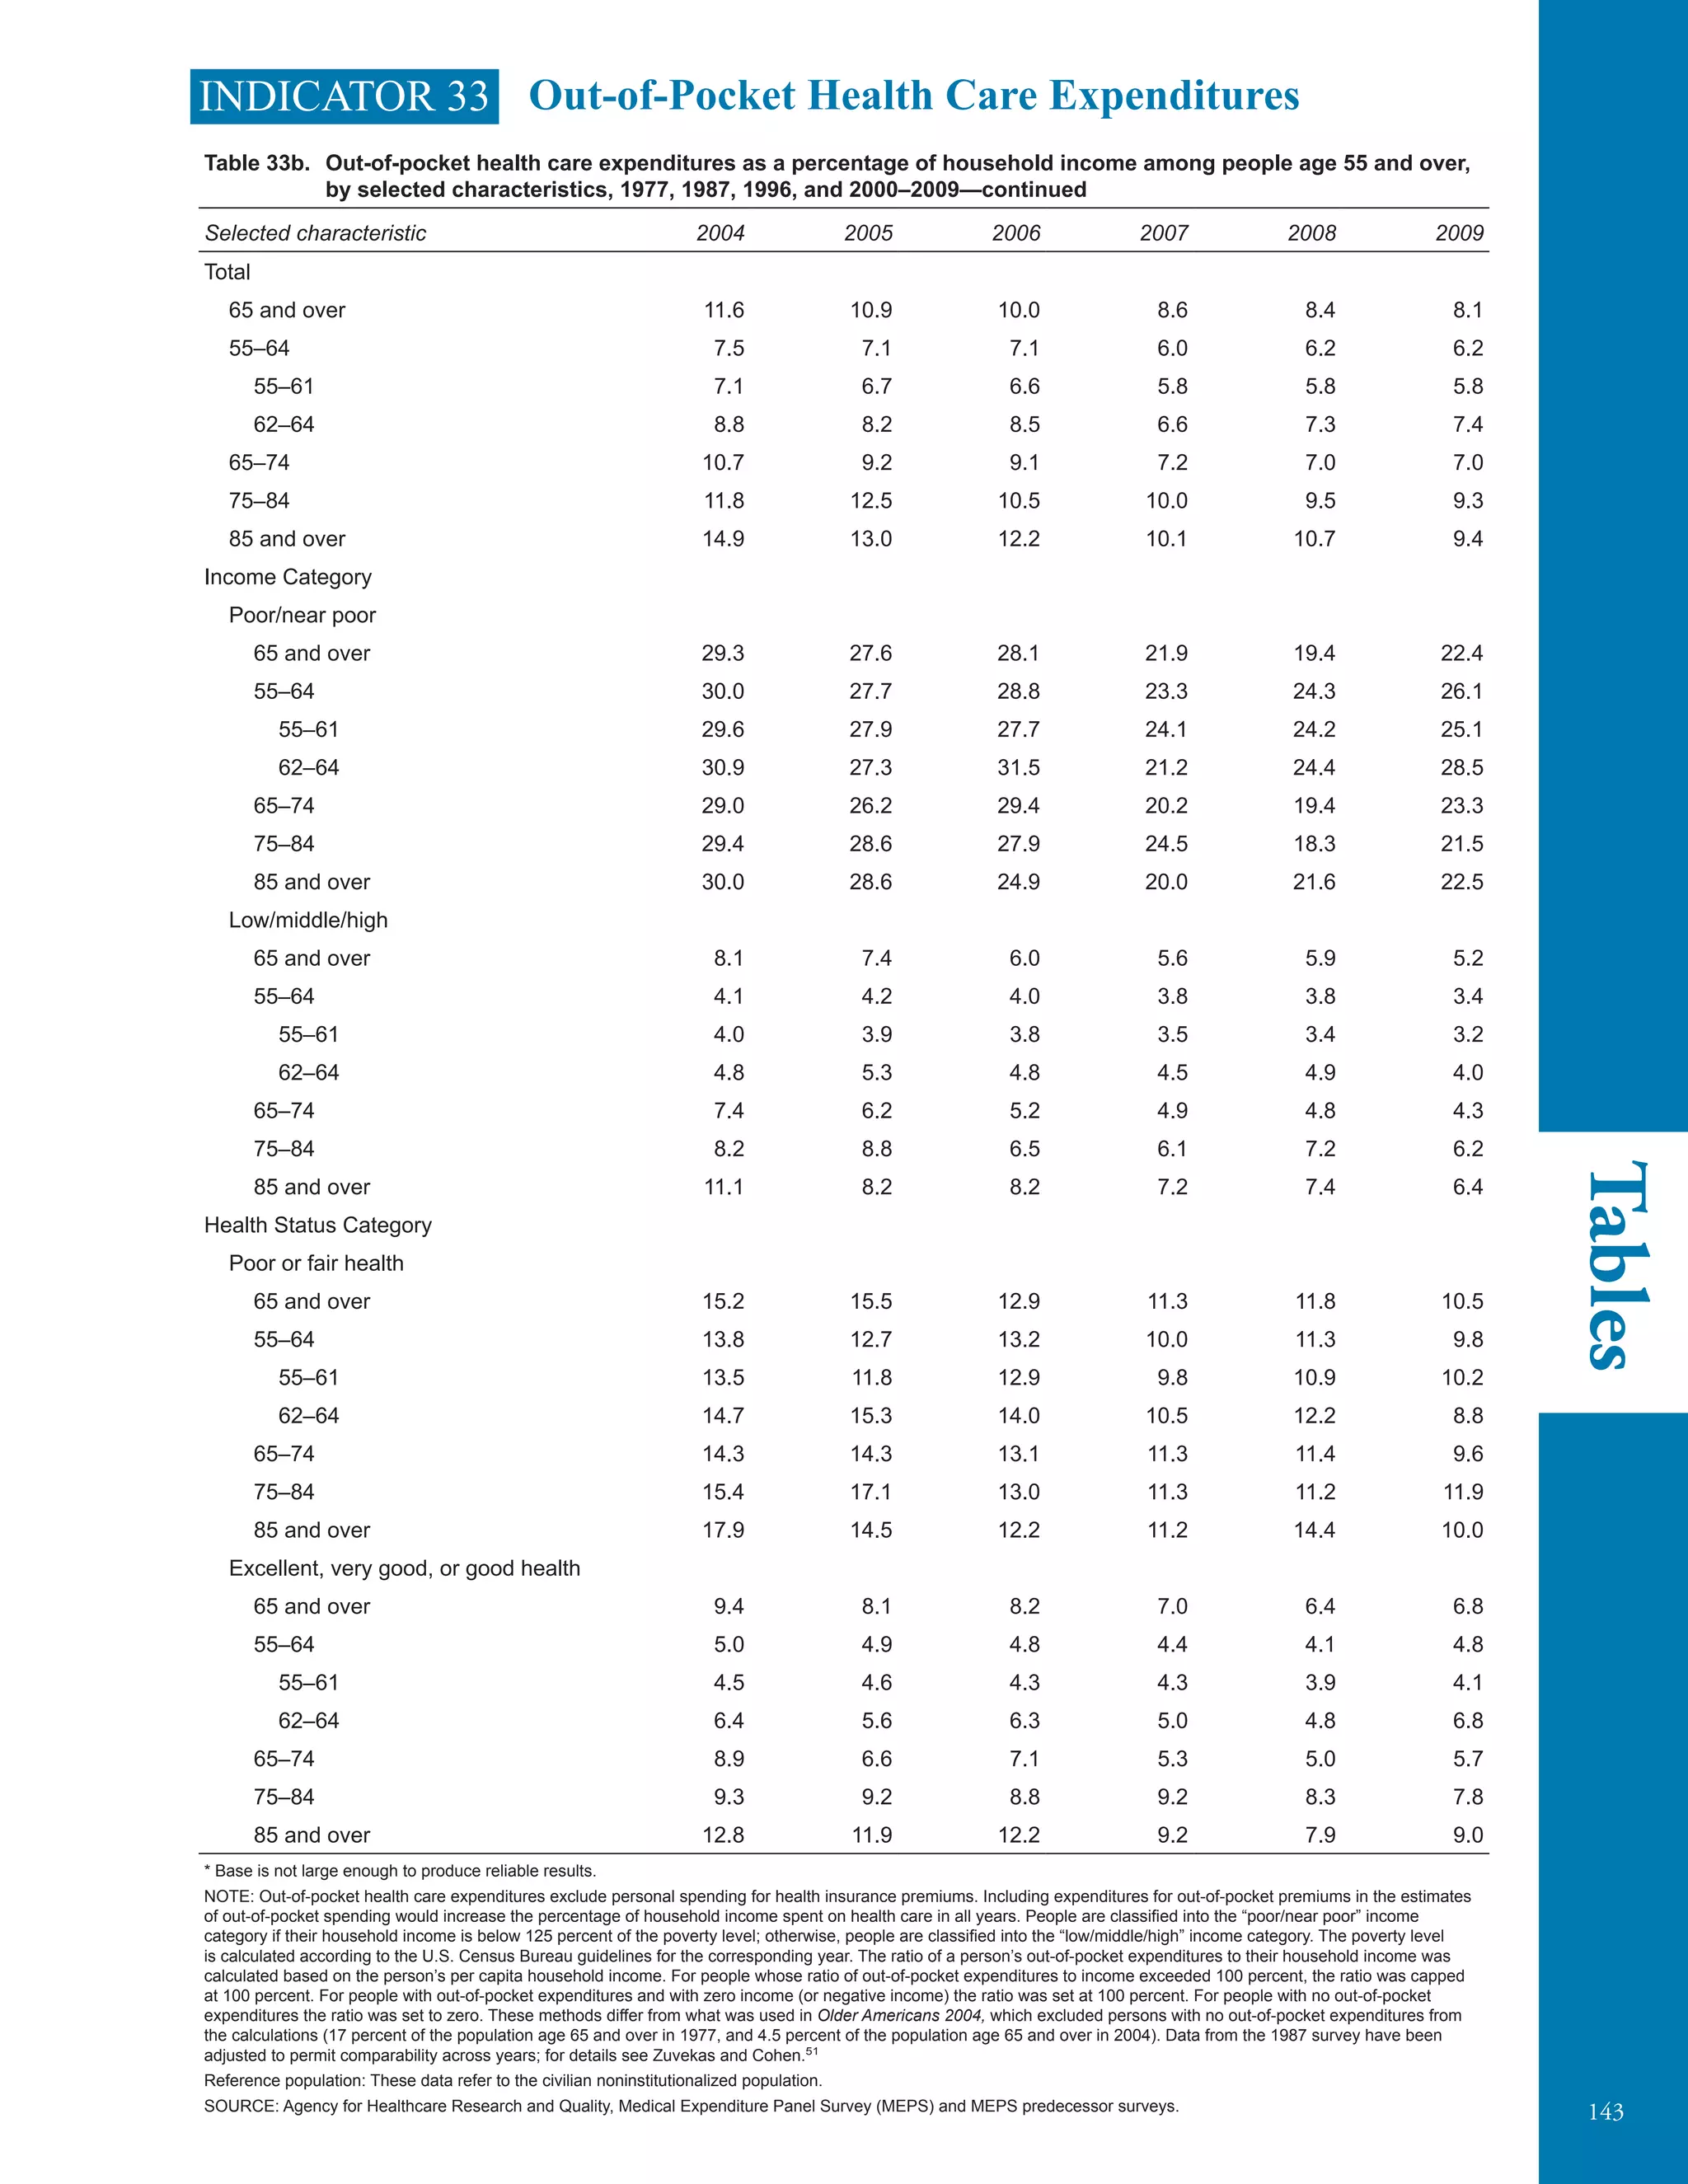
Indicator 33: Out-of-Pocket Health Care
Expenditures: Two income categories were used
to examine out-of-pocket health care expenditures
using the Medical Expenditure Panel Survey
(MEPS) and MEPS predecessor survey data. The
categories were expressed in terms of poverty
status (i.e., the ratio of the family’s income to the
Federal poverty thresholds for the corresponding
year), which controls for the size of the family
and the age of the head of the family. The
income categories were (1) poor and near poor
and (2) other income. The poor and near poor
income category includes people in families
with income less than 100 percent of the poverty
line, including those whose losses exceeded their
earnings, resulting in negative income (i.e., the
poor), as well as people in families with income
from 100 percent to less than 125 percent of
the poverty line (i.e., the near poor). The other
income category includes people in families with
income greater than or equal to 125 percent of the
poverty line. See Income, household.
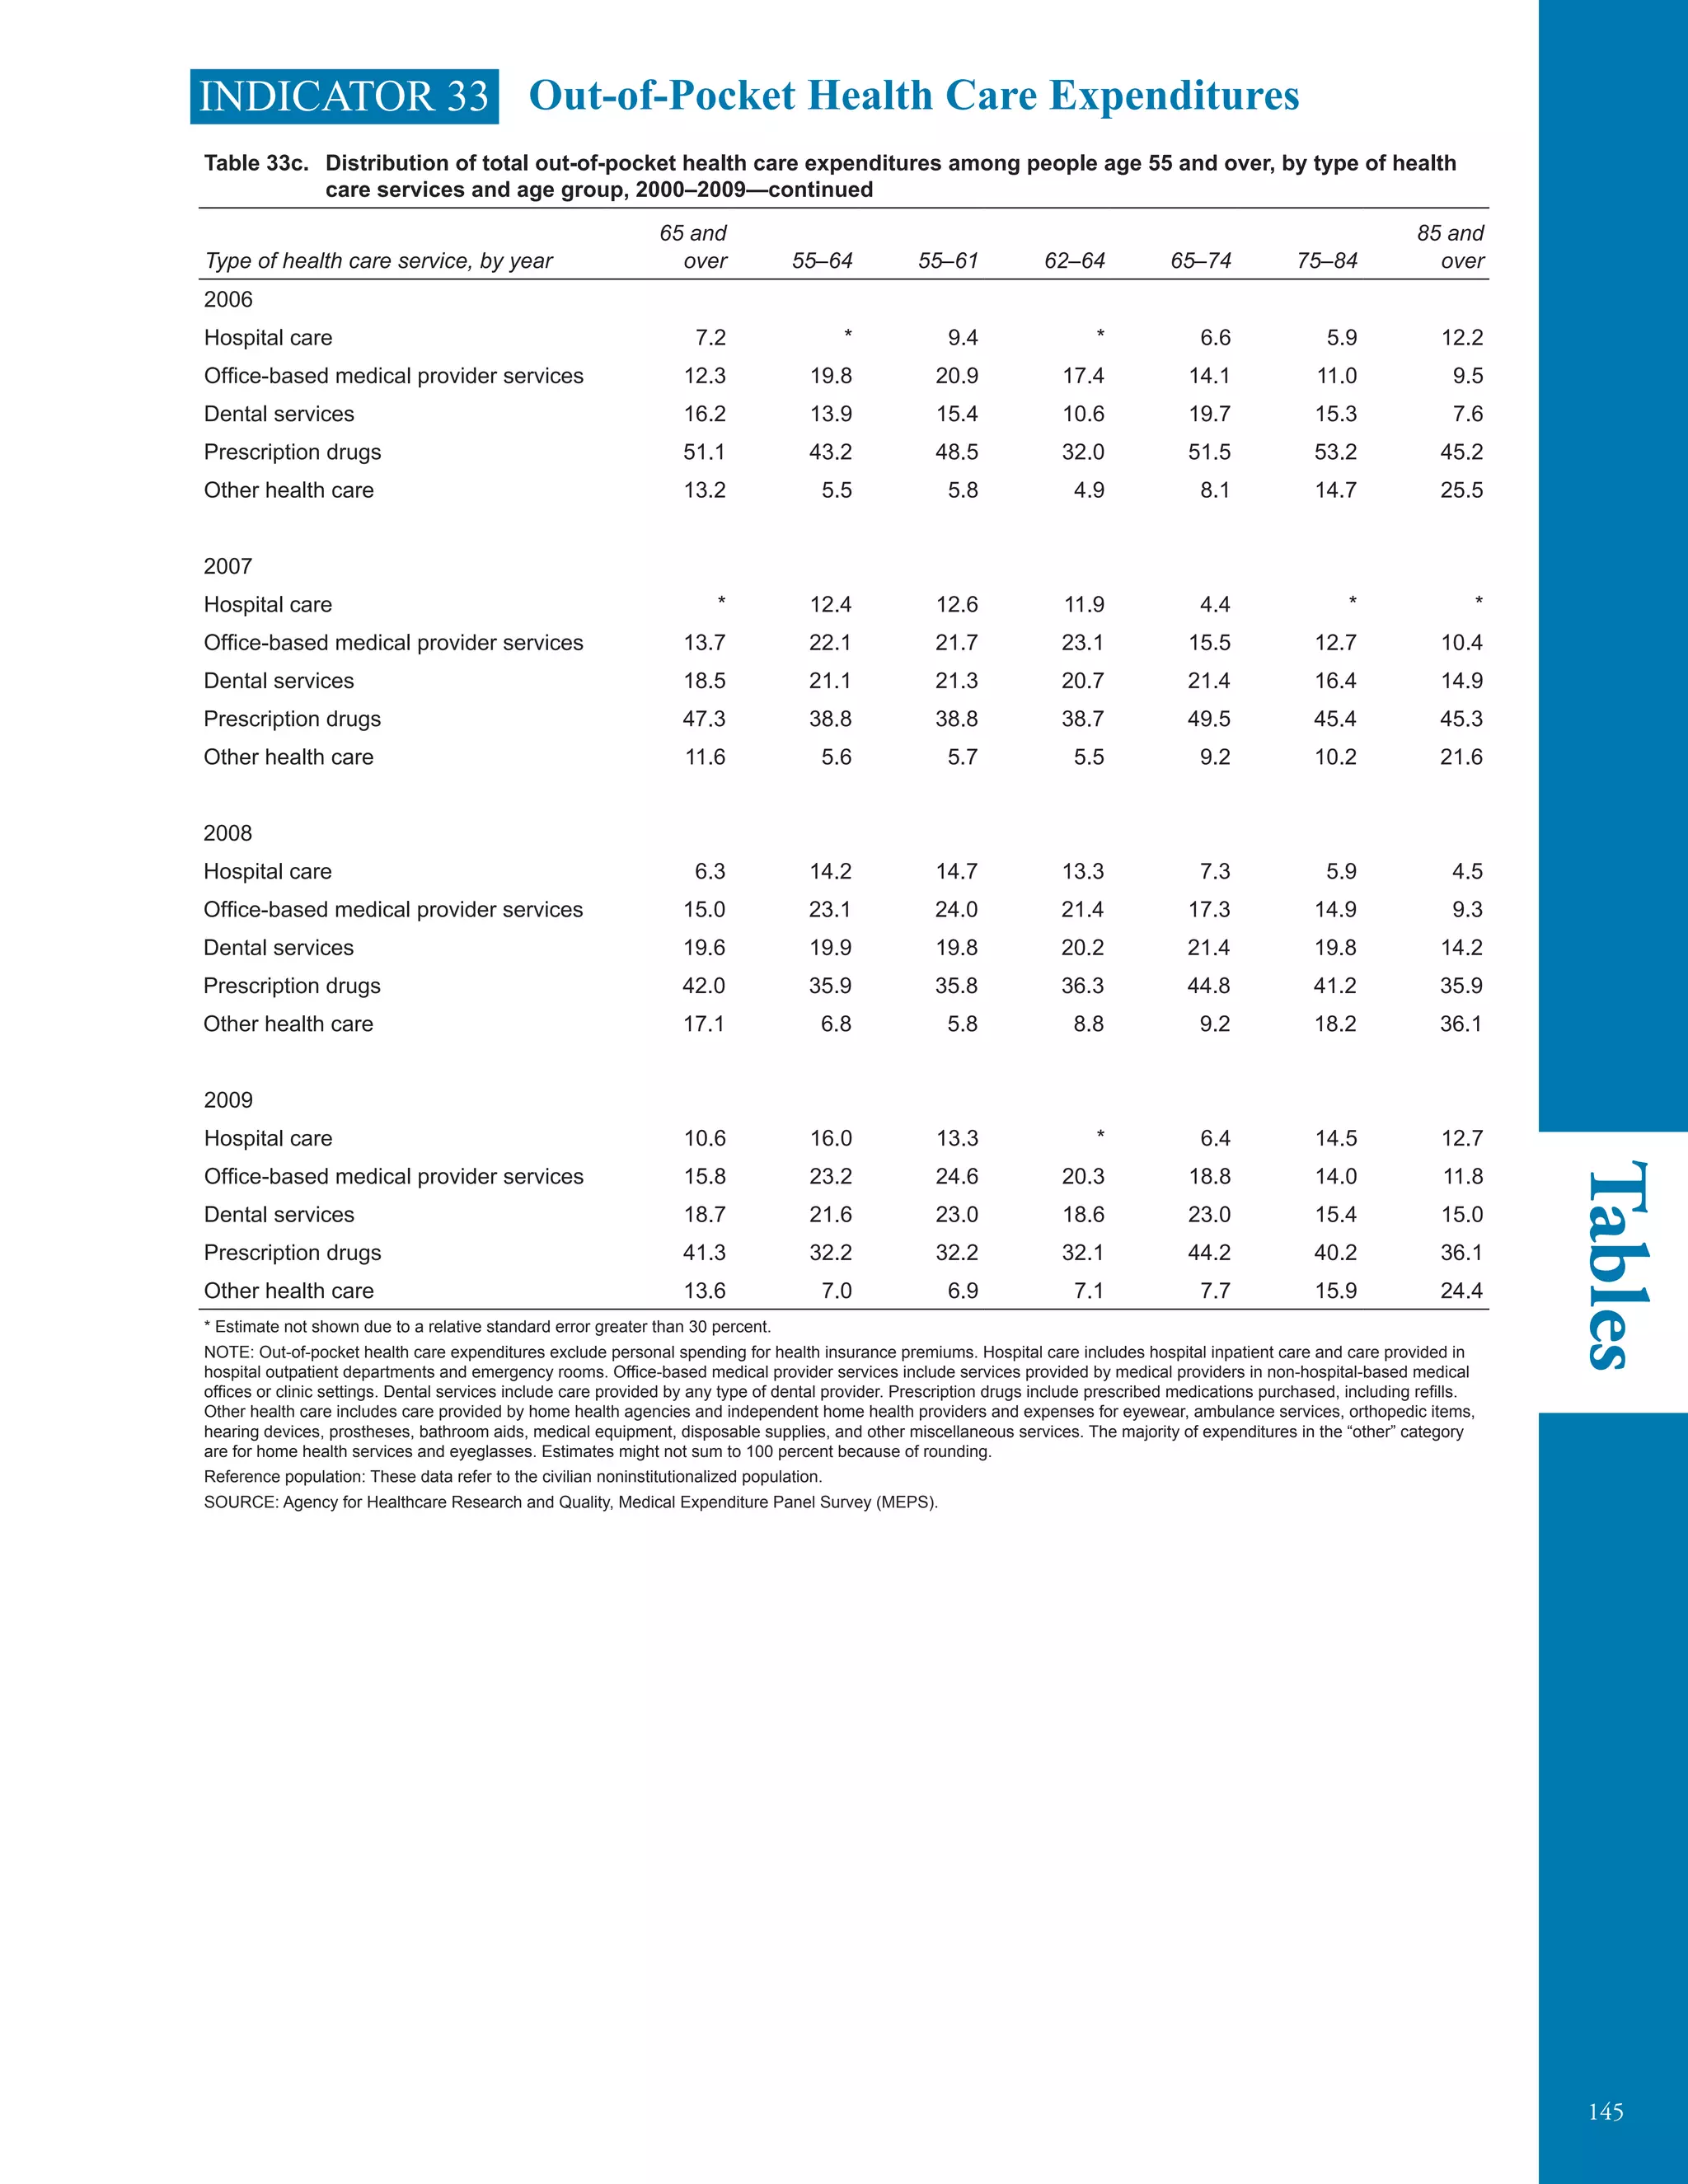
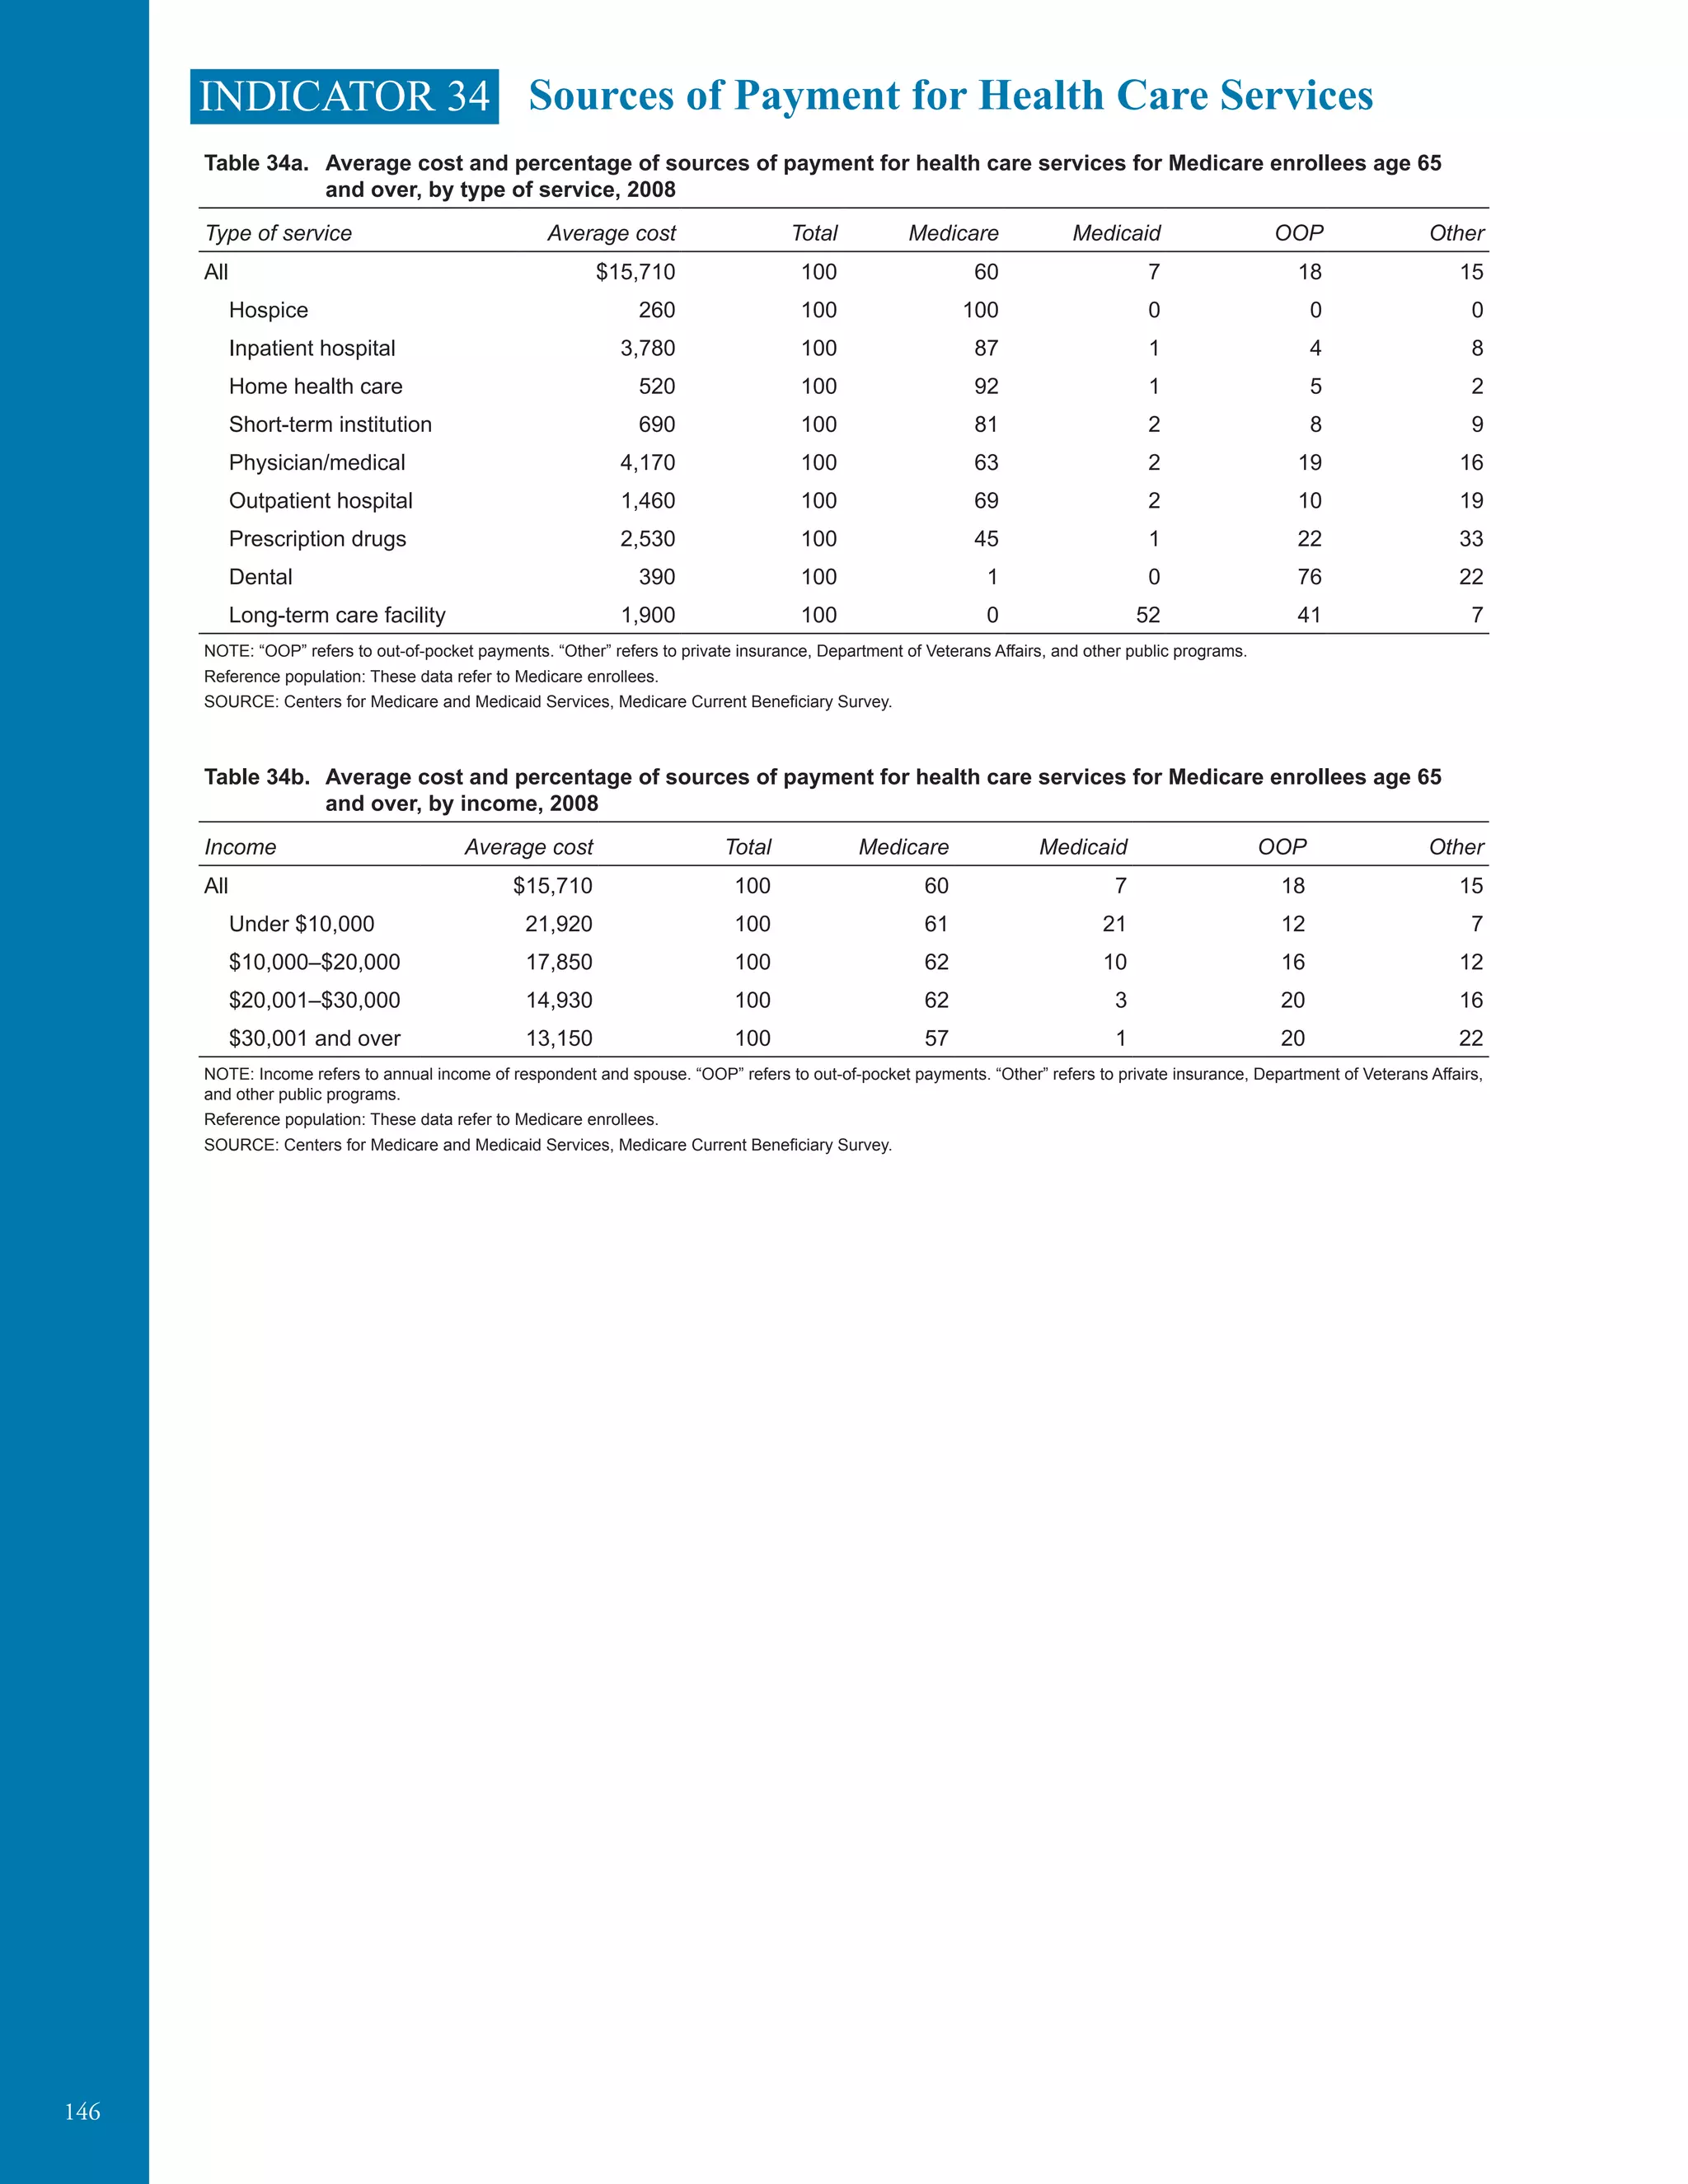
Prescription drugs/medicines: In the Medicare
Current Beneficiary Survey (Indicators 30,
31, 34) and in the Medical Expenditure Panel
Survey (Indicator 33), prescription drugs are all
prescription medications (including refills) except
those provided by the doctor or practitioner as
samples and those provided in an inpatient setting.
Prevalence: Prevalence is the number of cases
of a disease, infected people, or people with some
other attribute present during a particular interval
of time. It is often expressed as a rate (e.g., the
prevalence of diabetes per 1,000 people during a
year). See Incidence.
Private supplemental health insurance: See
Supplemental health insurance.
Public assistance: Public assistance is money
income reported in the Current Population Survey
from Supplemental Security Income (payments
made to low-income people who are age 65 and
over, blind, or disabled) and public assistance or
welfare payments, such as Temporary Assistance
for Needy Families and General Assistance.
Quintiles: See Income fifths.
Race: See specific data source descriptions.
Rate: A rate is a measure of some event, disease,
or condition in relation to a unit of population,
along with some specification of time.
Reference population: The reference population
is the base population from which a sample
is drawn at the time of initial sampling. See
Population.
Respondent-assessed health status: In the
National Health Interview Survey, respondent-
assessed health status is measured by asking
the respondent, “Would you say [your/subject
name’s] health is excellent, very good, good,
fair, or poor?” The respondent answers for all
household members including himself or herself.
Retiree Drug Subsidy: The Retiree Drug
Subsidy is designed to encourage employers to
continue providing retirees with prescription drug
benefits. Under the program, employers may
receive a subsidy of up to 28 percent of the
costs of providing the prescription drug benefit.
Short-term institution: This category in the
Medicare Current Beneficiary Survey (Indicators
30 and 34) includes skilled nursing facility
stays and other short-term (e.g., sub-acute care)
facility stays (e.g., a rehabilitation facility stay).
Payments for these services include Medicare
and other payment sources. See Skilled nursing
facility (Indicator 29), Nursing facility (Indicator
36), and Long-term care facility (Indicators 20,
30, 34, and 37).
Skilled nursing facility stays: Skilled nursing
facility stays in the Medicare claims data
(Indicator 29) refers to admission to and discharge
from a skilled nursing facility, regardless of
the length of stay. See Skilled nursing facility
(Indicator 29).](https://image.slidesharecdn.com/keyindicatorsofwellbeingolderamericans-150117160834-conversion-gate01/75/Global-Medical-Cures-Older-Americans-Key-Indicators-of-Well-Being-195-2048.jpg)


The document provides a comprehensive overview of older Americans' well-being, focusing on key indicators related to their health, economics, and healthcare access. It is prepared by the Federal Interagency Forum on Aging-Related Statistics and serves as a resource for policymakers and the public to understand the challenges and trends faced by the older population. This sixth report includes 37 indicators categorized into five sections and aims to stimulate discussions on improving the lives of older Americans.


