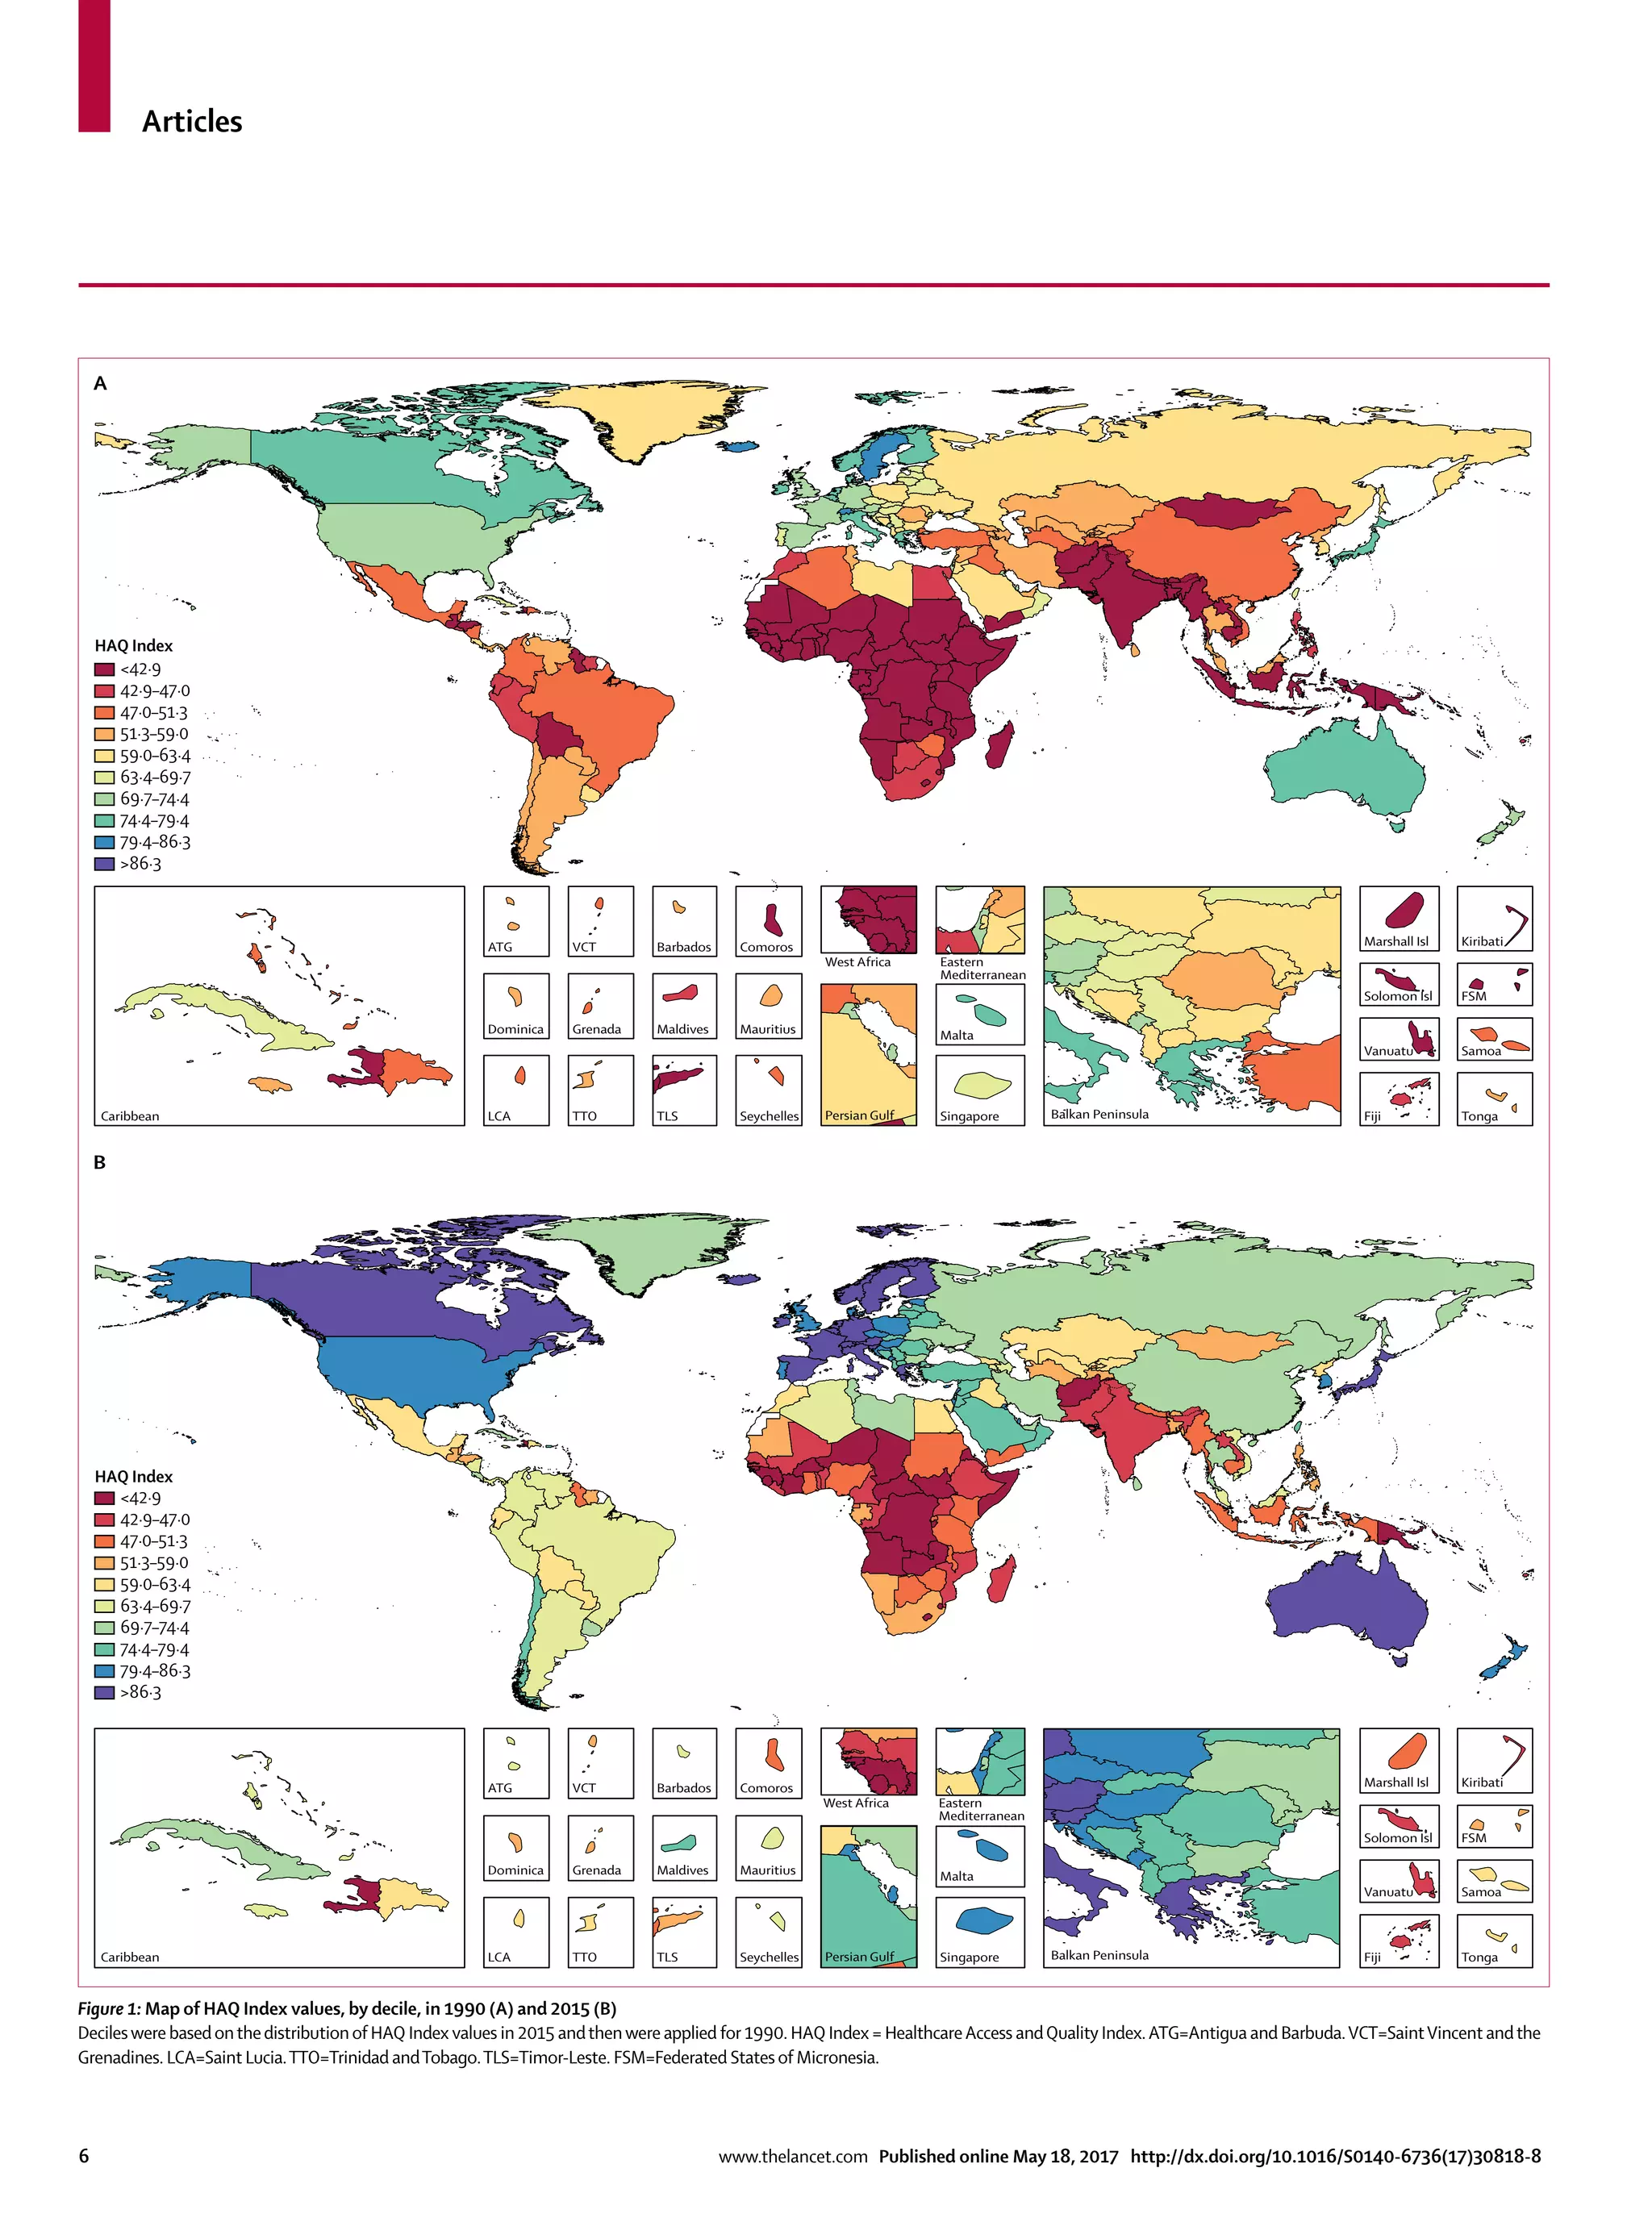
This document presents a novel analysis of healthcare access and quality across 195 countries and territories from 1990 to 2015, using the healthcare access and quality (HAQ) index based on amenable mortality. The study reveals that while improvements in HAQ index values were observed globally, the disparity between countries with the highest and lowest scores has increased, highlighting significant gaps in healthcare access and quality. It underscores the potential for enhancing personal healthcare and offers insights for health policy improvements, particularly in regions lagging in healthcare performance.


![Articles
www.thelancet.com Published online May 18, 2017 http://dx.doi.org/10.1016/S0140-6736(17)30818-8 25
by cause would provide an important additional piece
of policy-relevant information. Controlling for other
factors through statistical modelling, such as income and
educational attainment, we could examine how much
cause-specific variation relates to the HAQ Index. Such
work would help to pinpoint opportunities for national
and subnational progress through health-system
improvements, which would likely include public health
programmes and policies as well as the organisation and
delivery of personal health services across levels of care.
Moving to performance measurement
In estimating the HAQ Index frontier by SDI,58
we
quantified the gap between observed personal health-
care access and quality and levels potentially achievable
at a given level of SDI. With these analyses, we lay the
foundation for a refined assessment of health-system
performance. The World Health Report 2000, which
sought to evaluate health-system performance by
country,70
estimated the contribution of health systems
for improving healthy life expectancy while statistically
controlling for other factors. As suggested by Nolte and
McKee,9,71
using a measure more directly related to
health-system actions, such as mortality amenable to
personal health care, could reduce the need to control for
other factors in health-system performance assessment.
The World Health Report 2000 framework used five broad
dimensions—average levels of health, inequalities in
health, average levels of health-system performance,
inequalities in responsiveness, and fair financing—and
then compared overall health system attainment based
on a frontier for health expenditure per capita.71
Our
current analysis only focused on the contribution of
personal health care to mortality and the potential for
improvement in this domain relative to development. In
the future, GBD could support examining subnational
health inequalities and expanding into health finance
quantification of financial risk protection. A stronger
empirical basis for assessing these three domains of
health-system performance would also facilitate testing a
range of efficiency and performance models.
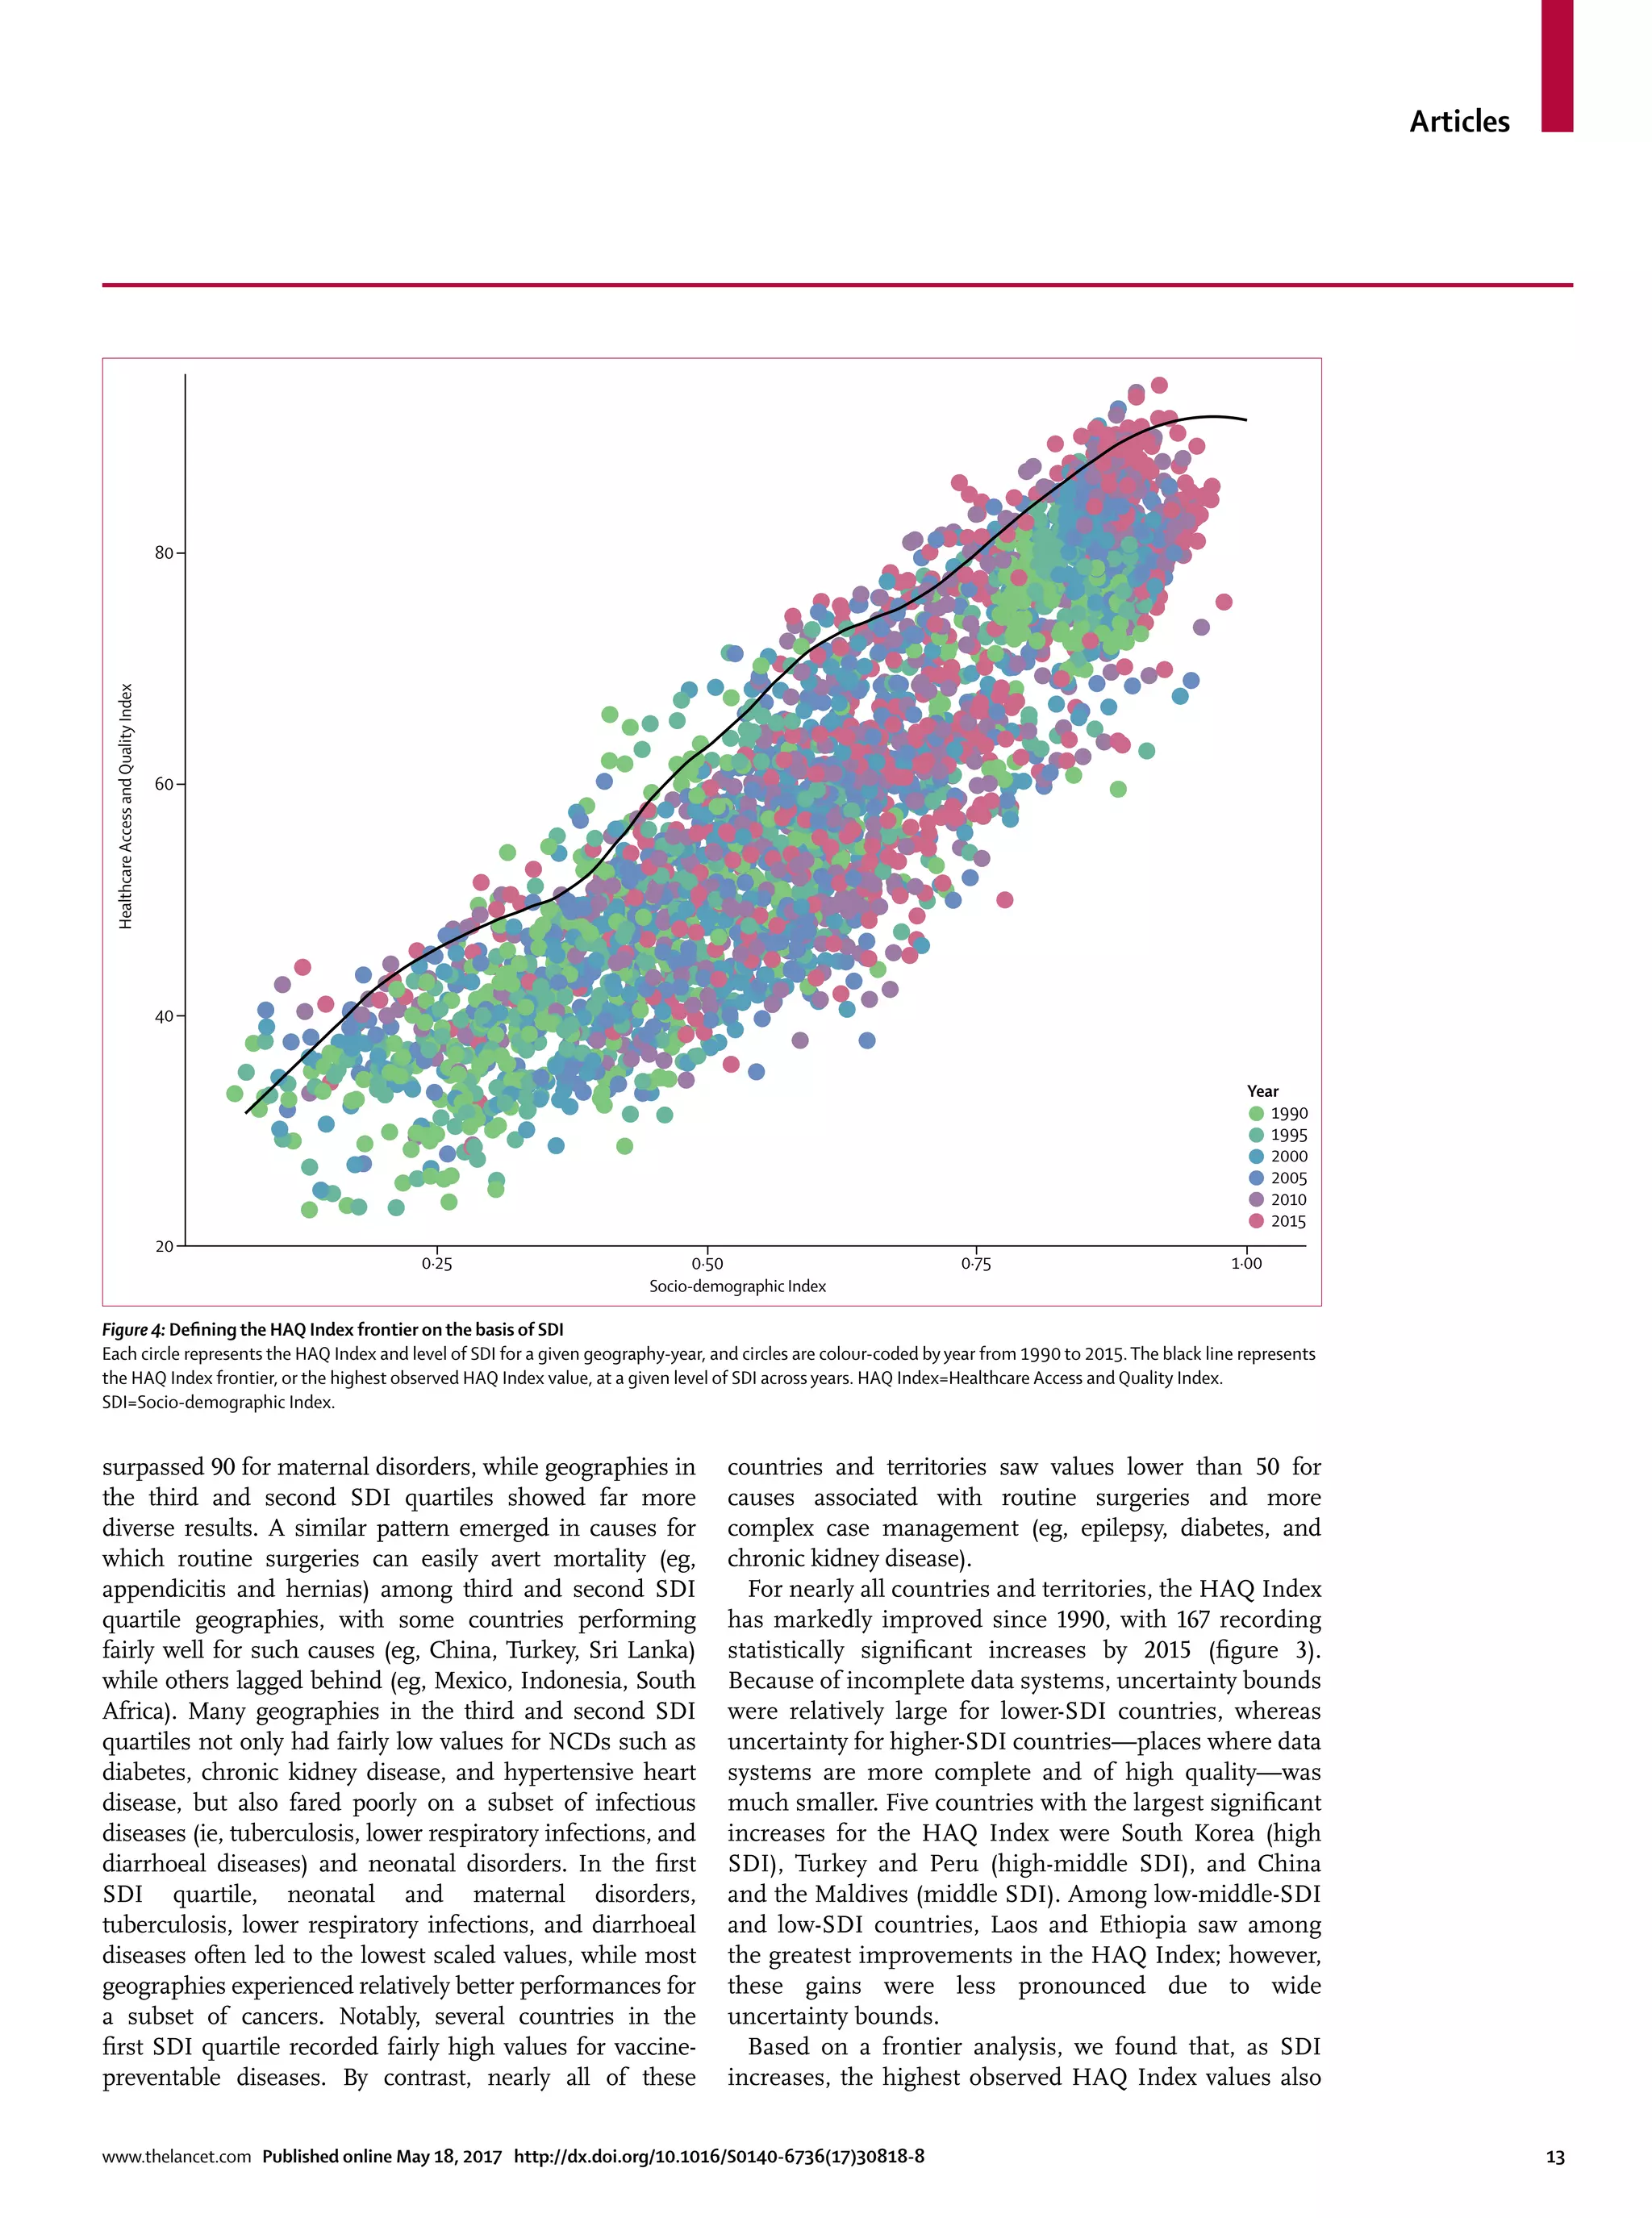
Our frontier analysis showed that the highest observed
HAQ Index levels, as achieved by geographies with an
SDI of 0·8 or higher, steadily shifted higher over time.
This expansion of health-care access and quality may
reflect a rising share of GDP allocated to health among
high-SDI countries. However, the frontier estimate for
GDP per capita spent on health points to a similar shift
upward at high expenditure. One explanation of this trend
is new medical technologies and programmes, which
could be driving an overall upward shift in health-care
access and quality achievable in well financed systems.
Another potential explanation is innovation in health-care
organisation, such as the creation of centralised stroke
care units in major cities.72
A more detailed examination
of these changes may further elucidate how investing in
medicalinnovationscanaffecthealth-systemperformance.
In particular, this might shed light on the association
between investment in health-care resources and
outcomes, a relationship that is unlikely to be linear. For
instance, audits have identified three main factors
underlying maternal deaths: substandard care, delays in
care, and problems with blood transfusions.73
Addressing
the latter requires a different type of intervention, namely
investments in infrastructure, than the former two factors.
Such knowledge is of particular importance in the SDG
era, as some studies point to advances in medical
technology and innovation as the primary pathway for
elevating health alongside increasing development.74
HAQ Index compared to other measures of access and
quality of care
Detailed results on HAQ Index components seem
consistent with previous, albeit limited, studies on health-
care performance. Within Europe, Nordic countries
performed especially well, corresponding with past work
on a composite measure of public health policies.75
Country
performance on diabetes aligned with earlier work on
diabetes mortality and incidence,25
wherein country-level
differences were largely explained by known health-system
changes, such as substantial improvements in several
Baltic states during the late 1990s. In Latin America,
Costa Rica’s relatively high HAQ Index (72·9), as compared
with nearby countries (eg, Nicaragua [64·3],
Guatemala [55·7]), is consistent with its designation as an
original “good health at low cost” country.76
In view of the paucity of standard health-care access and
quality measures, assessing HAQ Index validity compared
to other indicators was challenging. In this analysis, we
identified three measures of health-system resources and
three measures of intervention coverage that included
at least 70 countries. These correlations, which all
exceeded 0·60, offer some evidence of convergent validity
but do not provide criterion validity.77,78
Nonetheless, these
results are encouraging and stand in contrast to previous
studies done in limited settings.37–40
In comparison with
past work,9,11,31
the moderately high correlation with other
health-care indicators might be due to our efforts to risk-
standardise mortality amenable to health care; PCA
weighting of different amenable conditions; and the
inclusion of a substantively larger, more diverse set of
health systems across the development spectrum.
Additional validation analyses are needed to compare
HAQ Index performance with other measures of health-
care access and quality; such validation exercises might be
more feasible at the subnational level with greater data
density, such as states in the USA.79
Limitations
This analysis has a number of limitations beyond those
already described. First, many limitations experienced in
GBD cause of death estimation are applicable to this
study.47
Second, our risk-standardisation procedure might
not represent all possible risk-outcome pairs as they](https://image.slidesharecdn.com/healthcareaccessandqualityindex-170521181824/75/Healthcare-Access-and-Quality-Index-25-2048.jpg)