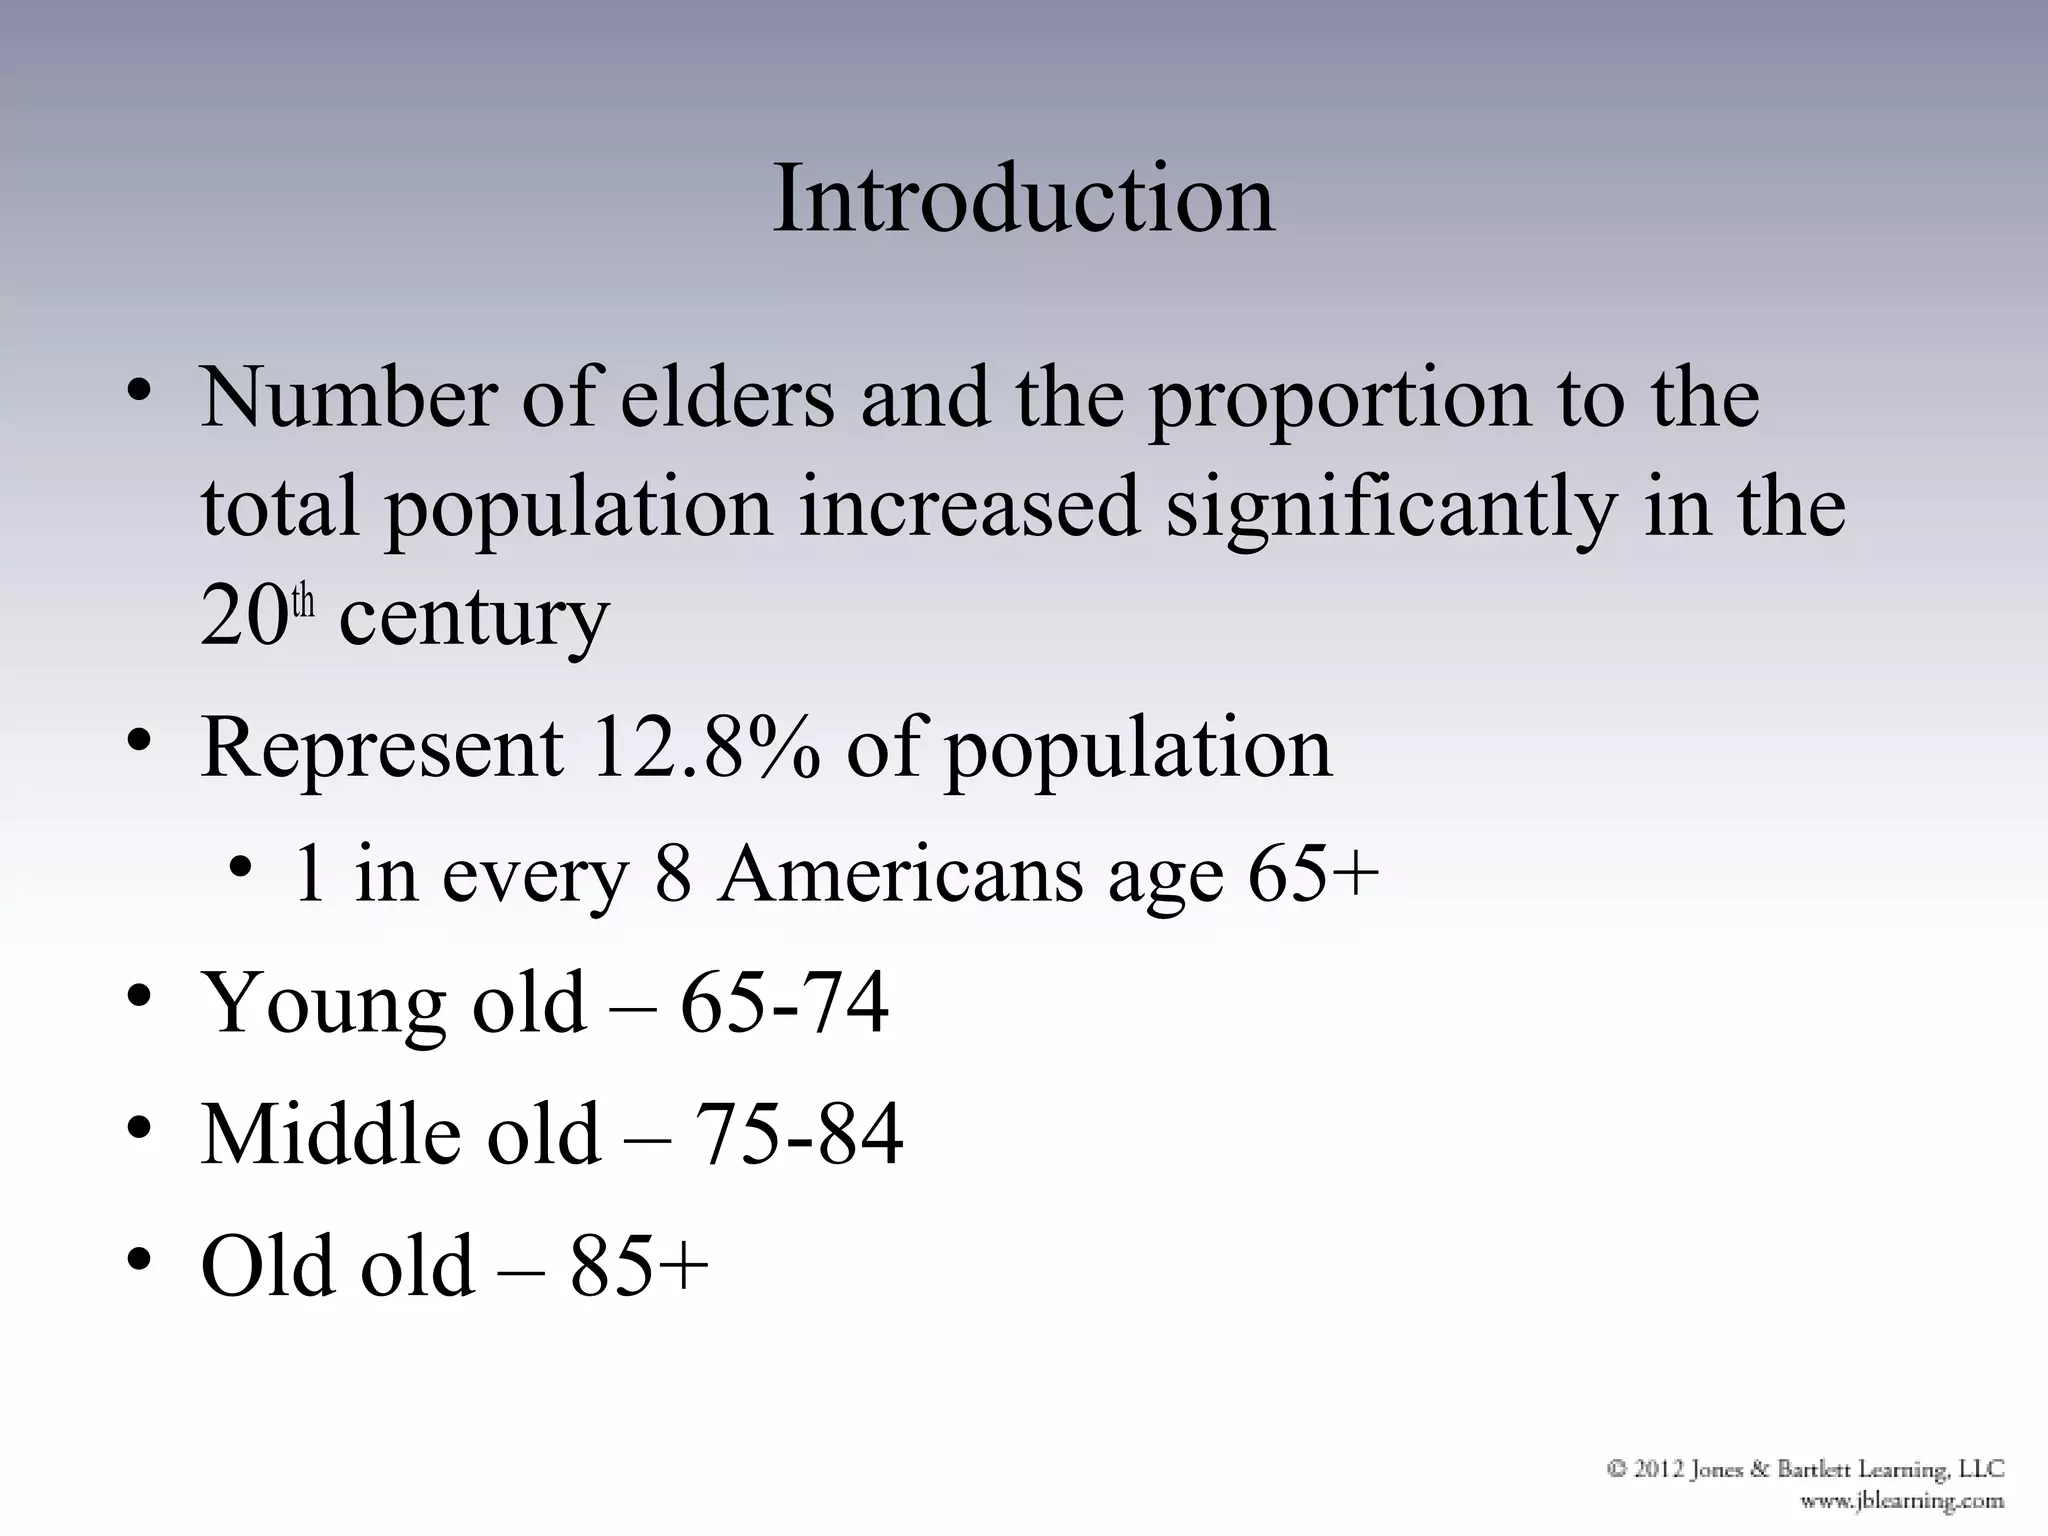
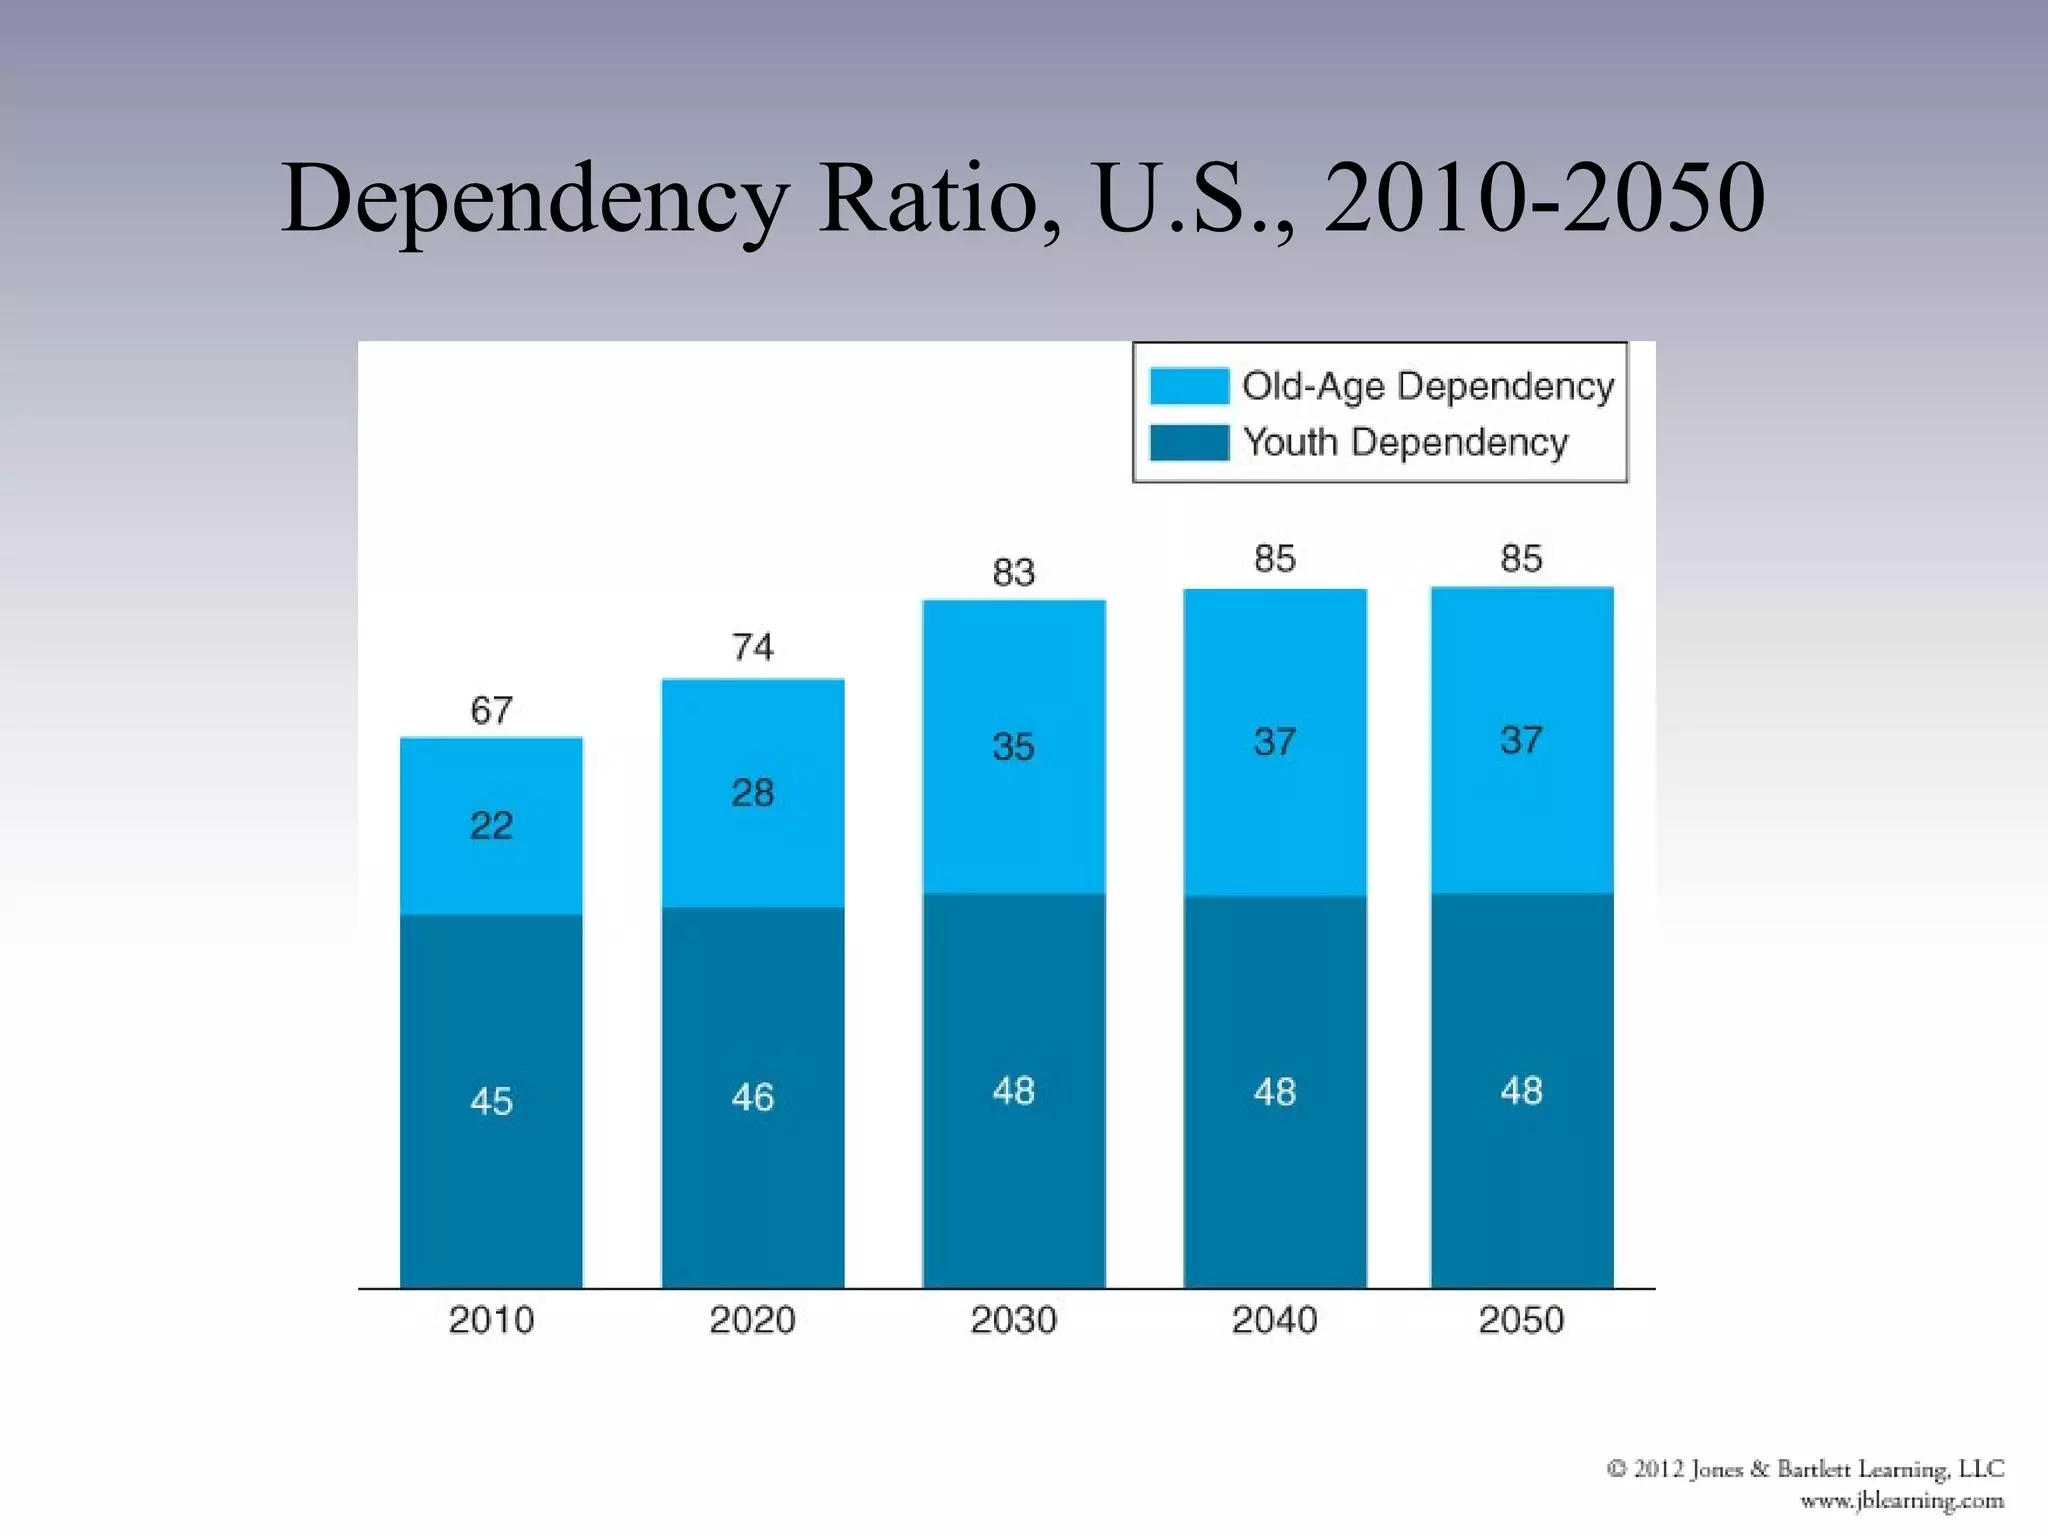
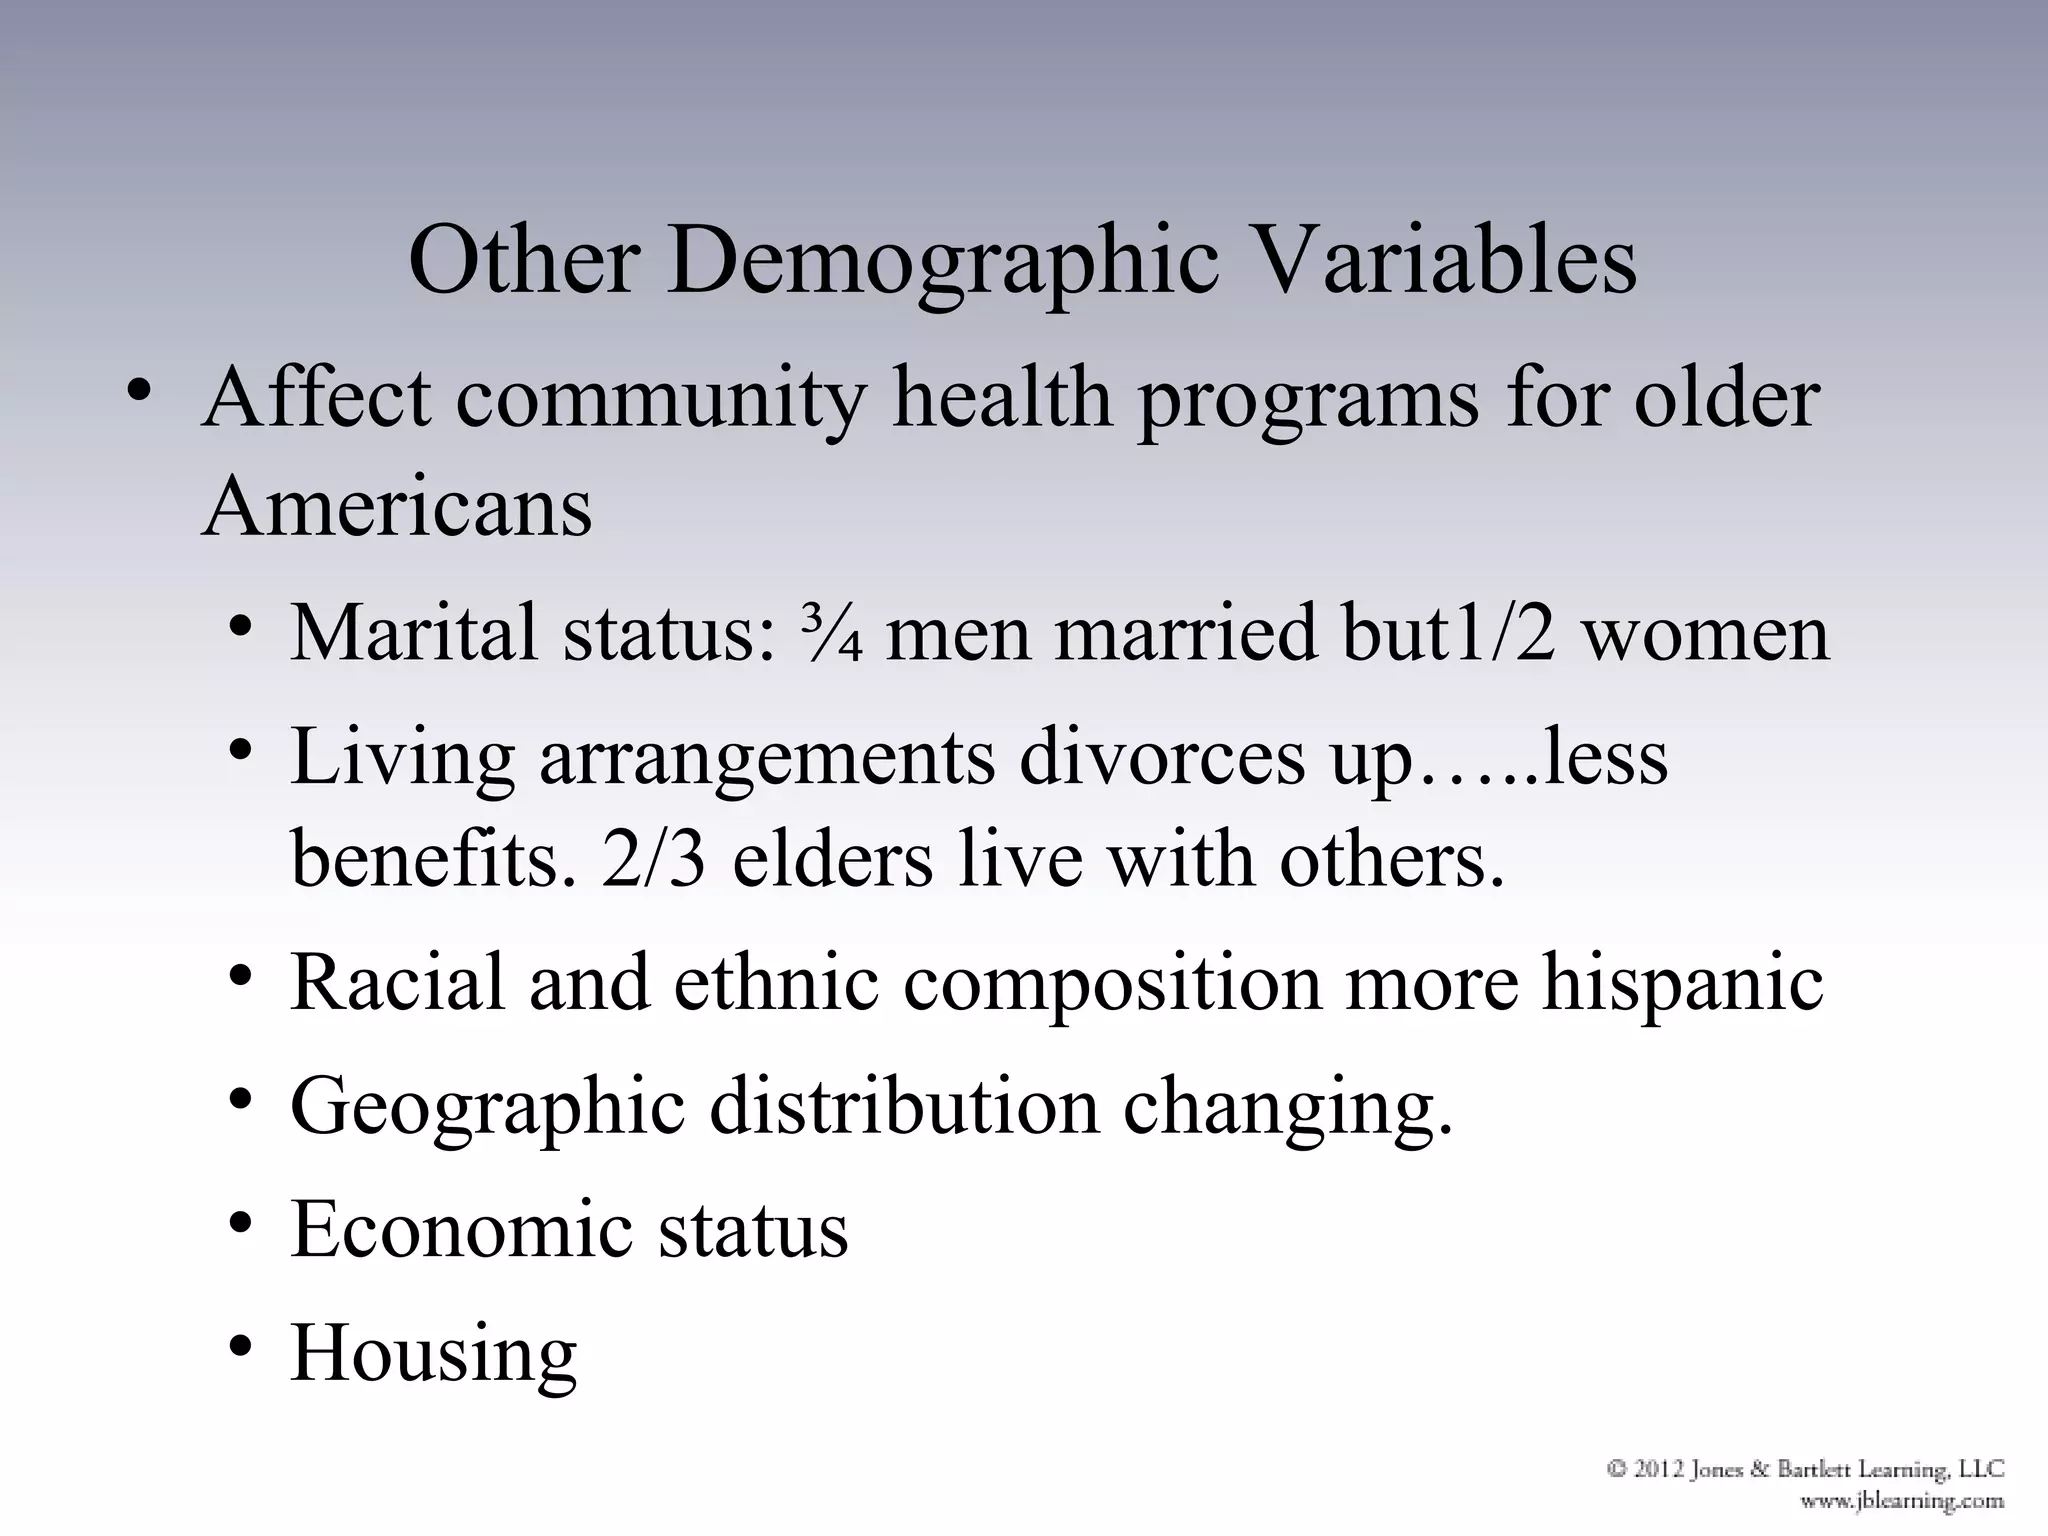
Elders


Chapter 9
Introduction
• Number of elders and the proportion to the
  total population increased significantly in the
  20th century
• Represent 12.8% of population
  • 1 in every 8 Americans age 65+
• Young old – 65-74
• Middle old – 75-84
• Old old – 85+
Definitions
•   Aged
•   Aging
•   Gerontology multidisciplinary study
•   Geriatrics branch of medicine
•   Geriatrician

• Terms – seniors, older adults, mature adults,
  elderly, aged, etc.
Aging Myths
• Ageism – prejudice and discrimination against
  the aged
• Common myths not accurate representation of
  elders
  • Majority of elders today are active and well
  • Many still working
  • Many strongly engaged in community,
    volunteer, and advocacy programs
Demography of Aging
• Size and growth of the elder population
  • Population pyramids describe aging of
    populations
  • America’s pyramid shape has drastically
    shifted
  • Other countries have had shifts as well
  • 85+ fastest growing segment of older
    population
  • Growth in median age from 35 ( 2000) to 39
    ( 2035)
Symbolic Age Pyramid
Population Pyramids, U.S.
Factors Affecting Population Size and Age
• Fertility rates
   • Baby boomers – 1946-1964
• Mortality rates
   • Life expectancy has continued to increase;
     significant increase in 20th century
• Migration
   • Movement of people from one country to
     another can affect population size
• Fertility rates = births/1000 women of
  childbearing age
• High beginning of 1900s
• Low during depression
• Rebound after WW 2
• This population bulge moves up us age
  pyramid
• Mortality rates: down in 20th century
• Life expectancy up
• Therefore older population
Dependency and Labor Force Ratios
• Dependency ratio – economically
  unproductive to economically productive
  • Traditionally defined by age
  • Can be used for social policy decision making
• Labor force ratio – number of people actually
  working and those who are not, independent of
  their ages
• Ratio of workers to dependants will be lower
  in the future than today
•   Unproductive are 0-19 years and
•   65+
•   Both together are total dependency ratio
•   Youth dependency ratio =youth/productive
•   Old age dependency ratio= old/productive
Dependency Ratio, U.S., 2010-2050
• TR total dependency ratio is climbing up to
  85% driven by elder segment.
• What factors cause easy transition to senior
  living for Papa
Other Demographic Variables
• Affect community health programs for older
  Americans
  • Marital status: ¾ men married but1/2 women
  • Living arrangements divorces up…..less
    benefits. 2/3 elders live with others.
  • Racial and ethnic composition more hispanic
  • Geographic distribution changing.
  • Economic status
  • Housing
• Who lives longest?
• Who lives least long ?
• Who is in the middle?
Marital Status
• ¾ of elder men are married; just over half of
  elder women are married
• Elder women 3x’s more likely to be widowed
  • Men have shorter life expectancies
  • Men tend to marry women younger than selves
  • Men more likely to remarry after loss of spouse
• Number of divorced elders continues to rise
  • New concerns: lack of retirement benefits,
    insurance, lower net worth assets
Living Arrangements
• Closely linked to income, health status, and
  availability of caregivers
• 2/3 of noninstitutionalized elders live with
  someone else
  • Women more likely to live alone
• Only 5% of elders live in nursing homes
  • ¾ of nursing home residents are women
  • More than half of nursing home residents are
    85+
Racial and Ethnic Composition
• U.S. older population growing more diverse
• 2010 elders:
  • 80% white, 9% black, 7% of Hispanic origin,
    3% Asian
• 2050 projection of elders:
  • White 58%, Hispanic origin 15%, black 11%,
    Asian 8%
Geographic Distribution
• 2/5 live in southern states
• More than half live in 10 states: CA, FL, IL,
  MI, NJ, NY, NC, OH, PA, TX
• California greatest number; Florida greatest
  proportion
• Reasons some states “age”
  • Inward migration (FL), young people leave
    (farm belt states)
Economic Status
• 1970 – 25% of elders lived in poverty
• 2006 – less than 9% lived in poverty
• Income
  •   37% of elder income from Social Security
  •   15% asset income
  •   18% pension income
  •   28% earnings
• What is SES?
Housing
• Most live in adequate, affordable housing
• 80% own, 20% rent
• Elder homes are more likely to be older, more
  likely to have lower value, in great need for
  repairs, less likely to have central heat/air
• 30% of elders pay more for housing than they
  can afford
Health Profile
• Health status of elders has improved over the
  years (living longer and functional health)
• Chronically disabled has been decreasing
• Health status usually not as good as younger
  counterparts
Mortality
• Top causes of death for elders (responsible for
  2/3 of deaths)
  •   Heart disease
  •   Cancer
  •   Stroke
  •   CLRD
  •   Alzheimer’s Disease
  •   Decline in CVD deaths causes less mortality
•   Medicare enrollees > 65
•   1 in 5 men and 1 in 3 women can’t
•   Walk 2 blocks
•   Write
•   Kneel
•   Reach overhead
•   Lift 10 lbs
Morbidity
• Activity limitations increase with age
• Chronic conditions
  • Substantial burden on health and economic
    status of individuals, families, and nation
  • 1/3 report limitation of activity due to chronic
    conditions
• Impairments
  • Very prevalent in older adults
  • May be sensory, physical, memory
Health Behaviors and Lifestyle Choices
• Generally have more favorable health
  behaviors than younger counterparts
  • Less likely to consume large amounts of
    alcohol, smoke cigarettes, or be overweight
• Areas for improvement
  • Physical activity, immunizations and nutrition
• 22% > 65 do physical activity
• 10% > 85%

• Also vaccines
Figure B01: Healthy People 2020

U.S. Department of Health and Human Services, Office of Disease Prevention
and Health Promotion (2010). Healthy People 2020. Available at
http://www.healthypeople.gov/2020/default.aspx. Accessed December 2, 2010.
Elder Abuse and Neglect
• Reports have increased greatly in recent years
• All states have set up reporting systems
• Special problem for elders
  •   May be frail
  •   Unable to defend themselves
  •   Vulnerable to telemarketing and mail scams
  •   Most common victims of theft of benefit
      checks
Instrumental Needs of Elders
• Six instrumental needs that determine lifestyle
  for people of all ages; aging process can alter
  needs in unpredictable ways
  •   Income
  •   Housing
  •   Personal care
  •   Health care
  •   Transportation
  •   Community facilities and services
Income
• Change in types of expenses in elder years
• Social Security is major source of income for
  ~2/3 of recipients; 90% of income for 1/3
• Nonmarried women and minorities have
  highest rates of poverty
• But need home, health $
Housing
• Major needs: appropriateness, accessibility,
  adequacy, affordability
     • Needs are intertwined
• Changing place of residence can have negative
  effect on elder and family members
• Group housing
  • Nursing homes, Eden Alternative facilities,
    Green Houses, retirement communities,
    CCRCs, assisted-living
Personal Care
• Four levels of tasks that may need assistance:
  • Instrumental tasks, expressive tasks, cognitive
    tasks, tasks of daily living
• Activities of daily living (ADLs) to measure
  functional limitations
• Instrumental activities of daily living (IADLs)
  to measure more complex tasks
• Caregiver issues
• Caregiver services
•   ADLs activities of daily living
•   These measure functional limitations
•   Examples are
•   Eating
•   Toilet function
•   Bathing
•   Walking
•   Out of bed
Health Care
• Elders heaviest users of health care services
  • Use of health care services increases with age
     • Most money spent on health care is in last years
       of life
• Medicare primary source of payment for
  health care services of elders
  • Will see major changes in future years
Transportation
• Transportation allows elders to remain
  independent
• On average, elders live 10 year after they stop
  driving
• Greatest influence on transportation needs:
  • income and health status
• Many public transportation challenges
• Solutions for transportation needs of elders
Community Facilities and Services
• Older Americans Act of 1965 (OAA) to
  increase services and protect rights of elders
  • National nutrition programs for elders
  • State and Area Agencies on Aging
  • Other programs
• Services can vary greatly across the country
Community Facilities and Services
•   Meal service
•   Homemaker service
•   Chore and home maintenance
•   Visitor service
•   Adult day care
•   Respite care
•   Home health care
•   Senior centers
Discussion Questions
• What can happen to increase the likelihood of
  elders utilizing community facilities and
  services?

• How will the changing demographics of elders
  affect health care services?

90110 pp tx_ch09-1

  • 1.
  • 2.
    Introduction • Number ofelders and the proportion to the total population increased significantly in the 20th century • Represent 12.8% of population • 1 in every 8 Americans age 65+ • Young old – 65-74 • Middle old – 75-84 • Old old – 85+
  • 4.
    Definitions • Aged • Aging • Gerontology multidisciplinary study • Geriatrics branch of medicine • Geriatrician • Terms – seniors, older adults, mature adults, elderly, aged, etc.
  • 6.
    Aging Myths • Ageism– prejudice and discrimination against the aged • Common myths not accurate representation of elders • Majority of elders today are active and well • Many still working • Many strongly engaged in community, volunteer, and advocacy programs
  • 7.
    Demography of Aging •Size and growth of the elder population • Population pyramids describe aging of populations • America’s pyramid shape has drastically shifted • Other countries have had shifts as well • 85+ fastest growing segment of older population • Growth in median age from 35 ( 2000) to 39 ( 2035)
  • 9.
  • 10.
  • 11.
    Factors Affecting PopulationSize and Age • Fertility rates • Baby boomers – 1946-1964 • Mortality rates • Life expectancy has continued to increase; significant increase in 20th century • Migration • Movement of people from one country to another can affect population size
  • 12.
    • Fertility rates= births/1000 women of childbearing age • High beginning of 1900s • Low during depression • Rebound after WW 2 • This population bulge moves up us age pyramid
  • 13.
    • Mortality rates:down in 20th century • Life expectancy up • Therefore older population
  • 14.
    Dependency and LaborForce Ratios • Dependency ratio – economically unproductive to economically productive • Traditionally defined by age • Can be used for social policy decision making • Labor force ratio – number of people actually working and those who are not, independent of their ages • Ratio of workers to dependants will be lower in the future than today
  • 16.
    Unproductive are 0-19 years and • 65+ • Both together are total dependency ratio • Youth dependency ratio =youth/productive • Old age dependency ratio= old/productive
  • 17.
  • 18.
    • TR totaldependency ratio is climbing up to 85% driven by elder segment.
  • 20.
    • What factorscause easy transition to senior living for Papa
  • 21.
    Other Demographic Variables •Affect community health programs for older Americans • Marital status: ¾ men married but1/2 women • Living arrangements divorces up…..less benefits. 2/3 elders live with others. • Racial and ethnic composition more hispanic • Geographic distribution changing. • Economic status • Housing
  • 22.
    • Who liveslongest? • Who lives least long ? • Who is in the middle?
  • 23.
    Marital Status • ¾of elder men are married; just over half of elder women are married • Elder women 3x’s more likely to be widowed • Men have shorter life expectancies • Men tend to marry women younger than selves • Men more likely to remarry after loss of spouse • Number of divorced elders continues to rise • New concerns: lack of retirement benefits, insurance, lower net worth assets
  • 24.
    Living Arrangements • Closelylinked to income, health status, and availability of caregivers • 2/3 of noninstitutionalized elders live with someone else • Women more likely to live alone • Only 5% of elders live in nursing homes • ¾ of nursing home residents are women • More than half of nursing home residents are 85+
  • 25.
    Racial and EthnicComposition • U.S. older population growing more diverse • 2010 elders: • 80% white, 9% black, 7% of Hispanic origin, 3% Asian • 2050 projection of elders: • White 58%, Hispanic origin 15%, black 11%, Asian 8%
  • 26.
    Geographic Distribution • 2/5live in southern states • More than half live in 10 states: CA, FL, IL, MI, NJ, NY, NC, OH, PA, TX • California greatest number; Florida greatest proportion • Reasons some states “age” • Inward migration (FL), young people leave (farm belt states)
  • 27.
    Economic Status • 1970– 25% of elders lived in poverty • 2006 – less than 9% lived in poverty • Income • 37% of elder income from Social Security • 15% asset income • 18% pension income • 28% earnings
  • 28.
  • 29.
    Housing • Most livein adequate, affordable housing • 80% own, 20% rent • Elder homes are more likely to be older, more likely to have lower value, in great need for repairs, less likely to have central heat/air • 30% of elders pay more for housing than they can afford
  • 30.
    Health Profile • Healthstatus of elders has improved over the years (living longer and functional health) • Chronically disabled has been decreasing • Health status usually not as good as younger counterparts
  • 31.
    Mortality • Top causesof death for elders (responsible for 2/3 of deaths) • Heart disease • Cancer • Stroke • CLRD • Alzheimer’s Disease • Decline in CVD deaths causes less mortality
  • 32.
    Medicare enrollees > 65 • 1 in 5 men and 1 in 3 women can’t • Walk 2 blocks • Write • Kneel • Reach overhead • Lift 10 lbs
  • 33.
    Morbidity • Activity limitationsincrease with age • Chronic conditions • Substantial burden on health and economic status of individuals, families, and nation • 1/3 report limitation of activity due to chronic conditions • Impairments • Very prevalent in older adults • May be sensory, physical, memory
  • 34.
    Health Behaviors andLifestyle Choices • Generally have more favorable health behaviors than younger counterparts • Less likely to consume large amounts of alcohol, smoke cigarettes, or be overweight • Areas for improvement • Physical activity, immunizations and nutrition
  • 35.
    • 22% >65 do physical activity • 10% > 85% • Also vaccines
  • 36.
    Figure B01: HealthyPeople 2020 U.S. Department of Health and Human Services, Office of Disease Prevention and Health Promotion (2010). Healthy People 2020. Available at http://www.healthypeople.gov/2020/default.aspx. Accessed December 2, 2010.
  • 38.
    Elder Abuse andNeglect • Reports have increased greatly in recent years • All states have set up reporting systems • Special problem for elders • May be frail • Unable to defend themselves • Vulnerable to telemarketing and mail scams • Most common victims of theft of benefit checks
  • 39.
    Instrumental Needs ofElders • Six instrumental needs that determine lifestyle for people of all ages; aging process can alter needs in unpredictable ways • Income • Housing • Personal care • Health care • Transportation • Community facilities and services
  • 40.
    Income • Change intypes of expenses in elder years • Social Security is major source of income for ~2/3 of recipients; 90% of income for 1/3 • Nonmarried women and minorities have highest rates of poverty • But need home, health $
  • 41.
    Housing • Major needs:appropriateness, accessibility, adequacy, affordability • Needs are intertwined • Changing place of residence can have negative effect on elder and family members • Group housing • Nursing homes, Eden Alternative facilities, Green Houses, retirement communities, CCRCs, assisted-living
  • 42.
    Personal Care • Fourlevels of tasks that may need assistance: • Instrumental tasks, expressive tasks, cognitive tasks, tasks of daily living • Activities of daily living (ADLs) to measure functional limitations • Instrumental activities of daily living (IADLs) to measure more complex tasks • Caregiver issues • Caregiver services
  • 43.
    ADLs activities of daily living • These measure functional limitations • Examples are • Eating • Toilet function • Bathing • Walking • Out of bed
  • 44.
    Health Care • Eldersheaviest users of health care services • Use of health care services increases with age • Most money spent on health care is in last years of life • Medicare primary source of payment for health care services of elders • Will see major changes in future years
  • 45.
    Transportation • Transportation allowselders to remain independent • On average, elders live 10 year after they stop driving • Greatest influence on transportation needs: • income and health status • Many public transportation challenges • Solutions for transportation needs of elders
  • 46.
    Community Facilities andServices • Older Americans Act of 1965 (OAA) to increase services and protect rights of elders • National nutrition programs for elders • State and Area Agencies on Aging • Other programs • Services can vary greatly across the country
  • 47.
    Community Facilities andServices • Meal service • Homemaker service • Chore and home maintenance • Visitor service • Adult day care • Respite care • Home health care • Senior centers
  • 48.
    Discussion Questions • Whatcan happen to increase the likelihood of elders utilizing community facilities and services? • How will the changing demographics of elders affect health care services?