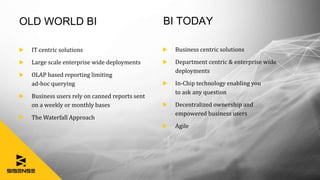
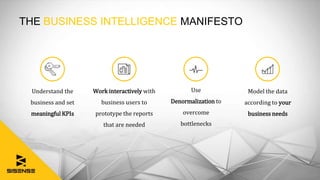
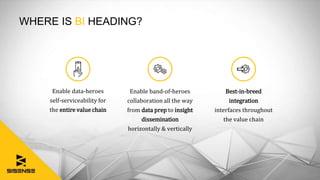
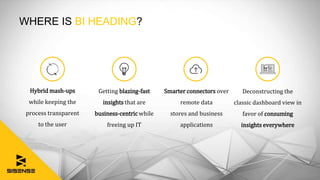
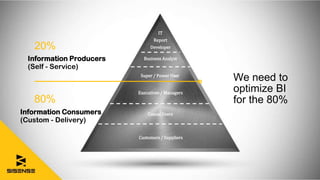
The “Old” world of BI, with its IT-centric solutions, OLAP-based reporting, and limited ad-hoc querying, has a lot of shortcomings that inhibit self-service BI. Yet, with increasing data complexity has come a new age of BI that is focused on taking strides to provide faster, more data-driven and integrated solutions to try and empower the business user.
More information can be found at sisense.com
1. OLD VS. NEW:
BUSINESS PROFESSIONALS AND
THEIR KPIS
Wednesday, Sep 14th
Ani Manian | Head of Product Strategy, Sisense
SISENSE PRESENTS
2. OLD WORLD BI
IT centric solutions
Large scale enterprise wide deployments
OLAP based reporting limiting
ad-hoc querying
Business users rely on canned reports sent
on a weekly or monthly bases
The Waterfall Approach
Business centric solutions
Department centric & enterprise wide
deployments
In-Chip technology enabling you
to ask any question
Decentralized ownership and
empowered business users
Agile
BI TODAY
3. THE NEW AGE OF DATA COMPLEXITY
• Modern businesses are increasingly becoming more data driven
• Business questions are steadily increasing in complexity
• Volume of data growing faster than ever before
• Data-sources are significantly more diverse
Cloud EDW
Cloud Applications
Big databases
Lakes
Data-science
4. THE BUSINESS INTELLIGENCE MANIFESTO
Understand the
business and set
meaningful KPIs
Work interactively with
business users to
prototype the reports
that are needed
Use
Denormalization to
overcome
bottlenecks
Model the data
according to your
business needs
5. Enable data-heroes
self-serviceability for
the entire value chain
Best-in-breed
integration
interfaces throughout
the value chain
Enable band-of-heroes
collaboration all the way
from data prep to insight
dissemination
horizontally & vertically
WHERE IS BI HEADING?
6. WHERE IS BI HEADING?
Hybrid mash-ups
while keeping the
process transparent
to the user
Getting blazing-fast
insights that are
business-centric while
freeing up IT
Deconstructing the
classic dashboard view in
favor of consuming
insights everywhere
Smarter connectors over
remote data
stores and business
applications
7. We need to
optimize BI
for the 80%
20%
80%
Information Producers
(Self - Service)
IT
Report
Developer
Business Analyst
Super / Power User
Executives / Managers
Casual Users
Customers / Suppliers
Information Consumers
(Custom - Delivery)
8. THE RELATIONSHIP BETWEEN
BUSINESS PROFESSIONALS AND
THEIR KPIS
We asked hundreds of business professionals how they interact with their data and KPIs
9. ALMOST HALF OF ALL RESPONDENTS
CHECK KPIS DAILY
How often do you check the status of your KPIs?
10. 83% OF RESPONDENTS USE OR WANT
TO USE COLOR CODING
Do you use color-coding in the way you display data?
11. VISUAL ALERTS ARE
THE MOST EFFECTIVE,
ACCORDING TO MORE
THAN HALF OF
RESPONDENTS
Which type of alert is best in driving
you to action?
16. THE NEXT REALM
OF BUSINESS
ANALYTICS
Analyzing data should no longer require
being anchored to a screen. Business users
want their devices to broadcast KPIs to their
senses, making consumption of insights
immediate and simple.
17. IMAGINE A WORLD..
Imagine you're driving to work and can ask your voice-
operated BI assistant: "What is my sales target for today?"
18. IMAGINE A
WORLD..Imagine being able to focus your entire team on improving customer
satisfaction just by having them glance at a smart bulb, green means on target
and red means take action.
19. IMAGINE A WORLD..
Imagine stepping into a conference room for
a quarterly business review and experiencing your
data insights hovering around you.
20. SISENSE BRINGS IMAGINATION TO LIFE
With a new line of devices that present insights unlike any
dashboard environment
SISENSE
LAMP
SISENSE
ENABLED ECHO
21. SIMPLIFYING BUSINESS INTELLIGENCE
MAINTAIN
FOCUS
Keep teams focused on
a common goal and in touch
with your business.
GAIN CONSTANT
VISIBILITY
Know what’s happening,
wherever you are,
in an instant.
MAKE DATA
DRIVEN
DECISIONSAct swiftly on what’s
important.