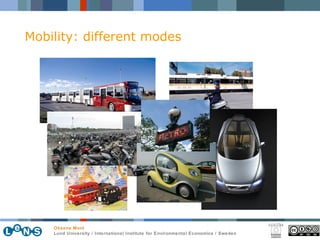
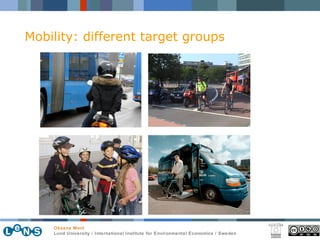
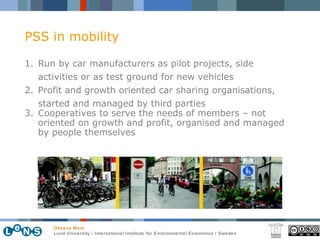
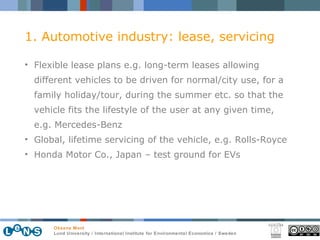
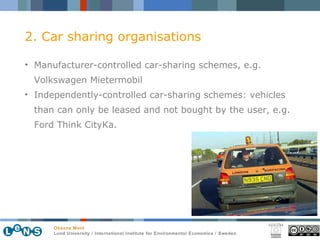
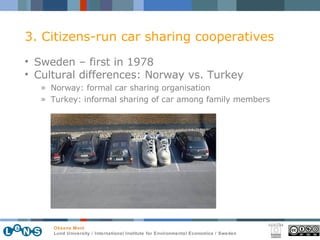
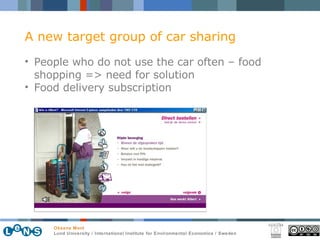
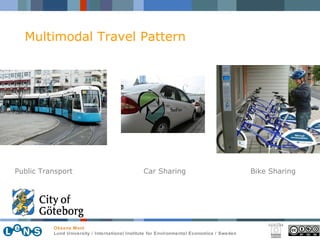
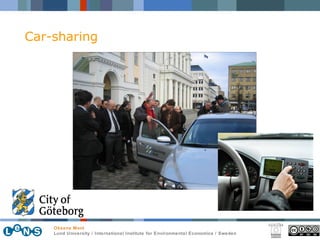
course/learning collection L. THEMATIC CLUSTERS subject L2. Mobility learning resource Sustainable Mobility contributors: Associate Prof. Oksana Mont Lund University / International Institute for Environmental Economics / Sweden LeNS, the Learning Network on Sustainability: Asian-European multi-polar network for curricula development on Design for Sustainability focused on product service system innovation.  Funded by the Asia-Link Programme, EuroAid, European Commission.
EEA 2005 Transport is responsible for 13.5% of global greenhouse gas emissions (WRI 2004). Focus area: Mobility
public and private transportation,  freight transportation,  railway service,  aviation,  alternative vehicles and fuels,  emissions during use, disposal of vehicles,  safety etc. Mobility: aspects
Mobility: trends All images are from Wikimedia Commons
Mobility: trends
 
Loan in 5 min Apply easy and fast here. And 10 – 35 000 Euro will be on the way to you!!!
Actions – addressing impacts of increasing transport volume from personal mobility Technological optimism: robotisation of production Technological pessimism: only improving production efficiency will not do Product innovation is vital – 80% of env. impact Service innovation is almost untouched in real terms Selling value is a marketing terms rather than innovation at product, service or system level Globalisation vs. localisation/distributed economies
Fussler (1996) Product innovation is vital ! Exhaust 35% Rolling resistance 4.2% Air resistance 10.5% Accelerate and climb 4.3% Fuel energy 100% Radiation 20% Cooling water 20% Movement 19% Deadweight 17% Personal mobility ? % Bearings  6% Is that what I pay my money for???
Average European car is used for 29 min a day In 12 years of car life it is used in total for 3 month, after which it is discarded Average speed of cars in centers of European cities is 17 km/hour => it is faster to take  a bike Service innovation is vital !
 
Importance of systems thinking
Mobility: different scale Urban – countryside Large city – small city Long-distances – short distances Types of trips: city to city,  city to suburbs/suburbs to city,  suburbs to suburbs Individual vs. collective
Mobility: different modes
Mobility: different target groups
PSS in mobility Run by car manufacturers as pilot projects, side activities or as test ground for new vehicles Profit and growth oriented car sharing organisations,  started and managed by third parties Cooperatives to serve the needs of members – not oriented on growth and profit,  organised and managed by people themselves
1. Automotive industry: lease, servicing Flexible lease plans e.g. long-term leases allowing different vehicles to be driven for normal/city use, for a family holiday/tour, during the summer etc. so that the vehicle fits the lifestyle of the user at any given time, e.g. Mercedes-Benz Global, lifetime servicing of the vehicle, e.g. Rolls-Royce Honda Motor Co., Japan – test ground for EVs
2. Car sharing organisations Manufacturer-controlled car-sharing schemes, e.g. Volkswagen Mietermobil Independently-controlled car-sharing schemes: vehicles than can only be leased and not bought by the user, e.g. Ford Think CityKa.
3. Citizens-run car sharing cooperatives Sweden – first in 1978 Cultural differences: Norway vs. Turkey Norway: formal car sharing organisation Turkey: informal sharing of car among family members
Car sharing Regulatory Dutch Policy Plan on the Environment and the Economy  EC Green Paper “Citizens’ Networks”  National Road Administrations  –  research Creation of parking places for CSO Stattauto (G), Helsinki municipality - City Car Sharing   Normative Promotion as part of the total mobility solution -  Bremer Karte plus AutoCard  Extension with food delivery services*
A new target group of car sharing People who do not use the car often – food shopping => need for solution Food delivery subscription
http://www.siemens.nl/hdb/ Siemens HomeDeliveryBox
Car sharing Product Design is not adapted, test ground for E v s CS cars are    22% lighter & 24% more fuel efficient than average car in the Netherlands  Service Booking, choice of vehicles, one for all card, ICT Infrastructure Parking spaces Network Cooperation with railways, rental, network of CSOs
Car sharing Customer acceptance Factors affecting:  savings, no initial investment, various models, flexibility of use, no maintenance, free parking places, insurance and environmentally sound image  Changing customer profile, subsidise driving lessons for young people Business viability   Cooperatives vs. commercial companies Appeal to other players: public transportation companies & car manufacturers Environmental soundness   N of cars  ⇓  by 44%, distances  ⇓  by 30-60%, more selective use of cars, cost transparency
Job-place swaping Teleworking & videoconferencing Ordering food and its delivery online Re-invention of city centres But what about holiday trips to Tailand  once a year? Other ways of reducing travel
 
 
September 22 Car free cities  http://www.worldcarfree.net/wcfd/ Car free day
 
City of Göteborg: mobility management
Objective Trips with Public Transport & Bicycle should increase compared to singel car use
Potential 1100 trips per person and year to influence
Car trips 50 %  of them are shorter than 5 km
Car Sharing Bike Sharing Public Transport Multimodal Travel Pattern
Public Transport
Cycling
Car-sharing
Exercise: mobility need of babies Develop a product-service system for B2C (business-to-consumer) market that satisfies  “mobility need of babies”  based on the following steps: Need Current system to satisfy the need and its environmental impact Innovative approaches Actors involved Present the new PSS according to the PSS framework: products and services involved, networks of actors, needed infrastructures Audience: what are the strong and weak sides of the suggested solution?
Present and comment! Think critically and creatively!
Mobility of babies
Mature product & market High quality/exclusive 25-35% of market turnover - from new prams  Big second hand market :  65-75% - second-hand products Prams go out of fashion, not out of shape 3 in 1 – convertible (s+s+l), 36 months  2 in 1 – convertible (s+s), 36 months Conventional sleeping - 8-12 months  Conventional sitting stroller - 6-12 months Pram market
Designed to serve 4 babies The chassis will last for at least 8 users Suitable design: 118 textiles and 4 chassis colours (clothing fashion vs. timeless design) Manufactured and sold once, but… sold several times at the second-hand market. William Kent, a garden architect from England, designed the first known baby carriage for the third Duke of Devonshire in 1733.   Why baby pram?
Prams world: depreciation rate The depreciation of the prams after the first user is 35-50% depending on model, use and maintenance.
x 8 (Leasing) From 4 owners to 8 users
Higher end market => high recovery value  Mature products  Standardisation of chassis and textiles Shift to aluminium tubes – no welding Direct link between producer and retailers Chassis could serve at least 50% > time, as well as the basket  Suitability for refurbishing
Producers are better suited for remanufacturing full information on design, construction, expected durability and reliability established distribution network established supplier network for spare parts general knowledge of consumers, use patterns potential to generate synergy with original production possibility to improve remanufacturability of product at the design stage Who is to remanufacture?
Retailers are better suited for refurbishing Situated closer to customers & established contacts with customers Basic information on design, construction, expected durability and reliability Established distribution network Potential to reduce transportation But,  problems with refurbishing Labour intensity of inspection, disassembly and upgrading  Producers are moving to cheaper labour markets Substantial refurbishing is unfeasible Sufficient to “as new condition” Who is to refurbish?
Need to change the design of the basket to allow for easy upgrading (worn out or fashion) Interior lining Wind stopper  Hood (outer lining)  Side pockets Wheels How to make the system work? Producer Retailer Customer   New pram New pram Return used pram Refurbished pram
Jacobsson, 2000 Material and information flows  Reprocessing feedback & need for exchange parts, plus leasing contract data Producer Retailer Customer New Pram New Pram Return Used Pram Reconditioned Pram Return exchange parts New exchange parts Reprocessing updates & Expected returns User feedback & estimated remaining period of usage User instructions, periodic invoice w. company and product information Material Flows Information Flows
Leasing has higher profits than sales (18-35 Euro/month, estimated for 4 years), highest – 4 times – need to share between 2 actors Producers need to account for: Transport of parts – small part of pram transportation Retailer education Financial flow is different – need to finance first years, deposition charge may help For retailers: 30 min for refurbishing – labour costs & administration of the system, revenues: % of leasing fee & indirect revenues Financial analysis
Leasing fee Selling the pram after its leasing time Interest Indirect revenues (auxiliary & other products) Depend on: Cost of manufacturing Cost of reconditioning Cost for handling invoices etc. Depreciation (tax rules)   Interest Security Revenue
Regulatory Since 1920s,  Swedish Housewives' Association, governmental reports, guides on equipment Normative Standards of cleanliness, wash more often, less amount/time, but increasing total volume Built in communities – standard Raising prestige Washing centres
Product Smaller models, suited for fractions, semi-prof., more efficient Service 25-30 flats, booking, opening hours, payment Infrastructure Part of community planning (in Sweden,  link to mobility? ) Network Producers, service provider, real estate company or housing association Support from producers to providers Washing centres
Customer acceptance Households are satisfied with the distance to the washing centre (70%), with the availability of washing time (50%), with the quality of equipment (76%), and with the cleanliness of the centre (40%).  Business viability  For producers, housing association: economics vs. environmental parameters. Environmental soundness  Increase of laundry: 290 kg in 1930s to 700 kg in  1980s.  Dubious result: due to the use of driers Washing centres
Thank you for your attention …

Oksana Mont_Sustainable Mobility

  • 1.
    course/learning collection L.THEMATIC CLUSTERS subject L2. Mobility learning resource Sustainable Mobility contributors: Associate Prof. Oksana Mont Lund University / International Institute for Environmental Economics / Sweden LeNS, the Learning Network on Sustainability: Asian-European multi-polar network for curricula development on Design for Sustainability focused on product service system innovation. Funded by the Asia-Link Programme, EuroAid, European Commission.
  • 2.
    EEA 2005 Transportis responsible for 13.5% of global greenhouse gas emissions (WRI 2004). Focus area: Mobility
  • 3.
    public and privatetransportation, freight transportation, railway service, aviation, alternative vehicles and fuels, emissions during use, disposal of vehicles, safety etc. Mobility: aspects
  • 4.
    Mobility: trends Allimages are from Wikimedia Commons
  • 5.
  • 6.
  • 7.
    Loan in 5min Apply easy and fast here. And 10 – 35 000 Euro will be on the way to you!!!
  • 8.
    Actions – addressingimpacts of increasing transport volume from personal mobility Technological optimism: robotisation of production Technological pessimism: only improving production efficiency will not do Product innovation is vital – 80% of env. impact Service innovation is almost untouched in real terms Selling value is a marketing terms rather than innovation at product, service or system level Globalisation vs. localisation/distributed economies
  • 9.
    Fussler (1996) Productinnovation is vital ! Exhaust 35% Rolling resistance 4.2% Air resistance 10.5% Accelerate and climb 4.3% Fuel energy 100% Radiation 20% Cooling water 20% Movement 19% Deadweight 17% Personal mobility ? % Bearings 6% Is that what I pay my money for???
  • 10.
    Average European caris used for 29 min a day In 12 years of car life it is used in total for 3 month, after which it is discarded Average speed of cars in centers of European cities is 17 km/hour => it is faster to take a bike Service innovation is vital !
  • 11.
  • 12.
  • 13.
    Mobility: different scaleUrban – countryside Large city – small city Long-distances – short distances Types of trips: city to city, city to suburbs/suburbs to city, suburbs to suburbs Individual vs. collective
  • 14.
  • 15.
  • 16.
    PSS in mobilityRun by car manufacturers as pilot projects, side activities or as test ground for new vehicles Profit and growth oriented car sharing organisations, started and managed by third parties Cooperatives to serve the needs of members – not oriented on growth and profit, organised and managed by people themselves
  • 17.
    1. Automotive industry:lease, servicing Flexible lease plans e.g. long-term leases allowing different vehicles to be driven for normal/city use, for a family holiday/tour, during the summer etc. so that the vehicle fits the lifestyle of the user at any given time, e.g. Mercedes-Benz Global, lifetime servicing of the vehicle, e.g. Rolls-Royce Honda Motor Co., Japan – test ground for EVs
  • 18.
    2. Car sharingorganisations Manufacturer-controlled car-sharing schemes, e.g. Volkswagen Mietermobil Independently-controlled car-sharing schemes: vehicles than can only be leased and not bought by the user, e.g. Ford Think CityKa.
  • 19.
    3. Citizens-run carsharing cooperatives Sweden – first in 1978 Cultural differences: Norway vs. Turkey Norway: formal car sharing organisation Turkey: informal sharing of car among family members
  • 20.
    Car sharing RegulatoryDutch Policy Plan on the Environment and the Economy EC Green Paper “Citizens’ Networks” National Road Administrations – research Creation of parking places for CSO Stattauto (G), Helsinki municipality - City Car Sharing Normative Promotion as part of the total mobility solution - Bremer Karte plus AutoCard Extension with food delivery services*
  • 21.
    A new targetgroup of car sharing People who do not use the car often – food shopping => need for solution Food delivery subscription
  • 22.
  • 23.
    Car sharing ProductDesign is not adapted, test ground for E v s CS cars are  22% lighter & 24% more fuel efficient than average car in the Netherlands Service Booking, choice of vehicles, one for all card, ICT Infrastructure Parking spaces Network Cooperation with railways, rental, network of CSOs
  • 24.
    Car sharing Customeracceptance Factors affecting: savings, no initial investment, various models, flexibility of use, no maintenance, free parking places, insurance and environmentally sound image Changing customer profile, subsidise driving lessons for young people Business viability Cooperatives vs. commercial companies Appeal to other players: public transportation companies & car manufacturers Environmental soundness N of cars ⇓ by 44%, distances ⇓ by 30-60%, more selective use of cars, cost transparency
  • 25.
    Job-place swaping Teleworking& videoconferencing Ordering food and its delivery online Re-invention of city centres But what about holiday trips to Tailand once a year? Other ways of reducing travel
  • 26.
  • 27.
  • 28.
    September 22 Carfree cities http://www.worldcarfree.net/wcfd/ Car free day
  • 29.
  • 30.
    City of Göteborg:mobility management
  • 31.
    Objective Trips withPublic Transport & Bicycle should increase compared to singel car use
  • 32.
    Potential 1100 tripsper person and year to influence
  • 33.
    Car trips 50% of them are shorter than 5 km
  • 34.
    Car Sharing BikeSharing Public Transport Multimodal Travel Pattern
  • 35.
  • 36.
  • 37.
  • 38.
    Exercise: mobility needof babies Develop a product-service system for B2C (business-to-consumer) market that satisfies “mobility need of babies” based on the following steps: Need Current system to satisfy the need and its environmental impact Innovative approaches Actors involved Present the new PSS according to the PSS framework: products and services involved, networks of actors, needed infrastructures Audience: what are the strong and weak sides of the suggested solution?
  • 39.
    Present and comment!Think critically and creatively!
  • 40.
  • 41.
    Mature product &market High quality/exclusive 25-35% of market turnover - from new prams Big second hand market : 65-75% - second-hand products Prams go out of fashion, not out of shape 3 in 1 – convertible (s+s+l), 36 months 2 in 1 – convertible (s+s), 36 months Conventional sleeping - 8-12 months Conventional sitting stroller - 6-12 months Pram market
  • 42.
    Designed to serve4 babies The chassis will last for at least 8 users Suitable design: 118 textiles and 4 chassis colours (clothing fashion vs. timeless design) Manufactured and sold once, but… sold several times at the second-hand market. William Kent, a garden architect from England, designed the first known baby carriage for the third Duke of Devonshire in 1733. Why baby pram?
  • 43.
    Prams world: depreciationrate The depreciation of the prams after the first user is 35-50% depending on model, use and maintenance.
  • 44.
    x 8 (Leasing)From 4 owners to 8 users
  • 45.
    Higher end market=> high recovery value Mature products Standardisation of chassis and textiles Shift to aluminium tubes – no welding Direct link between producer and retailers Chassis could serve at least 50% > time, as well as the basket Suitability for refurbishing
  • 46.
    Producers are bettersuited for remanufacturing full information on design, construction, expected durability and reliability established distribution network established supplier network for spare parts general knowledge of consumers, use patterns potential to generate synergy with original production possibility to improve remanufacturability of product at the design stage Who is to remanufacture?
  • 47.
    Retailers are bettersuited for refurbishing Situated closer to customers & established contacts with customers Basic information on design, construction, expected durability and reliability Established distribution network Potential to reduce transportation But, problems with refurbishing Labour intensity of inspection, disassembly and upgrading Producers are moving to cheaper labour markets Substantial refurbishing is unfeasible Sufficient to “as new condition” Who is to refurbish?
  • 48.
    Need to changethe design of the basket to allow for easy upgrading (worn out or fashion) Interior lining Wind stopper Hood (outer lining) Side pockets Wheels How to make the system work? Producer Retailer Customer New pram New pram Return used pram Refurbished pram
  • 49.
    Jacobsson, 2000 Materialand information flows Reprocessing feedback & need for exchange parts, plus leasing contract data Producer Retailer Customer New Pram New Pram Return Used Pram Reconditioned Pram Return exchange parts New exchange parts Reprocessing updates & Expected returns User feedback & estimated remaining period of usage User instructions, periodic invoice w. company and product information Material Flows Information Flows
  • 50.
    Leasing has higherprofits than sales (18-35 Euro/month, estimated for 4 years), highest – 4 times – need to share between 2 actors Producers need to account for: Transport of parts – small part of pram transportation Retailer education Financial flow is different – need to finance first years, deposition charge may help For retailers: 30 min for refurbishing – labour costs & administration of the system, revenues: % of leasing fee & indirect revenues Financial analysis
  • 51.
    Leasing fee Sellingthe pram after its leasing time Interest Indirect revenues (auxiliary & other products) Depend on: Cost of manufacturing Cost of reconditioning Cost for handling invoices etc. Depreciation (tax rules) Interest Security Revenue
  • 52.
    Regulatory Since 1920s, Swedish Housewives' Association, governmental reports, guides on equipment Normative Standards of cleanliness, wash more often, less amount/time, but increasing total volume Built in communities – standard Raising prestige Washing centres
  • 53.
    Product Smaller models,suited for fractions, semi-prof., more efficient Service 25-30 flats, booking, opening hours, payment Infrastructure Part of community planning (in Sweden, link to mobility? ) Network Producers, service provider, real estate company or housing association Support from producers to providers Washing centres
  • 54.
    Customer acceptance Householdsare satisfied with the distance to the washing centre (70%), with the availability of washing time (50%), with the quality of equipment (76%), and with the cleanliness of the centre (40%). Business viability For producers, housing association: economics vs. environmental parameters. Environmental soundness Increase of laundry: 290 kg in 1930s to 700 kg in 1980s. Dubious result: due to the use of driers Washing centres
  • 55.
    Thank you foryour attention …