SlideShare a Scribd company logo
OFFSHORE STRUCTURES
Analysis and Design
Dr.S.Nallayarasu
Associate Professor
Department of Ocean Engineering
Indian Institute of Technology Madras,
Chennai - 600036, India
2
Contents
1 INTRODUCTION 9
1.1 General . . . . . . . . . . . . . . . . . . . . . . . . . . . . . . . . . . . . . . 9
1.2 Types of Offshore Structures . . . . . . . . . . . . . . . . . . . . . . . . . . . 10
1.3 Fixed Platforms . . . . . . . . . . . . . . . . . . . . . . . . . . . . . . . . . . 11
1.3.1 Steel template Structures . . . . . . . . . . . . . . . . . . . . . . . . . 11
1.3.2 Concrete Gravity Platforms . . . . . . . . . . . . . . . . . . . . . . . 11
1.4 Compliant Structures . . . . . . . . . . . . . . . . . . . . . . . . . . . . . . . 15
1.4.1 Compliant Tower . . . . . . . . . . . . . . . . . . . . . . . . . . . . . 15
1.4.2 Guyed Tower . . . . . . . . . . . . . . . . . . . . . . . . . . . . . . . 16
1.4.3 Tension Leg Platforms . . . . . . . . . . . . . . . . . . . . . . . . . . 16
1.4.4 Articulated Tower . . . . . . . . . . . . . . . . . . . . . . . . . . . . . 17
1.5 Floating Structures . . . . . . . . . . . . . . . . . . . . . . . . . . . . . . . . 18
1.5.1 Floating Production System . . . . . . . . . . . . . . . . . . . . . . . 18
1.5.2 Floating Production, Storage and offloading System . . . . . . . . . . 19
1.6 Subsea System . . . . . . . . . . . . . . . . . . . . . . . . . . . . . . . . . . 19
1.7 Fixed Platform Concepts . . . . . . . . . . . . . . . . . . . . . . . . . . . . . 20
1.7.1 Functional Classification . . . . . . . . . . . . . . . . . . . . . . . . . 20
1.7.2 Geometrical Classification . . . . . . . . . . . . . . . . . . . . . . . . 20
3
Contents Contents
1.7.3 Foundation Concepts . . . . . . . . . . . . . . . . . . . . . . . . . . . 21
2 DESIGN METHODOLOGY 23
2.1 General . . . . . . . . . . . . . . . . . . . . . . . . . . . . . . . . . . . . . . 23
2.2 Design Stages . . . . . . . . . . . . . . . . . . . . . . . . . . . . . . . . . . . 24
2.2.1 FEED . . . . . . . . . . . . . . . . . . . . . . . . . . . . . . . . . . . 24
2.2.2 Basic Design . . . . . . . . . . . . . . . . . . . . . . . . . . . . . . . . 24
2.2.3 Detailed Design . . . . . . . . . . . . . . . . . . . . . . . . . . . . . . 25
3 LOADS 29
3.1 General . . . . . . . . . . . . . . . . . . . . . . . . . . . . . . . . . . . . . . 29
3.2 Types of Loads . . . . . . . . . . . . . . . . . . . . . . . . . . . . . . . . . . 29
3.3 Gravity Loads . . . . . . . . . . . . . . . . . . . . . . . . . . . . . . . . . . . 30
3.3.1 Dead Loads . . . . . . . . . . . . . . . . . . . . . . . . . . . . . . . . 30
3.3.2 Facility Dead Loads . . . . . . . . . . . . . . . . . . . . . . . . . . . . 30
3.3.3 Fluid Loads . . . . . . . . . . . . . . . . . . . . . . . . . . . . . . . . 30
3.3.4 Live Loads . . . . . . . . . . . . . . . . . . . . . . . . . . . . . . . . . 31
3.3.5 Drilling Loads . . . . . . . . . . . . . . . . . . . . . . . . . . . . . . . 31
3.4 Environmental Loads . . . . . . . . . . . . . . . . . . . . . . . . . . . . . . . 31
3.4.1 Wind Loads . . . . . . . . . . . . . . . . . . . . . . . . . . . . . . . . 31
3.4.2 Wave and Current Loads . . . . . . . . . . . . . . . . . . . . . . . . . 34
3.4.3 Current Profile . . . . . . . . . . . . . . . . . . . . . . . . . . . . . . 35
3.4.4 Marine Growth . . . . . . . . . . . . . . . . . . . . . . . . . . . . . . 36
3.4.5 Morison Equation . . . . . . . . . . . . . . . . . . . . . . . . . . . . . 37
3.4.6 Wave-Current Interaction . . . . . . . . . . . . . . . . . . . . . . . . 37
4
Contents Contents
3.4.7 Selection of Wave Theory . . . . . . . . . . . . . . . . . . . . . . . . 38
3.4.8 Wave Load on a Member . . . . . . . . . . . . . . . . . . . . . . . . . 39
3.4.9 Maximum Global Loads . . . . . . . . . . . . . . . . . . . . . . . . . 44
3.4.10 Buoyancy Loads . . . . . . . . . . . . . . . . . . . . . . . . . . . . . . 45
3.4.11 Ice Loads . . . . . . . . . . . . . . . . . . . . . . . . . . . . . . . . . 47
3.4.12 Mud Loads . . . . . . . . . . . . . . . . . . . . . . . . . . . . . . . . 48
3.5 Load Estimation and Distribution . . . . . . . . . . . . . . . . . . . . . . . . 49
3.6 Load Combinations . . . . . . . . . . . . . . . . . . . . . . . . . . . . . . . . 51
4 MATERIALS AND CORROSION 53
4.1 General . . . . . . . . . . . . . . . . . . . . . . . . . . . . . . . . . . . . . . 53
4.2 Structural Steel . . . . . . . . . . . . . . . . . . . . . . . . . . . . . . . . . . 54
4.2.1 Structural Member Classification . . . . . . . . . . . . . . . . . . . . 54
4.2.2 Steel Grades . . . . . . . . . . . . . . . . . . . . . . . . . . . . . . . . 54
4.2.3 Manufacturing . . . . . . . . . . . . . . . . . . . . . . . . . . . . . . 56
4.2.4 Chemical Requirements . . . . . . . . . . . . . . . . . . . . . . . . . 56
4.2.5 Carbon Equivalent (CE) . . . . . . . . . . . . . . . . . . . . . . . . . 56
4.2.6 Mechanical Requirements . . . . . . . . . . . . . . . . . . . . . . . . 57
4.2.7 Notch Toughness Requirements . . . . . . . . . . . . . . . . . . . . . 57
4.2.8 Supplementary Requirements . . . . . . . . . . . . . . . . . . . . . . 57
4.3 Corrosion . . . . . . . . . . . . . . . . . . . . . . . . . . . . . . . . . . . . . 57
4.3.1 Seawater Corrosion . . . . . . . . . . . . . . . . . . . . . . . . . . . . 57
4.3.2 Factors influencing corrosion . . . . . . . . . . . . . . . . . . . . . . . 58
4.3.3 types of corrosion . . . . . . . . . . . . . . . . . . . . . . . . . . . . . 60
4.3.4 Rates of corrosion . . . . . . . . . . . . . . . . . . . . . . . . . . . . . 61
5
Contents Contents
4.4 Corrosion Protection . . . . . . . . . . . . . . . . . . . . . . . . . . . . . . . 62
4.5 Cathodic Protection . . . . . . . . . . . . . . . . . . . . . . . . . . . . . . . 62
4.5.1 Sacrificial Anode System . . . . . . . . . . . . . . . . . . . . . . . . . 63
5 SIMULATION 67
5.1 General . . . . . . . . . . . . . . . . . . . . . . . . . . . . . . . . . . . . . . 67
5.2 Structure Geometry selection . . . . . . . . . . . . . . . . . . . . . . . . . . 68
5.3 Geometry Simulation . . . . . . . . . . . . . . . . . . . . . . . . . . . . . . . 68
5.3.1 Axis System . . . . . . . . . . . . . . . . . . . . . . . . . . . . . . . . 69
5.3.2 Joints or Nodes . . . . . . . . . . . . . . . . . . . . . . . . . . . . . . 69
5.3.3 Members and properties . . . . . . . . . . . . . . . . . . . . . . . . . 70
5.3.4 Offsets and Eccentricities . . . . . . . . . . . . . . . . . . . . . . . . . 71
5.3.5 Wish-bone Connections . . . . . . . . . . . . . . . . . . . . . . . . . . 71
5.3.6 Dummy Structure Models . . . . . . . . . . . . . . . . . . . . . . . . 72
5.4 Foundation Simulation . . . . . . . . . . . . . . . . . . . . . . . . . . . . . . 75
5.4.1 Pile Modelling . . . . . . . . . . . . . . . . . . . . . . . . . . . . . . . 75
5.4.2 Soil Simulation . . . . . . . . . . . . . . . . . . . . . . . . . . . . . . 77
5.4.3 Pile Group Effect . . . . . . . . . . . . . . . . . . . . . . . . . . . . . 77
5.5 Load Simulation . . . . . . . . . . . . . . . . . . . . . . . . . . . . . . . . . . 80
5.5.1 Dead Loads . . . . . . . . . . . . . . . . . . . . . . . . . . . . . . . . 80
5.5.2 Equipment Loads . . . . . . . . . . . . . . . . . . . . . . . . . . . . . 80
5.5.3 Fluid Loads . . . . . . . . . . . . . . . . . . . . . . . . . . . . . . . . 80
5.5.4 Drilling Loads . . . . . . . . . . . . . . . . . . . . . . . . . . . . . . . 81
5.5.5 Live Loads . . . . . . . . . . . . . . . . . . . . . . . . . . . . . . . . . 81
5.5.6 Wind, Wave and Current . . . . . . . . . . . . . . . . . . . . . . . . . 81
6
Contents Contents
6 In-place Analyses 85
6.1 Principle . . . . . . . . . . . . . . . . . . . . . . . . . . . . . . . . . . . . . . 85
6.2 Geometry Simulation . . . . . . . . . . . . . . . . . . . . . . . . . . . . . . . 86
6.2.1 Simplified Topside Model . . . . . . . . . . . . . . . . . . . . . . . . . 87
6.2.2 Load Simulation . . . . . . . . . . . . . . . . . . . . . . . . . . . . . 87
6.2.3 Topsides Load COG Shift Envelope . . . . . . . . . . . . . . . . . . . 88
6.2.4 Minimum and Maximum Water Depth . . . . . . . . . . . . . . . . . 88
6.2.5 Maximum Wave Loads . . . . . . . . . . . . . . . . . . . . . . . . . . 89
6.2.6 Allowable Stresses . . . . . . . . . . . . . . . . . . . . . . . . . . . . 89
7 Dynamic Analysis 91
7.1 Principle . . . . . . . . . . . . . . . . . . . . . . . . . . . . . . . . . . . . . . 91
7.2 Geometry Simulation . . . . . . . . . . . . . . . . . . . . . . . . . . . . . . . 91
7.3 Load Simulation . . . . . . . . . . . . . . . . . . . . . . . . . . . . . . . . . . 92
7.3.1 Computer Generated Mass . . . . . . . . . . . . . . . . . . . . . . . . 92
7.3.2 Direct Input Mass . . . . . . . . . . . . . . . . . . . . . . . . . . . . 92
7.4 Foundation Simulation . . . . . . . . . . . . . . . . . . . . . . . . . . . . . . 93
7.5 Solution . . . . . . . . . . . . . . . . . . . . . . . . . . . . . . . . . . . . . . 93
7.5.1 Dynamic Amplification factor . . . . . . . . . . . . . . . . . . . . . . 94
8 Fatigue Analysis 95
8.1 General . . . . . . . . . . . . . . . . . . . . . . . . . . . . . . . . . . . . . . 95
8.2 Deterministic Fatigue Analysis . . . . . . . . . . . . . . . . . . . . . . . . . . 95
8.3 Wave Scatter Data . . . . . . . . . . . . . . . . . . . . . . . . . . . . . . . . 96
8.4 Spectral Fatigue Analysis . . . . . . . . . . . . . . . . . . . . . . . . . . . . . 98
7
Contents Contents
8.4.1 Principle . . . . . . . . . . . . . . . . . . . . . . . . . . . . . . . . . . 98
8.4.2 Wave Spectra . . . . . . . . . . . . . . . . . . . . . . . . . . . . . . . 98
8.4.3 Wave Theory Selection . . . . . . . . . . . . . . . . . . . . . . . . . . 99
8.4.4 Wave Steepness . . . . . . . . . . . . . . . . . . . . . . . . . . . . . . 99
8.4.5 Transfer Functions . . . . . . . . . . . . . . . . . . . . . . . . . . . . 99
8.4.6 Selection of Frequencies . . . . . . . . . . . . . . . . . . . . . . . . . 100
8.4.7 Stress Amplitudes . . . . . . . . . . . . . . . . . . . . . . . . . . . . . 100
8.4.8 Fatigue Life Calculation . . . . . . . . . . . . . . . . . . . . . . . . . 101
8.4.9 S-N Curves . . . . . . . . . . . . . . . . . . . . . . . . . . . . . . . . 102
8.4.10 Stress Concentration Factors . . . . . . . . . . . . . . . . . . . . . . . 102
8.4.11 Foundation Linearisation . . . . . . . . . . . . . . . . . . . . . . . . . 104
9 Ship Impact Analysis 107
9.1 Impact Vessels . . . . . . . . . . . . . . . . . . . . . . . . . . . . . . . . . . . 107
9.2 Principle . . . . . . . . . . . . . . . . . . . . . . . . . . . . . . . . . . . . . . 108
9.3 Method of Computing Impact Energy Dissipation . . . . . . . . . . . . . . . 108
9.4 Energy dissipation by member . . . . . . . . . . . . . . . . . . . . . . . . . . 108
9.5 Energy Dissipation by Overall jacket deflection . . . . . . . . . . . . . . . . . 110
9.6 Structural Strength During Impact . . . . . . . . . . . . . . . . . . . . . . . 110
9.7 Push Over Analysis . . . . . . . . . . . . . . . . . . . . . . . . . . . . . . . . 110
8
Chapter 1
INTRODUCTION
1.1 General
One of the greatest discovery of 20th century was oil and it has so many applications that
it cannot be separated from mankind. The oil exploration has started as early as 1900 and
the oil exploration initially was concentrated on on land. As the need for oil expands in an
explosive rate, need for find new discoveries was eminent. During the middle of 20th century,
oil discovery started in near shore and medium range of water depth.
The need for qualified offshore structural personnel are rapidly increasing as the oil industry
moves into deeper water in the search for additional supplies of oil and gas, new technology
is emerging at a rapid peace for the development of new concepts for offshore platforms.
This book gives brief introduction to offshore engineering with basic concepts of various
types of offshore structures and provide insight into various design issues and requirements,
fabrication and installation techniques.
Chapter 1 gives introduction in to types of offshore platforms based on water depth require-
ments, geometry and installation concepts.
Chapter 2 gives some introduction to design methodology, and various design stages in a
offshore development project.
Chapter 3 gives basic loads applied on offshore structures and techniques of calculations of
such loading.
Chapter 4 gives introduction to material requirement for offshore structures including cor-
rosion.
9
1.2. Types of Offshore Structures Chapter 1. INTRODUCTION
Chapter 5 gives introduction to materials used for offshore structures, and corrosion and
cathodic protection.
Chapter 6 describes inplace analysis methodology, load combinations and and various prin-
ciples involved in the design.
Chapter 7 describes methodology to carry out the dynamic analysis of an offshore platform
and its application to fatigue and seismic analyses.
Chapter 8 gives method of fatigue analysis such as deterministic and spectral methods in-
cluding, selection of S-N curves, SCF equations etc.
Chapter 9 give some introduction in to ship impact with offshore platforms and method to
carry out push over analysis.
1.2 Types of Offshore Structures
The offshore structures built in the ocean to explore oil and gas are located in depths from
very shallow water to the deep ocean. Depending on the water depth and environmental
conditions, the structural arrangement and need for new ideas required. Based on geometry
and behaviour, the offshore structures for oil and gas development has been divided into
following categories.
1. Fixed Platforms
• Steel template Structures
• Concrete Gravity Structures
2. Compliant tower
• Compliant Tower
• Guyed Tower
• Articulated Tower
• Tension Leg Platform
3. Floating Structures
• Floating Production System
• Floating Production, Storage and Offloading System
10
1.3. Fixed Platforms Chapter 1. INTRODUCTION
1.3 Fixed Platforms
The fixed type of platform shall exhibit a low natural period and deflection again environ-
mental loads.
1.3.1 Steel template Structures
The steel template type structure consists of a tall vertical section made of tubular steel
members supported by piles driven into the sea be with a deck placed on top, providing space
for crew quarters, a drilling rig, and production facilities. The fixed platform is economically
feasible for installation in water depths up to 500m.
These template type structures will be fixed to seabed by means of tubular piles either driven
through legs of the jacket (main piles) or through skirt sleeves attached to the bottom of the
jacket.
The principle behind the fixed platform design is to minimize the natural period of the
structure below 4 seconds to avoid resonant behaviour with the waves (period in the order
of 4 to 25 seconds. The structural and foundation configuration shall be selected to achieve
this concept.
1.3.2 Concrete Gravity Platforms
Concrete gravity platforms are mostly used in the areas where feasibility of pile installation is
remote. These platforms are very common in areas with strong seabed geological conditions
either with rock outcrop or sandy formation.
Some part of north sea oil fields and Australian coast, these kind of platforms are located.
The concrete gravity platform by its name derive its horizontal stability against environmen-
tal forces by means of its weight. These structures are basically concrete shells assembled in
circular array with stem columns projecting to above water to support the deck and facilities.
Concrete gravity platforms have been constructed in water depths as much as 350m.
11
1.3. Fixed Platforms Chapter 1. INTRODUCTION
Figure 1.1: Different types of Offshore Structures
12
1.3. Fixed Platforms Chapter 1. INTRODUCTION
Figure 1.2: Fixed Template type platform
13
1.3. Fixed Platforms Chapter 1. INTRODUCTION
Figure 1.3: Concrete Gravity Platform
14
1.4. Compliant Structures Chapter 1. INTRODUCTION
Figure 1.4: Complaint Tower Platform
1.4 Compliant Structures
In addition to the developing technologies for exploration and production of oil and natural
gas, new concepts in deepwater systems and facilities have emerged to make ultra-deepwater
projects a reality. With wells being drilled in water depths of 3000m, the traditional fixed
offshore platform is being replaced by state-of-the-art deepwater production facilities. Com-
pliant Towers, Tension Leg Platforms, Spars, Subsea Systems, Floating Production Systems,
and Floating Production, Storage and Offloading Systems are now being used in water depths
exceeding 500m. All of these systems are proven technology, and in use in offshore production
worldwide.
1.4.1 Compliant Tower
Compliant Tower (CT) consists of a narrow, flexible tower and a piled foundation that
can support a conventional deck for drilling and production operations. Unlike the fixed
platform, the compliant tower withstands large lateral forces by sustaining significant lateral
deflections, and is usually used in water depths between 300m and 600m.
15
1.4. Compliant Structures Chapter 1. INTRODUCTION
Figure 1.5: Tension Leg Platforms
1.4.2 Guyed Tower
Guyed tower is an extension of complaint tower with guy wires tied to the seabed by means of
anchors or piles. This guy ropes minimises the lateral displacement of the platform topsides.
This further changes the dynamic characteristics of the system.
1.4.3 Tension Leg Platforms
A Tension-leg platform is a vertically moored floating structure normally used for the offshore
production of oil or gas, and is particularly suited for water depths around 1000m to 1200
metres (about 4000 ft). The platform is permanently moored by means of tethers or tendons
grouped at each of the structure’s corners. A group of tethers is called a tension leg. A
feature of the design of the tethers is that they have relatively high axial stiffness (low
elasticity), such that virtually all vertical motion of the platform is eliminated. This allows
the platform to have the production wellheads on deck (connected directly to the subsea
wells by rigid risers), instead of on the seafloor. This makes for a cheaper well completion
and gives better control over the production from the oil or gas reservoir.
Tension Leg Platform (TLP) consists of a floating structure held in place by vertical, ten-
16
1.4. Compliant Structures Chapter 1. INTRODUCTION
Figure 1.6: SeaStar
sioned tendons connected to the sea floor by pile-secured templates. Tensioned tendons
provide for the use of a TLP in a broad water depth range with limited vertical motion. The
larger TLP’s have been successfully deployed in water depths approaching 1250m.
Mini-Tension Leg Platform (Mini-TLP) is a floating mini-tension leg platform of relatively
low cost developed for production of smaller deepwater reserves which would be uneconomic
to produce using more conventional deepwater production systems. It can also be used as a
utility, satellite, or early production platform for larger deepwater discoveries. The world’s
first Mini-TLP was installed in the Gulf of Mexico in 1998.
SPAR Platform (SPAR) consists of a large diameter single vertical cylinder supporting a
deck. It has a typical fixed platform topside (surface deck with drilling and production
equipment), three types of risers (production, drilling, and export), and a hull which is
moored using a taut catenary system of six to twenty lines anchored into the seafloor. SPAR’s
are presently used in water depths up to 1000m, although existing technology can extend its
use to water depths as great as 2500m.
17
1.4. Compliant Structures Chapter 1. INTRODUCTION
1.4.4 Articulated Tower
Articulated tower is an extension of tension leg platform. The tension cables are replaced
by one single buoyant shell with sufficient buoyancy and required restoring moment against
lateral loads.
The main part of the configuration is the universal joint which connects the shell with the
foundation system. The foundation system usually consists of gravity based concrete block
or some times with driven piles.
The articulated tower concept is well suited for intermediate water depths ranging from 150m
to 500m.
Figure 1.7: Articulated Tower Platforms
18
1.5. Floating Structures Chapter 1. INTRODUCTION
1.5 Floating Structures
1.5.1 Floating Production System
Floating Production System (FPS) consists of a semi-submersible unit which is equipped
with drilling and production equipment. It is anchored in place with wire rope and chain,
or can be dynamically positioned using rotating thrusters. Production from subsea wells is
transported to the surface deck through production risers designed to accommodate platform
motion. The FPS can be used in a range of water depths from 600m to 2500m feet.
1.5.2 Floating Production, Storage and offloading System
Floating Production, Storage and Offloading System (FPSO) consists of a large tanker type
vessel moored to the seafloor. An FPSO is designed to process and stow production from
nearby subsea wells and to periodically offload the stored oil to a smaller shuttle tanker.
The shuttle tanker then transports the oil to an onshore facility for further processing. An
FPSO may be suited for marginally economic fields located in remote deepwater areas where
a pipeline infrastructure does not exist. Currently, there are no FPSO’s approved for use in
the Gulf of Mexico. However, there are over 70 of these systems being used elsewhere in the
world.
1.6 Subsea System
Subsea System (SS) ranges from single subsea wells producing to a nearby platform, FPS,
or TLP to multiple wells producing through a manifold and pipeline system to a distant
production facility. These systems are presently used in water depths greater than 1500m.
1.7 Fixed Platform Concepts
For the last few decades, the fixed platform concept has been utilized extensively over 300m
depth with various configurations.
19
1.7. Fixed Platform Concepts Chapter 1. INTRODUCTION
Figure 1.8: Floating Production storage and offloading system (FPSO)
1.7.1 Functional Classification
The offshore platforms for oil and gas exploration purpose can be classified based on func-
tionality and purpose of installation.
• Wellhead platform - primarily meant for drilling and supporting wellhead equipment.
It supports very few equipment such as wellhead control panel and piping. Occasionally
it also supports helicopter landing structure for emergency evacuation.
• Process Platform - primary meant for production facilities (oil or gas) and it may
support in addition to equipment for production, such as power generation, utilities
and living quarters.
• Riser Platform - This is another kind of structure specially built to support all the
incoming and outgoing risers on a planned complex. This will also be connected to the
main platform by bridge.
• Living Quarters Platform - Some times due to safety requirements, the living quar-
ters will be supported on a separate structure away from the wellhead and process
platforms. This types of platform will be located atleas 50m away from the neighbor-
ing process platforms and will be connected by a bridge.
20
1.7. Fixed Platform Concepts Chapter 1. INTRODUCTION
Figure 1.9: Platform Complex
• Flare Support Platform- The flare boom structure to flare the excess gas from well
reservoirs may be supported on a separate structure either a tripod or four legged
jacket for safety reasons. This is to avoid excessive heat on wellhead and process
equipment on the neighboring platforms. Usually this will located away by a distance
to be calculated based on the heat output during flaring.
1.7.2 Geometrical Classification
The structural configuration of fixed template type structures vary extensively from location
to location depending on the requirement and environmental conditions such as water depth,
wave and current loads etc. Based on geometry, jackets can be classified in to following
categories.
• Tripod - basically to support minimum facility such as few wellhead and riser or to
support a bridge between two major platforms or to support a flare boom
• 4 Legged- typically for wellhead platforms
• 6 or 8 Legged - mainly for process complex
21
1.7. Fixed Platform Concepts Chapter 1. INTRODUCTION
1.7.3 Foundation Concepts
The offshore platforms shall be fixed to the seabed by means of piles either driven through the
main legs of the jacket or through skirt sleeves attached to the jacket legs or the combinations
of both main and skirt piles. This kind of arrangement is shown in the following pictures.
22
Chapter 2
DESIGN METHODOLOGY
2.1 General
The design of offshore structure is not an single step design process. The structural config-
uration, arrangement, member sizes and its specification requirements can be arrived after
few design cycles. In order to achieve a optimum design suitable for the installation method
proposed and satisfy the final operating requirements, a design procedure suitable for the
project shall be developed.
In an offshore project, the design of structural elements cannot be initiated unless the basic
understanding of the needs are identified. The basic needs are
• What is the type of platform ? Oil or Gas, Process or Wellhead or Quarters etc
• What is floor area of topsides required ?
• Expected maximum weight of facilities ?
• What is basic water depth and environmental parameters such as wave and current ?
• Where is it located ?. Earthquake prone ?.
• What is type of installation ? Lift installed or Launch installed ?
• Any CAPEX constraints ?
The answer to the above questions will give some indication of type of jacket and topsides
required.
23
2.2. Design Stages Chapter 2. DESIGN METHODOLOGY
2.2 Design Stages
The various design stages in an offshore project is listed below.
• Front End Engineering Design (FEED) or Concept Selection
• Basic Design
• Detailed Design
2.2.1 FEED
The first step in initiating an offshore project is a FEED or concept selection. This stage of
project will involve following steps in all disciplines such as Process, Mechanical, Electrical
and Instrumentation in addition to Structural Engineering.
• Collection Process Data and identifying process needs and equipment
• Preliminary equipment sizing and area requirements
• Weight estimation based on past projects
• Identification of Structural configurations
• Preliminary estimation of structural weight
• Identification of installation methods
• Estimation of CAPEX within ±40%.
The above activities will define the project to a basic understanding and will provide enough
insight into carrying out further engineering activities.
2.2.2 Basic Design
At this stage of the project, the data collected during the FEED stage will be further verified
to make sure the authenticity and reliability of such data for further use. A detailed weight
estimates of all items involved in the project will be carried out. The process and mechanical
requirements will be further defined and identified. A Design Basis (DB) will be developed
for the proposed facility containing following information.
24
2.2. Design Stages Chapter 2. DESIGN METHODOLOGY
• Process information containing type of well fluid (oil or gas) and its characteristics,
safety requirements and kind of process technology to be adopted.
• Mechanical requirement such as type of facility and basic equipment required for the
process, and material handling and safety
• Electrical requirement such power generation equipment, lighting and switch gears
etc
• Instrumentation requirement such as basic control system, feedback requirement etc.
• Piping information such as pressures, pipe sizes required etc.
• Meta-Ocean information such as water depth, wave, current, wind and tidal infor-
mation at the site.
• Structural requirement such as materials proposed or available for use in the country,
design method to be adopted, codes and specifications to be used etc.
• Installation information such as type of barge, lifting crane, loadout-method, piling
hammer etc.
At the basic design stage, the deck area required, number deck levels, etc will be defined.
This will lead to identification of number of legs required to support the deck. Normally the
spacing between deck legs for a typical platform can vary from 10m to 20m beyond which it
may become uneconomical to design a braced deck truss structure.
Basic weight estimates for various disciplines such as structural, mechanical, electrical, in-
strumentation and piping will be carried out. Based on the weight of total deck, it may then
be decided to fabricate the deck in one piece or in various modules. This kind decision can
only be taken together with the viable installation options such ”Availability of Heavy Lift
vessels in the region” or use of float-over technique. In case such methods are not possible,
then the total topsides shall be divided in to various functional modules such as compres-
sion module, process module module, utility module, quarters module, etc. These modules
are self contained units with structure, piping, equipment etc fabricated and transported to
the site. These modules are then installed on top of the ”module Support Frame”, which
transfers the loads to the jacket. Some times this module support frame may not needed, if
the modules are organised properly over the legs. This kind of basic ideas shall be made at
the basic design stage.
25
2.2. Design Stages Chapter 2. DESIGN METHODOLOGY
Figure 2.1: Deck Installation Concepts - Integrated Deck (Single Lift)
Figure 2.2: Deck Installation Concepts - Integrated Deck (Float Over)
26
2.2. Design Stages Chapter 2. DESIGN METHODOLOGY
Utility Module
Living
Quarters
Wellhead Module Process Module
Module Support Frame
Drill Rig
Figure 2.3: Deck Installation Concepts - Modular Deck (MSF)
Compression Module
Living Quarters
Process Module Utility Module
Offshore Splice
Figure 2.4: Deck Installation Concepts - Modular Deck (Modules)
27
2.2. Design Stages Chapter 2. DESIGN METHODOLOGY
2.2.3 Detailed Design
Detailed design of offshore platform will be initiated once the basic design confirms the
economic viability and technical feasibility.
In the Detailed design or engineering of an offshore platform following items of the jacket
and deck will be developed in detail.
Deck Jacket
Framing Plans Framing Plans
Framing Elevations Framing Elevations
Joint Details Joint Details
Plate Girder Details Pile make-up
Connection Details Launch Truss Details
Welding Details Welding Details
Deck plating & grating Launch Cradle details
Stairways and Walkways Walkways
Lifting Padeyes Lifting Padeyes
Transportation tie-down Transportation Tie-down
Monorails Details Caissons and supports
Equipment Support Details Conductor guides
Flare Boom Barge Bumbers
Bridge Boat Landing
Crane Pedestal Closure Plate details
Riser Clamps
Table 2.1: Detailed Design Items
All necessary analysis required to complete the design above items shall be carried out.
28
2.2. Design Stages Chapter 2. DESIGN METHODOLOGY
Deck Jacket
Inplace Inplace
Loadout Loadout
Sea Transportation Sea Transportation
Lifting or Floatover Lifting or Launch
Miscellaneous Calculations Upending
Dynamic
Fatigue (Deterministic or Spectral)
On bottom Stability
Pile Driveability
Cathodic Protection
Ship Impact
Table 2.2: Detailed Design Analysis
29
2.2. Design Stages Chapter 2. DESIGN METHODOLOGY
30
Chapter 3
LOADS
3.1 General
3.2 Types of Loads
Loads on offshore structures are gravity loads and environmental loads. Gravity loads are
arising from dead weight of structure and facilities either permanent or temporary. Seismic
loads are arising from gravity loads and is a derived type.
Environmental loads play a major role governing the design of offshore structures. Before
starting the design of any structure, prediction of environmental loads accurately is impor-
tant. Various environmental loads acting on the offshore platform is listed below.
• Gravity Loads
– Structural Dead Loads
– Facility Dead Loads
– Fluid Loads
– Live Loads
– Drilling Loads
• EnvironmentalLoads
– Wind Loads
– Wave Loads
– Current Loads
31
3.3. Gravity Loads Chapter 3. LOADS
– Buoyancy Loads
– Ice Loads
– Mud Loads
• Seismic Loads
3.3 Gravity Loads
3.3.1 Dead Loads
Dead loads includes the all the fixed items in the platform deck, jacket, bridge and flare
structures. It includes all primary steel structural members, secondary structural items such
as boat landing, padeyes, stiffeners, handrails, deck plating, small access platforms etc.
The primary structural steel members will be calculated based on the structural information
in the model automatically when a computer program is used to analyse the structure. But
the weight of secondary structural steel items shall be calculated applied to the structural
model at appropriate locations.
3.3.2 Facility Dead Loads
The structure built either for drilling or wellhead type platform or for process type platform
supports various equipment and facilities. These are fixed type items and not structural
components. they do not have any stiffness to offer in the global integrity of the structure
and shall not be modelled. The weight of such items shall be calculated and applied at the
appropriate locations according the plan of the structure. These items include
• Mechanical equipment
• Electrical equipment
• Piping connecting each equipment
• Electrical Cable trays
• Instrumentation items
32
3.3. Gravity Loads Chapter 3. LOADS
3.3.3 Fluid Loads
The fluid loads are weight of fluid on the platform during operation. This may include all the
fluid in the equipment and piping. The weight of these items shall be calculated accurately
and applied to the correct locations.
3.3.4 Live Loads
Live loads are defined as movable loads and will be temporary in nature. Live loads will only
be applied on areas designated for the purpose of storage either temporary or long term.
Further, the areas designed for laydown during boat transfer of materials from boat shall
also be considered as live loads.
Other live load include open areas such as walkways, access platforms, galley areas in the
living quarters, helicopter loads in the helipad, etc. These loads shall be applied in accordance
with the requirement from the operator of the platform. This load vary in nature from owner
to owner but a general guideline on the magnitude of the loads is given below.
Sl. No Location Load (kN/m2
)
1 Storage / laydown 10
2 Walkway 5
3 Access Platform 5
4 Galley 10
Table 3.1: Live Loads
3.3.5 Drilling Loads
Drilling loads are due to drill rigs placed on top of the platform for drilling purposes. These
are large equipment assembled together and placed on top. Normally, drilling rigs are as
heavy as 500 Tonnes to 1000 Tonnes. These will deliver reaction forces on the deck and the
stiffness of the drilling rigs are not considered in the structural analysis. Hence the weight of
the structure shall be applied as load on the structure. Further, during drilling, additional
loads will be developed due to drill string and pulling operations. these loads also shall be
considered in the analysis.
33
3.4. Environmental Loads Chapter 3. LOADS
3.4 Environmental Loads
3.4.1 Wind Loads
The wind speed at 10m above LAT (Lowest Astronomical Tide) is normally provided (Vo).
This wind speed shall be extrapolated to the height above for the calculation of wind speed.
The extrapolation shall be calculated as below.
V = Vo
y
10
1
8
(3.1)
where y is the elevation of point in consideration in m above LAT and V is the velocity at
that point. Wind loads shall be calculated as per API RP2A guidelines.
Sustained wind speeds(10min mean) shall be used to compute global platform wind loads
and gust wind (3 second) shall be used to compute the wind loads to design individual
members.
The wind pressure can be calculated as
fw =
ρg
2
V 2
(3.2)
where F is the wind pressure per unit area, ρ (0.01255 kN/m3
) is the density of air, g is
the gravitational acceleration (9.81 m/sec2
) and V is the wind speed in m/sec. the above
equation can be simplified by substituting the values and can be expressed as
fw = 0.6V 2
kN/m2
(3.3)
The total wind load on the platform can be calculated using the wind blockage area and the
pressure calculated as above. The shape coefficient (Cs) shall be selected as per AP RP2A
guidelines. But for the calculation of global wind load (for jacket and deck global analysis)
shape coefficient can be 1.0.
The total force on the platform can be calculated as
Fx = fwAxCs (3.4)
Fy = fwAyCs (3.5)
34
3.4. Environmental Loads Chapter 3. LOADS
Y
X
θ
Fθ
Ay
Ay
A1
A2
Fy
Fx
The exposed areas (Ax and Ay) shall be calculated as length x height or width x height
depending on the axis system followed.
Wind load on oblique directions can be calculated using following relationship.
Fθ = Fxcos(θ) + Fysin(θ) (3.6)
In practical design, it is often only Fx and FY will be calculated and applied in the structural
analysis as basic loads and the wind load effect due to non-orthogonal directions are simulated
using factors in terms of Fx and Fy in the load combinations. The factors can be calculated
as
The projected areas can be calculated as A1 = Ax cos(θ) and A2 = Ay sin(θ)
Fθ = fw (A1 + A2)) (3.7)
Fθ = fw (Axcos(θ) + Aysin(θ)) (3.8)
Fθx = fw (Axcos(θ) + Aysin(θ)) cos(θ) (3.9)
Fθy = fw (Axcos(θ) + Aysin(θ)) sin(θ) (3.10)
35
3.4. Environmental Loads Chapter 3. LOADS
where Fθx and Fθy are the components of Fθ in x and y directions respectively. Ratio between
Fθx and Fx can be expressed as
Fθx
Fx
=
fw (Axcos(θ) + Aysin(θ)) cos(θ)
fwAx
(3.11)
Fθx
Fx
= cos2
(θ) + (Ay/Ax)sin(θ)cos(θ) (3.12)
Similarly, ratio between Fθy and Fy can be expressed as
Fθy
Fy
=
fw (Axcos(θ) + Aysin(θ)) sin(θ)
fwAy
(3.13)
Fθy
Fy
= sin2
(θ) + (Ax/Ay)sin(θ)cos(θ) (3.14)
3.4.2 Wave and Current Loads
Methodology
In applying design waves load onto the offshore structures, there are two ways of applying
it.
• Design Wave method
• Spectral Method
In design wave method, a discrete set of design waves (maximum) and associated periods
will be selected to generate loads on the structure. These loads will be used to compute the
response of the structure.
In the spectral method, a energy spectrum of the sea-state for the location will be taken and
a transfer function for the response will be generated. These transfer function will be used
to compute the stresses in the structural members.
36
3.4. Environmental Loads Chapter 3. LOADS
Design Wave method
The forces exerted by waves are most dominant in governing the jacket structures design
especially the foundation piles. The wave loads exerted on the jacket is applied laterally on
all members and it generates overturning moment on the structure.
Period of wind generated waves in the open sea can be in the order of 2 to 20 seconds. Theses
waves are called gravity waves and contain most part of wave energy.
Maximum wave shall be used for the design of offshore structures. The relationship between
the significant wave height(Hs) and the maximum wave height (Hmax) is
Hmax = 1.86Hs (3.15)
The above equation correspond to a computation based on 1000 waves in a record.
The design wave height for various regions is tabulated below.
Region 1 year 100 year
Bay of Bengal 8 18
Gulf of Mexico 12 24
South China Sea 11 24
Arabian Sea 8 18
Gulf of Thailand 6 12
Persian Gulf 5 12
North Sea 14 22
Table 3.2: Maximum design waves in various regions
API RP2A requires both 1 year and 100 year recurrence wave shall be used for the design
of jacket and piles. Appropriate combination of loads with these waves shall be used in the
design. A one-third increase in permissible stress is allowed for 100 year storm conditions.
Spectral Method
Instead of simulating the design wave environment by discrete maximum wave, a design sea-
state described by energy spectrum of for the given site will be used in the load simulation.
A directional spectrum can also be used to simulate the changes design wave sea-state.
37
3.4. Environmental Loads Chapter 3. LOADS
Surface
Seabed
Wind Driven Current Tidal Current
X
Y
Figure 3.1: Current Profiles
Various sea-state energy spectra are available for use, some of which are listed below.
• PM Spectra
• Jonswap Spectra
• ISSC Spectra
3.4.3 Current Profile
Oceans currents induce drag loading on offshore structures. These currents together with
the action of waves generate dynamic loads.
Ocean currents are classified into few types based on their nature viz, tidal current, wind
driven current and current generated due to ocean circulation. Wind driven currents are
small in nature and it varies linearly with depth where as tidal currents vary nonlinearly
with depth. Similarly, the currents generated due to ocean circulation will vary nonlinear
with depth and can be as much as 5 m /sec.
The current variation with depth is shown in Figures and can be expressed as below.
VT = VoT
y
h
1
7
(3.16)
where VT is the tidal current at any height from sea bed, VoT is the tidal current at the
surface, y is the distance measure in m from seabed nd h is the water depth.
VW = VoW
y
h
(3.17)
38
3.4. Environmental Loads Chapter 3. LOADS
where VW is the wind driven current at any height from sea bed, VoW is the wind driven
current at the surface, y is the distance measure in m from seabed nd h is the water depth.
3.4.4 Marine Growth
Marine growth is an important part in increasing the loads on offshore structures. The
growth of marine algae increases the diameter and roughness of members which in turn
cause the wave or current loading to increase. Detailed discussion on the member roughness
and its relationship with hydrodynamic coefficients can be found in API RP2A.
The thickness of marine growth generally decrease with depth from the mean sea level and
it is maximum in the splash zone. The thickness of marine growth in the splash zone can
be as much as 20cm and will reduce below to 5cm. In deeper zones, the thickness may be
negligible.
Splash Zone is a region where the water levels fluctuate between low to high. The actual
elevation of the bottom and top of these vary from location to location due to different tidal
conditions. In general terms, the splash zone will vary from -3m to +5m.
In structural analysis, the increased diameter of the member (D = d + tm) shall be included
so that the wave and current loads can be calculated correctly. D and d are the diameter
of increased member and original member respectively and tm is the thickness of marine
growth.
The roughness of the marine growth is an important parameter in determining the drag and
inertia coefficients. reference shall be made relevant API RP2A clauses for more details.
3.4.5 Morison Equation
Wave and current loading can be calculated by Morison equation.
Morison equation can be written as :
FT =
1
2
CD ρw D V |V | +
πD2
4
CM ρw a (3.18)
where FT is the total force, ρw is the density of water, CD and CM are the drag and inertia
coefficients respectively, D is the diameter of the member including marine growth, V is the
velocity and a is the acceleration.
39
3.4. Environmental Loads Chapter 3. LOADS
The first term in the equation is drag component (FD)and the second term is the inertia
component (FI). This can be expressed as
FT = FD + FI (3.19)
Most of the time, current exist in the same direction of the wave propagation and hence
the current shall be taken into consideration in the load calculation. However, algebraic
sum of wave and current loads is different from calculation of load by adding the horizontal
water particle velocity with the current velocity and computing the loads. This is because
of nonlinear term in the drag equation.
Current velocity shall be added vectorially with the water particle velocity before computa-
tion of drag force, i.e. V = Vw + Vc where V is the total velocity, Vw is the Velocity due to
waves and Vc is the velocity of current. This is required since there is a square term in the
drag force equation.
3.4.6 Wave-Current Interaction
The wave current interaction is an important phenomenon since the waves propagate on
the current. Both current modifies the wave and wave modifies the current exist. But the
former takes most priority in the calculations of wave loads. This interaction modifies the
wave parameters and modifies the wave field. Depending on the direction of current in
respect of wave direction, it either stretches the wave longer or shortens it.
If the current travels in the same direction as the wave, then the wave period becomes longer
and it is called apparent wave period (Tapp). Recommendation of API RP2A shall be used
to estimate the apparent wave period. Following simultaneous equations shall be solved to
obtain the apparent wave period.
L
T
=
L
Tapp
+ VI (3.20)
Tapp =
2πL
g tanh kh
(3.21)
VI =
4π/L
sinh kh
0
−h
Uc(z) cosh 2k(z + h)dz (3.22)
Refer to API clause 2.3.1.b (1) for more details on how to compute this apparent wave period.
40
3.4. Environmental Loads Chapter 3. LOADS
3.4.7 Selection of Wave Theory
The computation of wave kinematics such as velocity and acceleration involves the equations
from wave theory. There are various kinds of solutions available depending on the accuracy
required, and parameters involved in the computation. The various wave theories are listed
below.
• Linear / Airy Wave Theory
• Stokes Wave Theory (up to 5th order approximations)
• Stream Function Wave Theory (up to 22nd order approximations)
• Cnoidal Wave Theory
Depending on the location such as deep water or shallow water and associated wave param-
eters, a suitable wave theory shall be selected for use. API RP 2A recommends to use a
chart for such selection based on d/gT2
and H/gT2
as the X and Y axis. Refer to Figure.
The wave theories discussed above are for non-breaking waves. For H/h > 0.78, these theories
are not applicable as the waves tend to break. In such situation, empirical equations shall
be used to calculate the breaking wave forces on the structures.
3.4.8 Wave Load on a Member
The various steps involved in calculating loads on a member can be shown graphically.
Morison equation is a general form and can not be applied to all members in the offshore
structure. It was developed specifically for a surface piercing cylinder like pile of a structure.
But in reality, the members of the offshore structure may be horizontal or inclined in space
and can not used without modification.
Water Wave Kinematics
Airy wave theory is considered in the calculation of wave kinematics. Consider a progressive
wave with water surface elevation depicted by cosine curve,
ζ =
H
2
cos(kx − ωt) (3.23)
41
3.4. Environmental Loads Chapter 3. LOADS
Figure 3.2: Selection of wave theory for load calculation 9ref : API RP 2A)
and the corresponding velocity potential is given by
φ = −
H
2
ω
k
cosh k(h + z)
sinh kh
sin(kx − ωt) (3.24)
The horizontal and vertical velocity and acceleration of water particle can be calculated
using the following equations.
Vh = −
∂φ
∂x
=
H
2
ω
cosh k(h + z)
sinh kh
cos(kx − ωt) (3.25)
42
3.4. Environmental Loads Chapter 3. LOADS
Figure 3.3: Procedure for Calculation Wave Plus Current Loads (Extract from API RP 2A)
Vv = −
∂φ
∂z
=
H
2
ω
sinh k(h + z)
sinh kh
sin(kx − ωt) (3.26)
ah =
∂Vh
∂t
=
H
2
ω2 cosh k(h + z)
sinh kh
sin(kx − ωt) (3.27)
av =
∂Vv
∂t
= −
H
2
ω2 sinh k(h + z)
sinh kh
cos(kx − ωt) (3.28)
where k is the wave number defined by 2π/L, ω is the wave circular frequency defined by
2π/T, L is the wave length, and x is the distance of the point in consideration from origin.
Maximum Load on a vertical member
Consider a case of a surface piercing cylinder such as pile of a structure or a leg of a jacket,
the combined drag and inertia force (total force) varies with time and will be maximum only
at one occasion. In order find the maximum force, phase angle at which the maximum force
occurs shall be found first.
Let us express the total force on the pile by substituting the velocity and acceleration com-
ponents and integrating between the limits (from surface to seabed, i.e., 0 to -h),
43
3.4. Environmental Loads Chapter 3. LOADS
Mean Sea Level (M.S.L)
Highest Astronomical Tide (HAT)
Lowest Astronomical Tide (LAT)
h
x
y
Direction of Wave Propagation
Figure 3.4: Wave Loads on Jacket Structure
FT =
1
2
CD ρ D
π2
H2
T2
cos θ| cos θ|
sinh2
kh
sinh(2kh)
4k
+
h
2
−CM ρ
πD2
4
2π2
H
T2
sin θ
k
(3.29)
The total force will be maximum when,
∂FT
∂θ
= 0 (3.30)
44
3.4. Environmental Loads Chapter 3. LOADS
Substituting the values of velocity and acceleration components in to the drag and inertia
force equation and differentiating with respect to θ and rearranging the terms, we get
θmax = cos−1
−
πD
H
CM
CD
2 sinh2
kh
(sinh 2kh + 2kh)
(3.31)
Maximum Load on a horizontal member
Consider a case of a horizontal cylinder such as brace of a jacket, the combined drag and
inertia force (total force) varies with time and will be maximum only at one occasion. In
order find the maximum force, phase angle at which the maximum force occurs shall be
found first.
Let us express the total force on the pile by substituting the velocity and acceleration,
FT =
1
2
CD ρ D
H2
ω2
4
cos θ| cos θ|
cosh2
k(z + h)
sinh kh
−CM ρ
πD2
4
Hω2
2
sin θ
cosh2
k(z + h)
sinh kh
(3.32)
The total force will be maximum when,
∂FT
∂θ
= 0 (3.33)
Substituting the values of velocity and acceleration components in to the drag and inertia
force equation and differentiating with respect to θ and rearranging the terms, we get
θmax = sin−1
−
πD
2H
CM
CD
sinh kh
cosh k(h + z)
(3.34)
Maximum Load on a inclined member
The resultant force on a arbitrarily oriented circular cylinder in water waves can be calculated
using vector analysis combined with Morison equation.
45
3.4. Environmental Loads Chapter 3. LOADS
The resultant force on a cylinder in general has component normal to the cylinder axis Fn
and a component along the axis of the cylinder (a tangential component) Ft. Thus, the total
force per unit length of the cylinder can be written as
F = Fn + Ft (3.35)
Each of these components can be expressed as functions of the fluid particle motions by
using Morison’s equation. The force in normal direction can be expressed as
Fn = Fn
D + Fn
I (3.36)
where Fn
D and Fn
I are the drag and inertia forces respectively. These forces can be expressed
as
Fn
D =
1
2
Cn
DDρVn|Vn| (3.37)
Fn
I =
1
4
πCn
M ID2
ρan (3.38)
where
Cn
D = Drag coefficient for flow normal to the cylinder
Cn
M = Inertia coefficient for flow normal to the cylinder
D = Diameter of cylinder
ρ = Density of seawater
Vn = Velocity of fluid particle normal to the cylinder axis
an = Acceleration of fluid particle normal to the cylinder axis
In the tangential direction, only a skin friction drag term exists since inertial component
along the member axis does not exist unless a axial inertia coefficient is specified. Hence the
equation for tangential force can be written as
Ft = Ft
D (3.39)
Ft
D =
1
2
Ct
DDρVt|Vt| (3.40)
where
46
3.4. Environmental Loads Chapter 3. LOADS
Cn
D = Drag coefficient for flow tangential to the cylinder
Vt = Velocity of fluid particle tangential to the cylinder axis
These forces can be summed and expressed in terms of cylinder local axis as below.
Fx =
1
2
Ct
DDρVt|Vt| (3.41)
Fy =
1
2
Cn
DDρVn|Vy| +
1
4
πCn
M ID2
ρay (3.42)
Fz =
1
2
Cn
DDρVn|Vz| +
1
4
πCn
M ID2
ρaz (3.43)
The maximum forces can only be found numerically by calculating the forces for one wave
cycle.
3.4.9 Maximum Global Loads
Maximum global loads on a platform can be calculated using two principles.
• Maximum Base Shear Method
• Maximum Overturning Moment Method
It is important that the wave loads on the structure be checked for both conditions. The
maximum overturning moment method will give more pile loads than the other. Similarly,
the maximum base shear method may govern the design of some jacket leg members near
seabed due to high shear.
Maximum Base Shear
Maximum base shear or maximum total force on a structure has to be determined for the
global analysis of structures. As the wave propagates across structure wave force on each
member is different and all the locations will not be attaining the maximum forces. To find
the maximum total force a structure, following steps need to be considered.
• Position the wave crest at the origin of the structure as shown in Figure.
47
3.4. Environmental Loads Chapter 3. LOADS
• Divide one wave cycle into number of segments either in terms of θ or in terms of
length.
• Compute the wave forces on all members at that instant of time using water wave
velocities and accelerations computed.
• Sum up the forces in horizontal direction for all the members.
• Repeat the calculation in step 4 for all the points for one wave cycle.
• The maximum of all the total forces computed in step 5 is the maximum base shear
or total force.
Maximum Overturning moment
Maximum overturning moment on a structure can be determined following the procedure for
the maximum base shear case. In this case, the loads on the members shall be multiplied by
the lever arm from mud-line. This shall be summed up and the procedure shall be repeated
for all the steps in the wave.
3.4.10 Buoyancy Loads
The offshore structural members mostly made buoyant by air tight sealing of the welds
to avoid water entry. This is purposely planned so that the overall structure will have
adequate buoyancy during installation. Typical example is the jacket structure. This kind
of structure requires at least a reserve buoyancy of 10% to 15%. The reserve buoyancy is
defined as buoyancy in excess of its weight. To obtain this buoyancy, structural tubular
members are carefully selected such that their buoyancy / weight ratio is greater than 1.0.
This means that the member will float in water. On other hand, if the member is part of a
structure supported at its two ends and forced to be submerged by weight of other members,
this member will experience a upward force equal to the displaced volume of water. This is
called buoyancy force. The buoyancy force can be calculated by two methods.
• Marine Method
• Rational Method
The marine method assumes that the member in consideration considered to have rigid body
motion. This means that the weight of the member is calculated using submerged density
48
3.4. Environmental Loads Chapter 3. LOADS
Water Surface
Buoyancy by
Rational Method
Selfweight including
buoyancy (Marine Method) Self Weight alone
Figure 3.5: Buoyancy Calculation methods
of steel and applied to the member vertically down as an uniformly distributed load. This
buoyant weight WB of the member per unit length can be calculated as
WB =
1
4
π(D2
− (D − t)2
)(ρs − 1.025) (3.44)
where ρs is the density of steel
Unlike gravity which is a true body force acting on every particle of a body, buoyancy is the
resultant of fluid pressure acting on the surface of the body. These pressures can only act
normal to the surface.
The rational method takes in to account this pressure distribution on the structure, results
in a system of loads consisting of distributed loads along the members and concentrated
loads at the joints. The loads on the members are perpendicular to the member axis and in
the vertical plane containing the member. The magnitude of this distributed member load
can be expressed as
BB =
1
4
πD2
ρw cos α (3.45)
where α is the angle between the member and its projection on a horizontal plane
The joint loads consists of forces acting in the directions of all of the members meeting at the
joint. These joint forces act in a direction that would compress the corresponding members
49
3.4. Environmental Loads Chapter 3. LOADS
if they acted directly on them, and have magnitude of :
PB = ρwAh (3.46)
where
A = ”displaced” area i.e. the material area for flooded members,
the enclosed area for non-flooded members
h = water depth at the end of the member being considered
3.4.11 Ice Loads
For structures located in polar regions and cold countries, ice loading shall be considered in
the design. In this regions, the ice sheets of varying thicknesses can move from one location
to other due to tide and under water current. These ices sheets when come closer and hit
the offshore structures, large impact force is experienced by the structure.
Mean Sea Level (M.S.L)
Highest Astronomical Tide (HAT)
Lowest Astronomical Tide (LAT)
F
Figure 3.6: Ice Loading on a structure
50
3.5. Load Estimation and Distribution Chapter 3. LOADS
This kind of force cannot be calculated by means of analytical tools. However, based on
experimental studies, an empirical equation is available and can be used to estimate the
force Fice.
Fice = C f A (3.47)
where
fice = Crushing strength of ice vary between 1.5 MPa to 3.5 MPa
Cice = Ice force coefficient vary between 0.3 to 0.7
A = Area struck by ice (Diameter of member x ice sheet thickness)
3.4.12 Mud Loads
Platforms located in the vicinity of the river mouth (shallow water platforms) may experience
the mud flow loads. The river flow brings sediment transport and nearby mud towards the
platform and may slide through the location.
Sometimes over a long period of time sediment settlement at the location of the platform
may have sloping surface and mud slides can also generate mud loads.
These loads can be calculated using
Fmud = Cmud τ D (3.48)
where
Cmud = Force Coefficient vary from 7 to 9
τ = Shear strength of soil 5 KPa to 10 kPa
D = Diameter of pile or or member)
3.5 Load Estimation and Distribution
The gravity loads on the topside shall be estimated with care, especially at the initial stage
of the project. During initial stage, no reliable information may be available. based on past
experience weight of various items shall be assumed. Hence the possibility of weight overrun
during the project can occur.
In order to reduce the risk of such situation and further consequences of re-design, a planned
method of estimation and control shall be introduced called ”Weight Control procedure”.
51
3.5. Load Estimation and Distribution Chapter 3. LOADS
Mean Sea Level (M.S.L)
Highest Astronomical Tide (HAT)
Lowest Astronomical Tide (LAT)
Stiff and Stable Soil
Soft or Unstable soil
Mud Slide
Figure 3.7: Mud Loading on a structure
In the weight control procedure, the weight elements of an topside shall be divided into the
following categories.
• Primary Structure
• Secondary Structure
• Mechanical Equipment
• Piping & Bulks
• Electrical Equipment
• Instrumentation
In a typical wellhead platform, the distribution or break down of total weight or payload is
shown in Table.
52
3.5. Load Estimation and Distribution Chapter 3. LOADS
No Category %
1 Primary Structure 20
2 Secondary Structure 15
3 Mechanical Equipment 25
4 Piping & Bulks 25
5 Electrical Equipment 10
6 Instrumentation 5
Total 100
Table 3.3: Typical Break down of total topside loads
The weight estimation of various components will start as early as FEED stage. Structural
analysis of concepts selected will require reasonable data for loading the structure with
and subsequent analysis work. However, the equipment and other information may not be
available at so early in the project. Hence weight estimation with suitable ”contingency”
shall be used in the design. Further, during the progress of the project, design requirement
may change due to fundamental change in process techniques, equipment selection etc. This
contingency is used to allow for such unforeseen growth in the topside load. This contingency
is normally kept at higher during the initial stage and can be reduced once the information
on each item is available.
No Category FEED Basic Detail Fabrication Weighing
Design Design Stage Stage
1 Primary Structure 25 20 15 10 5
2 Secondary Structure 35 30 25 15 5
3 Mechanical Equipment 45 30 25 15 5
4 Piping & Bulks 35 30 25 15 5
5 Electrical Equipment 40 30 15 10 5
6 Instrumentation 35 30 25 15 5
Table 3.4: Variation of contingency through project duration
Further, the variation in weight due to mill tolerances, fabrication tolerance, welding etc
shall also be accounted for in the design. This allowances can be normally estimated and
included. The total allowance for this shall be at least 5%.
There is another allowance normally kept aside during the design is the allowance for future
expansion. This is normally decided by owner or developer of the field and identified future
expansion. This is called Future expansion allowance.
53
3.6. Load Combinations Chapter 3. LOADS
10
20
30
40
50
FEED BASIC DESIGN DETAIL DESIGN FABRICATION
DESIGN / FABRICATION STAGES
Upper bound
Lower bound
Figure 3.8: Variation of Contingency through project duration
3.6 Load Combinations
The load combinations used for adequacy checking of any offshore structure can be divided
into following four categories.
• Normal Operating Case - Maximum gravity loads arising from normal operation of
the platform with 1 year return period wave, current and wind. This case is used to
check the structure against loads during the normal operation of the platform.
• Hydro-test case - This is a case where hydro-testing and commissioning of equipment
and piping is carried out offshore. In this case, the equipment and piping will be fully
filled with sea water and maximum gravity loads will be developed. It should be noted
that not all equipment will be hydro-tested simultaneously. It will be done one by one.
This case is used to check the local strength of the deck structure.
• Extreme Storm Case - Maximum gravity loads arising from extreme case with 100
year return period storm wave, current and wind. This case is used to check the
structure due to loads during 100 year return period storm together with platform
gravity loads.
– Some platforms are designed to be unmanned and will be operation during the
storm with remote control. Typically, a wellhead platform with only very mini-
54
3.6. Load Combinations Chapter 3. LOADS
mum personnel onboard will be fully functional except that the personnel will be
evacuated during the storm.
– Second type of platforms are process platforms with attached living quarters where
large number of people staying on board, platform will be shutdown, and the
people will be evacuated during a severe storm.
• Pull out case - Minimum gravity loads arising from extreme case with 100 year return
period storm wave, current and wind. This case is used to check the maximum tension
loads on the piles and structural members.
• Seismic case - Maximum gravity loads with seismic loads from either strength level
earthquake or ductility level earthquake as per actual design requirement. This case
is used to check the seismic condition if the platform is located in seismically active
region.
Depending on type of platform operation such as process, welhead / drilling or living quar-
ters, the required load combinations during a normal operation or extreme storm may change.
This is illustrated in the Tables.
The above table is based on the Working stress method (WSD) and does not include any
contingencies. Suitable contingency shall be added to the load combination.
55
3.6. Load Combinations Chapter 3. LOADS
Normal Hydro-test Extreme Tension
No Load Category Operating case Storm Pullout Seismic
case case case case case
1 Gravity Loads
Structural Dead Loads 1.00 1.00 1.00 0.90 1.00
Mechanical Equipment 1.00 1.00 1.00 0.90 1.00
Piping & Bulks 1.00 1.00 1.00 0.90 1.00
Electrical Equipment 1.00 1.00 1.00 0.90 1.00
Instrumentation 1.00 1.00 1.00 0.90 1.00
Operating Fluids 1.00 - 1.00 - 1.00
Hydro-test Fluids 1.00 1.00 - - -
Live Loads 1.00 0.50 - - 0.50
2 Drilling Loads
Drilling Equipment 1.00 1.00 1.00 0.90 1.00
Supplies 1.00 - - - 0.50
Hook Loads 1.00 - - -
Rotary Loads - - 1.00 -
3 Environmental Loads
Operating Wind 1.00 1.00 - -
Extreme Wind - - 1.00 1.00
Operating Wave+current 1.00 1.00 - - -
Extreme Wave+Current - 1.00 1.00 -
4 Seismic Loads - - - - 1.00
Table 3.5: Load Combination for an offshore platform design based WSD
56
Chapter 4
MATERIALS AND CORROSION
4.1 General
Selection of suitable material for the offshore structure is a very important aspect. Materials
for offshore applications include the following.
• Structural Materials
– Structural Steel - Low carbon steel used for ll kinds of structural members in the
platforms
– Structural concrete - Marine grade concrete used for construction of columns and
bases of gravity type platforms
– Cement grout - used for grouting annulus between the pile and jacket leg or skirt
• Piping Materials
– Carbon Steel used for normal process piping
– Stainless steel
– Steel Alloys such duplex steel, super duplex steel etc for transporting corrosive
fluids such crude oil etc
– Fibre Reinforced Plastics - used for sea water service such as fire water system
• Miscellaneous Materials
– Fibre Reinforced Plastics - used for splash zone protection of piles and members,
marine growth preventer etc
– Fibre Glass - used for grating on offshore platforms
– Timber - used for miscellaneous applications such as launch skid, temporary
works, mudmat, etc.
57
4.2. Structural Steel Chapter 4. MATERIALS AND CORROSION
4.2 Structural Steel
Offshore structures are generally constructed of structural steel. But these structures are
mostly either fixed template type structures and deep water complaint structures. Some
times the concrete gravity type structure are also constructed. In this chapter, the type of
steel materials and its behaviour under water is discussed.
4.2.1 Structural Member Classification
Structural members in the offshore structures can be classified into following categories based
on the criticality.
• Primary Structural Member - Primary Structural members shall include members
and components essential to the overall integrity and safety of the primary structure.
• Secondary Structural Member - Secondary Structural Steel shall include members
and components essential to the local integrity of the structure where failure of these
members will not affect the overall integrity and safety of the primary structure.
• Special Members - Special members are parts of primary members located in, or at
the vicinity of, critical load transmission areas and of stress concentration locations.
• Ancillary Members - Ancillary’ members are minor members and attachments,
which do not fall in the above categories.
Typical examples in each category is given in Table 4.1.
Category Deck Jacket
Primary Legs, main truss members, Legs, piles, braces
plate girders
Secondary stringers, floor plates Minor braces, caissons,
conductor supports
Special Nodes, lifting padeyes Nodes, padeyes
Ancillary handrails, platforms, supports walkways, bumpers and guides
Table 4.1: Typical member types in Deck and Jacket
4.2.2 Steel Grades
The four (4) grades of steel, which may be used to fabricate plate, rolled shapes, built-up
girders and beams, and tubulars, are
58
4.2. Structural Steel Chapter 4. MATERIALS AND CORROSION
• Mild Steel (MS)
• Special Mild Steel (SMS)
• High Strength Steel (HS)
• Special High Strength Steel (SHS)
Mild Steel (MS)
a) Mild Steel (MS) plate, shapes, and plate for tubulars, shall conform to ASTM A 36,
”Specification for Structural Steel”.
b) Structural grade seamless line pipe may be used for tubular less than 508 mm O.D., for
handrails, grating supports, walkways, or as shown on the Fabrication Drawings. Line pipe
shall meet the requirements of API Specification 5L Grade B or ASTM A 53 Grade B.
c) All mild steel shall have a minimum of 250 MPa yield strength.
Special Mild Steel (SMS)
Special Mild Steel (SMS) plate shall conform to ASTM A 36, except that this steel shall be
manufactured to a fully killed, fine grain practice, grain size six (6) and finer as determined
by ASTM E 112.
High Strength Steel (HS)
a) High Strength Steel (HS) plate shall conform to the requirements of API 2H Grade 50 or
ASTM A 633 Grade C.
b) High Strength Steel (HS) for rolled shapes shall conform to the requirements of ASTM A
633 Grade D.
c) These grades of steel shall be fully killed, fine grain practice, grain size six (6) or finer as
determined by ASTM E 112.
d) The carbon equivalent index shall be for Grade 50 steels as defined by API Specification
2H.
e) High Strength Steel for tubular less than 508 mm O.D. may conform to seamless API
Specification 5L.
59
4.2. Structural Steel Chapter 4. MATERIALS AND CORROSION
Special High Strength Steel (SHS)
• Two (2) special high strength steels may be used in the structure(s):
• ”SHS-50” shall conform to the requirements of API 2H Grade 50 or ASTM A 633 Grade
C, Normalized High Strength Low Alloy Structural Steel with API 2H supplements S-1,
S-4 and S5 applicable to either designation.
b) These materials shall be fully killed and normalized, grain size six (6) or finer as
determined by ASTM E 112.
• The steels shall meet the requirements of ASTM A 578, ”Straight Beam Ultrasonic
Examination of Plain and Clad Steel Plates for Special Applications” and ASTM A770.
For ultrasonic examination acceptance level II shall be used and the entire plate shall
be scanned. Supplementary requirements S1 and S4 shall apply.
• The maximum carbon equivalent shall be as defined by API Specification 2H for Grade
50 steels.
4.2.3 Manufacturing
Materials shall be produced by a manufacturing process which includes ladle vacuum de-
gassing, calcium argon stirring, or other suitable techniques which shall result in removal or
shape control of the complex oxy-sulfides. The supplier shall provide a guarantee and sub-
stantial proof that the required properties and weldability can be achieved with the proposed
process. Melting by the open hearth process shall not be allowed.
4.2.4 Chemical Requirements
The maximum allowable sulfur content shall be 0.006 percent. Rare earth metal (REM)
additions shall not be permitted. This approval shall be contingent upon a review of the
details concerning the type and amount of REM additions, how and at what point in the
melting - ladle degassing process are the REM added, the sulfur level and the extent of
degassing prior to the REM addition, and the method used for analysis and control.
4.2.5 Carbon Equivalent (CE)
CE = C +
Mn
6
+
Cr + Mo + V
5
+
Ni + Cu
15
(4.1)
60
4.3. Corrosion Chapter 4. MATERIALS AND CORROSION
4.2.6 Mechanical Requirements
For grade SHS-50, the minimum yield strength shall be 345 MPa and the minimum tensile
strength shall be 483 MPa for plates through 100mm in thickness.
4.2.7 Notch Toughness Requirements
The Charpy V-notch impact test shall be used for all high strength ASTM materials for
notch toughness requirements. The test shall be conducted and acceptance criteria shall be
in accordance with API Specification 2H.
4.2.8 Supplementary Requirements
Suplementary requirements for structural steel such as S1 through S11 shall be followed as
per API 2H.
4.3 Corrosion
Corrosion of metals is a electro-chemical process of loss of material from one location. This
may get deposited in the same metal in another area. Corrosion in a wet environment attacks
the metal by removing the atoms on the metal surface. The metal atoms at the surface lose
electrons and become actively charged ions that leave the metal and enter the wet electrolyte.
The metal ions join with/to oppositely charged ions from another chemical and form a new,
stable compound.
4.3.1 Seawater Corrosion
Corrosion in a wet environment attacks the metal by removing the atoms on the metal
surface. The metal atoms at the surface lose electrons and become actively charged ions
that leave the metal and enter the wet electrolyte. The metal ions join with/to oppositely
charged ions from another chemical and form a new, stable compound.
Corrosion requires energy. During corrosion the reacting components go from a higher to
a lower energy state and release the energy needed for the reaction. In the dry corrosion
process of Figure 1 the metal and the oxygen combine to produce the oxide on the surface
because the reaction leads to a compound (the oxide) at a lower energy level.
61
4.3. Corrosion Chapter 4. MATERIALS AND CORROSION
The oxide layer shields the metal from the oxygen and forms a barrier. The oxide will not
react with the oxygen in the air or the metal. The barrier makes it difficult for oxygen in
the air to contact the metal and it eventually grows so thick that the movement of electrons
and ions across it stop. Provided the oxide layer does not crack, or is not removed, the
metal is protected from further corrosion. But if the bare metal is exposed to the oxygen,
it will again react to form the oxide. In this case the presence of oxygen benefits the metals
protection. Removal of the oxygen removes the metals ability to create its own protective
corrosion barrier.
Corrosion of steel in marine environmental is basically a electro-chemical reaction. This is
caused by flow of electrons from one location to another location results in recombined metal
or rust deposited in the receiving location called Cathode. The location from where the
metal is being taken away is called Anode.
The essential requirement of such metal transfer to occur is closed circuit between the two
locations. This is provided by the surrounding seawater which is a best electrolyte. The
presence of chloride, accelerates the process of corrosion.
This process is schematically showing in Figure 4.1.
In the above process the electrons from the corroding anode metal move to the connected
cathode where they recombine with the atoms of oxygen and water in the electrolyte to make
a new hydroxyl ion (OH-). This new negatively charged ion then reacts to make a stable
compound with the positively charged metal ions (F2
+) that originally lost the electrons.
In this case, the electrons have a continuous pathway to escape the parent metal and the
parent metal, which cannot develop a protective barrier, disassociates or falls apart. Once
corrosion starts it continues until the ingredients are all used up.
4.3.2 Factors influencing corrosion
The factors influencing or accelerating the sea water corrosion process are listed below.
• PH value of sea water- The electrolyte in wet corrosion can be neutral, acidic or
alkaline. For corrosion in near neutral solutions (pH 6 8) under oxygenated conditions
the predominant cathodic reaction is the oxygen absorption reaction (O2 + 2H2O +
4e- = 4OH-) shown in Figure 1. If instead the bimetallic cell has no oxygen present
in the electrolyte the hydrogen evolution reaction (H+ + e- = H followed by H +
H = H2 gas) becomes the cathodic process and the anode continues to corrode. This
reaction is a much slower reaction (the H+ ion has a very low concentration in solution)
than the oxygen absorbing reaction. In acidic solutions (pH 0 - 6) the hydrogen ion
concentration is higher and the hydrogen evolution reaction is the predominant one.
Corrosion rates become extreme as the pH drops (acid gets stronger).
62
4.3. Corrosion Chapter 4. MATERIALS AND CORROSION
Cathode
Cathode
Anode
Electrolyte - Sea Water
CorrodingMetal-Fe
2e−
2e−
Presence of Oxygen
H2O
O2
2H2O + O2 + 4e−
→ 4OH−
Fe2+
+ OH−
→ Fe(OH)2
Fe → Fe2+
+ 2e−
→ Rust
Figure 4.1: Schematic showing the sea water corrosion process
• Salt Content - The presence of chloride in sea water increase the chemical reaction
that takes place during the corrosion process.
• Temperature of water - The effect of temperature on corrosion rate is very impor-
tant. The rate of corrosion increases as the electrochemical reaction gets faster in high
temperature.
• Velocity of flow - The rate of corrosion is higher in water circulating or flowing
through than in the stagnant water. During corrosion, ions build up immediately
around the anode and cathode saturating their respective regions. The corrosion rate
begins to fall due to the concentration of stagnant ions blocking the creation of more
ions in the electrolyte. If the ions are removed or more voltage is provided the corrosion
rate again picks up. If you want fast corrosion then agitate the electrolyte and add
oxygen.
63
4.3. Corrosion Chapter 4. MATERIALS AND CORROSION
• Presence of Oxygen - Presence of oxygen is main cause of corrosion process to
start. The corrosion reaction requires oxygen and where oxygen is present the metal is
cathodic and where oxygen is depleted the metal is anodic and corrodes. The parts of
the metal in contact with the highest oxygen concentration become cathodic and are
protected, and the areas where oxygen concentration is low will corrode. Steel posts
dug into the ground will rust just below the surface because of this effect.
4.3.3 types of corrosion
• General / Uniform Corrosion - this is basically a global corrosion occurring uniform
over the exposed surfaces of the metal. Typical example of uniform corrosion is the
corrosion of offshore structures in sea water.
• Localised Corrosion - Some of the localised corrosion effects are listed with brief
description of hot it happens.
– Pitting Corrosion - This type of corrosion happen due to presence of some kind
of opening in the metal surface such as fatigue cracks. In pitting corrosion the
metal at the top of the pit has access to the oxygen in the air and becomes the
cathode. At the bottom of the pit oxygen is depleted and the metal becomes the
anode. The deeper the pit is the less the oxygen available at the bottom and the
corrosion rate increases.
– Crevice Corrosion - A crevice is created whenever two objects are brought to-
gether. Unless they are perfectly flat a crevice is present and oxygen cannot easily
enter the gap but is plentiful outside. Corrosion starts in the crevice because of
differential aeration.
– Stress Corrosion - Metal under tensile stresses can corrode at higher rates than
normally expected. The stressed areas have changed electrical potentials to the
neighbouring metal and are also more likely to develop microscopic surface cracks.
Both situations promote increased corrosion rates.
– Galvanic Corrosion -
Galvanic corrosion needs to be watched. Dissimilar metals of different potentials
joined together by an electrolyte, like process water or rainwater, will cause the
more anodic metal to corrode. Running copper water pipe to a galvanised tank
will cause the tank to corrode very quickly. Joining copper to steel is nearly as
bad. In the galvanic series listed in Table 1 only join metals that are near each
other.
Some protection from galvanic corrosion can be achieved if the electrolyte is not
present. Without the availability of water molecules the corrosion reaction stops
because the electrons cannot find a host to complete the chemical reaction. Where
dissimilar metals must be used, for example aluminum fins on the copper coils of
a refrigeration chiller condenser, protect them from contact with water. If water
64
4.3. Corrosion Chapter 4. MATERIALS AND CORROSION
must be used in contact with dissimilar metals insure it is deionised and oxygen
free.
Air
High Oxygen
Low Oxygen
Sea Water
Anode
Cathode
Rust
Steel
FE2+
Steel
Air
High Oxygen
Low Oxygen
Sea Water
Anode
Cathode
Rust
Steel
FE2+
Steel
Figure 4.2: Schematic showing the pitting and crevice corrosion
A metal can corrode without being in contact with another metal. In this case different areas
of the metal take on different electrical potentials. This can occur because of variations in
the metal metallurgical properties or because of variations in the surface oxide layer, such
as a break, thinning, inclusion like mill scale, contaminant like dirt, etc.
In pitting corrosion the metal at the top of the pit has access to the oxygen in the air and
becomes the cathode. At the bottom of the pit oxygen is depleted and the metal becomes the
anode. The deeper the pit is the less the oxygen available at the bottom and the corrosion
rate increases. Figure 2 shows the mechanism of pitting corrosion.
4.3.4 Rates of corrosion
Variation of corrosion along the depth of water depends on many parameters discussed in the
previous section. However, a general trend is that the corrosion rate decrease as the depth
increase. This is due to lack of presence of oxygen and decrease in temperature. However, the
salt content increases with the depth. Hence the rates of corrosion is a complex phenomenon
changes from location to location. The corrosion rate of 0.1mm to 0.5mm per year in the
splash zone and 0.05mm to 2mm below the splash zone has been given in the literature.
In case of jacket type structures, generally the corrosion allowance in the splash zone vary
from 6mm to 12mm and for other regions below, normally no corrosion allowance is provided
since sacrificial anodes are provided to protect the steel. The longer the design life of the
structure, the corrosion allowance in the splash shall be higher. But some times, a non-
corrosive splash zone protection in the form wrapping using FRP materials are also provided
inplace of corrosion allowance.
65
4.4. Corrosion Protection Chapter 4. MATERIALS AND CORROSION
Zone 1 : Atmospheric
Zone 2 : Splash Zone
Zone 3: Tidal
Zone 4: Continuosly
Zone 5: Sub-soil
Submerged
0 0.10 0.20 0.40 0.50 0.60
Corrosion Rate mm/year
Figure 4.3: Rate of corrosion along depth
4.4 Corrosion Protection
There many ways of protecting the structures against corrosion. The possible methods are
listed below.
• Select base materials such that they have corrosion resistant property inherently.
• Providing protective coating or other means to stop the environment from attacking
the steel surface.
• Cathodic Protection by means of sacrificial anodes or impressed current system.
• Providing corrosion inhibitors to stop the corrosion process
• Providing sacrificial corrosion allowance in areas where protection by other method
does not work.
4.5 Cathodic Protection
Cathodic protection has applications in most of the offshore structures and facilities.
66
4.5. Cathodic Protection Chapter 4. MATERIALS AND CORROSION
• Offshore Platforms
• Jack-up Rigs
• Semi-Submersible Platforms
• Jetties and Wharves
• Submarine Pipelines
• FPSOs
4.5.1 Sacrificial Anode System
A schematic showing the sacrificial anode system is shown in Figure 4.4. The metal surfaces
to be protected shall be connected to a sacrificial anode. In this method, the protective
current that flow from the sacrificial anode prevents the flow of corrosive current flowing
from anode to cathode. This way the metal corrosion is stopped. Instead, the sacrificial
anode corrodes during the process.
Anode
Sacrificial
Cathode
Cathode
Anode
Protectivecurrent
Electrolyte - Sea Water
CorrodingMetal-Fe
Fe2+
2e−
2e−
Presence of Oxygen
H2O
O2
2H2O + O2 + 4e−
→ 4OH−
Fe2+
+ OH−
→ Fe(OH)2
Fe → Fe2+
+ 2e−Anode
Vathode
Result → Rust
Figure 4.4: Schematic showing the sacrificial anode system
67
4.5. Cathodic Protection Chapter 4. MATERIALS AND CORROSION
For a freely corroding mild steel in sea water has a potential difference of -0.50 to -0.60
Volts when compared with Silver/Silver Chloride reference electrode. This negative potential
increases further when cathodic protection is applied. This negative volts increases more than
-0.80 Volts and this indicates that the cathodic protection system is in working condition.
This method is very suitable for offshore fixed type platforms. This method does not require
any maintenance and no external resources for operation. A typical fixed offshore platform
as shown in Figure 4.6 is provided with many number of anodes distributed from mudline
to LAT. It is to be noted that the cathodic protection by means of sacrificial anodes does
not work in the splash zone due to intermittent exposure. Hence the anodes need not be
provided in the splash zone.
The amount of sacrificial anodes required to protect the structure depends on the following
parameters and shall be carefully studied.
• Seawater Resistivity, Salinity, temperature and flow velocity
• Total Surface area to be protected
• Type of Anode Material and its composition, size and shape
Among the various types of anodes used in the industry, the slender stand-off type anode
commonly selected due to its simplicity.
Anode Material - Aluminum AlloyAnode Core - Steel Tube
L
l
h
d
b
B
Cross Section
Figure 4.5: Typical details of slender stand-off sacrificial anode
68
4.5. Cathodic Protection Chapter 4. MATERIALS AND CORROSION
LAT
HAT
Splash Zone
Anode
Seabed
Conductors
Piles
Soil
Figure 4.6: Offshore platform protected with sacrificial anodes
69
4.5. Cathodic Protection Chapter 4. MATERIALS AND CORROSION
70
Chapter 5
SIMULATION
5.1 General
With the advancement in computer and software technology and availability of computers,
the structural analysis of structures has been made easy and fast. There are a number of
commercial computer programs available specifically coded to carry out three dimensional
structural analysis for offshore structures. Few programs are listed below.
• SACS - Structural Analysis Computer System - from Engineering Dynamics Inc. USA
• Strucad - Also from Engineering Dynamics INC. USA
• SESAM - from Det Norske Veritas, Norway
The modern day offshore development project schedules does not permit designers to carry
out hand calculations due to faster requirement of design and drawings for fabrication.
Usually, the first discipline to produce documents and drawings is structural so that the
materials can be ordered to mill for production. Hence the structural designers are under
very high pressure from fabricators to produce the structural material take off for order
placement. The use of structural analysis programs with fast computers has made possible
some of the largest structures to be designed in 6 to 8 months.
Following preparatory activities are required before analysis and design can be carried out.
• Structure Geometry selection
• Geometry Simulation
71
5.2. Structure Geometry selection Chapter 5. SIMULATION
• Foundation Simulation
• Load Simulation
5.2 Structure Geometry selection
Structure geometry shall be selected based on various requirement such as layout, water
depth, environmental condition, installation methodology and topside loads etc.
Figure 5.1: Computer Model of a Wellhead Jacket and Deck
5.3 Geometry Simulation
A geometric model of a structure contains a database of following information.
72
5.3. Geometry Simulation Chapter 5. SIMULATION
• Joints or Nodes
• Members and Properties
• Foundation
• Loads
Each of the above information can be entered in a planned and systematic way so that the
post processing and correlating the design drawings with analysis results becomes easier and
faster.
5.3.1 Axis System
Any computer model of structure require origin and coordinate system so that the structure
information such as nodes and loads can be modeled. Normally, orthogonal coordinate
system with X, Y and Z will be used. The origin of such system shall be at the geometric
center of the platform in plan at the work point and at Mean Sea Level (M.S.L) in elevation
as shown in Figure.
X
Z
Y
Joint
Member
LEG
LEG
BRC
XBR
Figure 5.2: Computer Model of a Jacket with Axis system
73
5.3. Geometry Simulation Chapter 5. SIMULATION
The axis origin at the center of the jacket helps in modeling and transformation of geometry
for further installation analyses.
5.3.2 Joints or Nodes
Joints or nodes are defined as three dimensional coordinates of junctions of members in the
space frame. Joints are work points (W.P.) of ends of members and the member shall be
formed along the centreline of the member. Unique numbering system shall be followed so
that identification of location of joint becomes easy. For example following joint numbering
can be used.
No Item Description Joint Numbering
1 Jacket J1 to J999
2 Deck D1 to D999
3 Flare Boom F1 to F999
4 Bridge B1 to B999
5 Living Quarters Q1 to Q999
Table 5.1: Joint Numbering scheme
Some software programs has the ability to generate automatic joint numbering based on
initial number given by the user. Each panel or plane framing can be given with unique
numbering. This numbering schemes will help a lot during post processing of results and
identification of members or joints that require redesign.
For example, in the deck joint numbering scheme, we can split the numbering system in
to blocks and use them in a systematic way. For cellar deck, D1 to D399, and for main
deck D400 to D799 and for upper deck D800 to D999 and so on. This way, we can easily
identify which node is lying on which deck etc. This method of modeling can only come by
experience and can be improved to produce a more user friendly model. This will definitely
help during quick processing of results and compiling the information from various analyses
for a jacket such as inplace, fatigue, seismic, loadout, transportation and launching etc.
5.3.3 Members and properties
A member in structural model is a an element (usually a beam element in terms of Finite
Element Terminology) connected between two nodes or joints. This member represents the
presence of a structural member in the analysis. The member can be defined by two joints
(one at each end of member) and a member group name (under which the member property
such as diameter and wall thickness can be assigned).
74
5.3. Geometry Simulation Chapter 5. SIMULATION
Similarly, the member properties can also be given in systematic way. Same member group
shall not be given to too many segments or members.
No Item Description Member group
1 Jacket
Legs Prefix with either L or J
Horizontal Braces Prefix with H
Elevation braces Prefix with V
Launch Truss Prefix with T
Boat Landing Prefix with BL
2 Deck
Cellar Deck Prefix with C
Main Deck Prefix with M
Upper Deck Prefix with U
Crane Pedestal Prefix with P
3 Flare Boom Prefix with F
4 Bridge Prefix with B
5 Living Quarters Prefix with Q
Table 5.2: Member Group scheme
the above is list in an indication of how systematic a structural model can be made and it
is upto the designer to build it the way he wanted.
5.3.4 Offsets and Eccentricities
The members connecting at one common joint can be joined to one single joint if the offset
between the work points (W.P.) is less than the API RP2A allowable distance of D/4 where D
is the diameter of the chord member at the joint. This is based some studies on tubular joints
with eccentricities showed that the additional moment generated by these eccentricities have
consequences on the member and joint adequacy. The shear capacities of tubular members
are generally high and may not be serious issue is the eccentricity is within D/4.
However, this rule shall not be applied to deck truss. The column, brace and plate girder
junction shall be modelled with additional joint even if the eccentricities are less than D/4.
This is required to model the shear transfer between the brace and plate girder through the
web of the girder. If a separate joint is not modelled, the vertical component of the braces
forces will directly taken by the column and the shear capacity of the plate girder at the
joint may be checked correctly.
75
5.3. Geometry Simulation Chapter 5. SIMULATION
Figure 5.3: Computer Model of a vertical elevation of jacket
5.3.5 Wish-bone Connections
The conductors are tubes inserted through series of guides in the jacket at various levels and
driven in to the seabed for at least 30 to 40m. These tubes are later used to pass through
the drill safely without damaging the jacket members. Further, these tubes prevent the
drill pipes (normally very small diameter, typically 13 to 16 inch) from failure due to large
displacement and vortex induced vibration. These conductors are not structurally connected
to jacket members but just touching the conductor guides at different elevations. Total
number of such conductors may vary from platform to platform, in some cases, there may as
much as 30 to 40 conductors of 30 inch diameters. Wave and current loading on conductors
need to be included in the structural analysis and hence they need to to modelled.
The conductors and the structural elements at the conductor guide level will be modelled
through a ”stiff element” called wish bone with only axial stiffness so that it will transfer
76
5.3. Geometry Simulation Chapter 5. SIMULATION
Brace
Brace
Brace
Chord
e1 e2
For e1 and e2 less than D/4
For e1 and e2 greater than D/4
Common Joint
for all the braces
Separate Joint
for each brace
e1 e2
Figure 5.4: Joint offset or eccentricities in jacket tubular Joint
Brace
Brace
Column
Plate Girder
e1 e2
Should be modelled even if e1 and e2 are less than D/4
Separate Joint
for each brace
e1 e2
Increased web thicknessIncreased Flange Thickness
Figure 5.5: Joint offset or eccentricities in deck truss Joint
the lateral loads from wave and current on conductors. The length of the wish bones will be
very small. This is done by creating a joint with almost same coordinate of the structural
joint.
77
5.3. Geometry Simulation Chapter 5. SIMULATION
Conductor
Support Braces
Conductor Guide
Anulus Gap
Wish bone
Figure 5.6: Wish bone modelling of conductor / guide interface
5.3.6 Dummy Structure Models
Jacket structure has many appurtenances attached to it. The wave and current loading on
them shall be taken into account but the stiffness need not considered in the global analysis
of jacket. This is to simplify the load path and to understand the behaviour clearly. Further
the materials of such appurtenances may not be in line with the main structure, it is obvious
to ignore them in the global structural stiffness. Such structures are listed below.
• Boat Landing
• Barge Bumber
• Launch Runner
• Mudmat
• Anodes
• Conductors
• Risers
• J-tube
Similarly, the deck structure has many appurtenances as listed below.
• Walkways
78
5.4. Foundation Simulation Chapter 5. SIMULATION
• Stairways
• Platforms
• Equipment Supports
• Monorails
But these items on the deck does not have wave or current loading but may have wind loading
on them. Since the wind loading on deck is normally considered as block area, this may not
be the case. But these appurtenances need to be modelled to simulate the vertical COG.
This is required in the sea transportation analysis and seismic analysis. Refer to relevant
section for more details.
The dummy structure can be modelled in two ways. The first method is to model as a
structural member and give very high Young modulus so that the stiffness is very low. This
method will lead to large displacements and may not be correct.
The other method is to remove such members after the loads are calculated and summed
to the nearest joint. Some of the software programs have this ability to simulate dummy
structure based on this method.
5.4 Foundation Simulation
5.4.1 Pile Modelling
In an offshore structure, the piles hold them on to the sea bed. This needs to be simulated
in the structural analysis involving their inplace strength and stability. There are type of
pile system that can be used in the offshore structures.
• Main Pile
• Skirt Pile
As it can be seen from the figure that the skirt pile is always grouted with the skirt sleeve
of the jacket. But in the case of main pile, the annulus between the pile and the jacket leg
may be grouted or not grouted depending on the design water depth. Like other structural
elements of the jacket structure, pile is also a structural member and shall be modelled
according to the diameter, wall thickness and material properties. It is the load transfer
mechanism between the jacket leg and pile that requires special care in simulation of actual
load transfer.
79
5.4. Foundation Simulation Chapter 5. SIMULATION
Jacket Brace
Jacket LegPile
Wish-Bone
Structure Node
Pile Node
Pile to Deck Connection
Pile To Jacket Connection
Pile Head Node
Figure 5.7: Pile Simulation for an Offshore jacket
80
5.4. Foundation Simulation Chapter 5. SIMULATION
For the case of grouted skirt piles and main piles, the model becomes much easier by simply
specifying the cross section as a ”Composite Section” containing jacket leg, pile and the
annulus filled with cement grout. The equivalent axial area, shear area and bending stiffness
can be calculated using the equivalent section concept and used in the analysis.
But for the case of main pile, this cannot be done. The pile and jacket are two parallel
members physically connected at the top of jacket by means welded connections and else
where no welding but spacers are placed inside the jacket leg to provide contact points for
load transfer. These spacers are specially located at the horizontal framing such that the
lateral loads from the wave and current can be easily transferred to the piles.
5.4.2 Soil Simulation
Piles below seabed shall be modelled in the structural analysis to reflect the vertical and
lateral behaviour of pile soil system. This is very essential to simulate the jacket and deck
deflections and pile stresses. This can be done in three ways.
• Equivalent Pile Stub -
• P-Y, T-Z and Q-Z Curves -
• Linearised Pile Stiffness Matrix -
5.4.3 Pile Group Effect
The skirt piles for very large jackets normally arranged in cluster at each corner to resist the
forces from gravity and environmental loads.
These pile clusters can be arranged in various ways but due to construction limitations
usually they will arranged in closed manner as shown in the Figures 5.10 and ??. The
distance between the jacket leg and the farthest pile shall be kept to a minimum possible for
fabrication to avoid unnecessary bending on jacket legs as well on the pile sleeves.
It is a good practice to space the centre to centre of adjacent piles at a distance of 3D
where D is the diameter of the pile. This will prove a clear distance between the pile face of
2D.Even with this separation, the effect of load on one pile will affect the behaviour of the
adjacent pile. The issues to be looked into are two categories as listed below.
• Effect Axial Capacity
• Effect on P-Y, T-Z and Q-Z behaviour
81
5.4. Foundation Simulation Chapter 5. SIMULATION
Jacket Legs
Brace
Skirt Sleeve
Main Pile
Soil Lateral
Resistance
Figure 5.8: Pile Simulation for an Offshore jacket
82
5.4. Foundation Simulation Chapter 5. SIMULATION
Figure 5.9: Pile Group arrangements for 4 legged platform
Figure 5.10: Pile Group arrangements for 8 legged platform
83
Offshore structures
Offshore structures
Offshore structures
Offshore structures
Offshore structures
Offshore structures
Offshore structures
Offshore structures
Offshore structures
Offshore structures
Offshore structures
Offshore structures
Offshore structures
Offshore structures
Offshore structures
Offshore structures
Offshore structures
Offshore structures
Offshore structures
Offshore structures
Offshore structures
Offshore structures
Offshore structures
Offshore structures
Offshore structures
Offshore structures
Offshore structures
Offshore structures
Offshore structures
Offshore structures
Offshore structures
Offshore structures

More Related Content

What's hot

Sacs otc 2012
Sacs otc 2012Sacs otc 2012
Sacs otc 2012HSD Luu
 
Jacket
JacketJacket
Jacket
esa subakti
 
Offshore Structure
Offshore StructureOffshore Structure
Offshore Structure
Ismail Topal
 
Offshore platform
Offshore platform Offshore platform
Offshore platform
NautilusRegisterMari
 
Tutorial #2 - SACS Basic
Tutorial #2 - SACS BasicTutorial #2 - SACS Basic
Tutorial #2 - SACS Basic
Faisal Purnawarman
 
Introduction to offshore structures
Introduction to offshore structuresIntroduction to offshore structures
Introduction to offshore structures
Nitish Anand
 
Offshore platform ln1_au_06_12_2019
Offshore platform ln1_au_06_12_2019Offshore platform ln1_au_06_12_2019
Offshore platform ln1_au_06_12_2019
UnitedLiftTechnologi
 
Final ppt of ts
Final ppt of tsFinal ppt of ts
Final ppt of ts
Mohd omer Ahmed
 
Basic load out methodologies introduction
Basic load out methodologies introductionBasic load out methodologies introduction
Basic load out methodologies introduction
Bruce nguyen
 
C9 FPSO Layout and Turret 2004
C9 FPSO Layout and Turret 2004C9 FPSO Layout and Turret 2004
C9 FPSO Layout and Turret 2004
David Seow
 
Offshore pile design according to international practice
Offshore pile design according to international practiceOffshore pile design according to international practice
Offshore pile design according to international practice
Web2Present
 
Ppt report on offshore Platform Designs
Ppt report on offshore Platform DesignsPpt report on offshore Platform Designs
Ppt report on offshore Platform Designs
SUBHAM DEY
 
The Road to Saqqara ( Jack-up units and Move )
The Road to Saqqara ( Jack-up units and Move )The Road to Saqqara ( Jack-up units and Move )
The Road to Saqqara ( Jack-up units and Move )
Kamel Elsayed
 
Design and Analysis of Floating Production Systems
Design and Analysis of Floating Production Systems Design and Analysis of Floating Production Systems
Design and Analysis of Floating Production Systems
Engineers Australia
 
Ship Building (parts of ship)
Ship Building (parts of ship)Ship Building (parts of ship)
Ship Building (parts of ship)
Abood Mohgazy
 
Offshore Petroleum Production Systems
Offshore Petroleum Production SystemsOffshore Petroleum Production Systems
Offshore Petroleum Production Systems
Sahyog Shishodia
 
Offshore oil platform ppt
Offshore oil platform  pptOffshore oil platform  ppt
Offshore oil platform ppt
soumikghosh49
 
Ship Structural Components
Ship Structural ComponentsShip Structural Components
Ship Structural Components
Mohammud Hanif Dewan M.Phil.
 

What's hot (20)

Sacs otc 2012
Sacs otc 2012Sacs otc 2012
Sacs otc 2012
 
Jacket
JacketJacket
Jacket
 
Offshore Structure
Offshore StructureOffshore Structure
Offshore Structure
 
Offshore platform
Offshore platform Offshore platform
Offshore platform
 
Tutorial #2 - SACS Basic
Tutorial #2 - SACS BasicTutorial #2 - SACS Basic
Tutorial #2 - SACS Basic
 
Introduction to offshore structures
Introduction to offshore structuresIntroduction to offshore structures
Introduction to offshore structures
 
Offshore platform ln1_au_06_12_2019
Offshore platform ln1_au_06_12_2019Offshore platform ln1_au_06_12_2019
Offshore platform ln1_au_06_12_2019
 
Final ppt of ts
Final ppt of tsFinal ppt of ts
Final ppt of ts
 
Basic load out methodologies introduction
Basic load out methodologies introductionBasic load out methodologies introduction
Basic load out methodologies introduction
 
Spar Platforms
Spar PlatformsSpar Platforms
Spar Platforms
 
C9 FPSO Layout and Turret 2004
C9 FPSO Layout and Turret 2004C9 FPSO Layout and Turret 2004
C9 FPSO Layout and Turret 2004
 
Offshore pile design according to international practice
Offshore pile design according to international practiceOffshore pile design according to international practice
Offshore pile design according to international practice
 
Ppt report on offshore Platform Designs
Ppt report on offshore Platform DesignsPpt report on offshore Platform Designs
Ppt report on offshore Platform Designs
 
The Road to Saqqara ( Jack-up units and Move )
The Road to Saqqara ( Jack-up units and Move )The Road to Saqqara ( Jack-up units and Move )
The Road to Saqqara ( Jack-up units and Move )
 
Design and Analysis of Floating Production Systems
Design and Analysis of Floating Production Systems Design and Analysis of Floating Production Systems
Design and Analysis of Floating Production Systems
 
Ship Building (parts of ship)
Ship Building (parts of ship)Ship Building (parts of ship)
Ship Building (parts of ship)
 
Offshore Petroleum Production Systems
Offshore Petroleum Production SystemsOffshore Petroleum Production Systems
Offshore Petroleum Production Systems
 
Offshore oil platform ppt
Offshore oil platform  pptOffshore oil platform  ppt
Offshore oil platform ppt
 
subsea
subseasubsea
subsea
 
Ship Structural Components
Ship Structural ComponentsShip Structural Components
Ship Structural Components
 

Similar to Offshore structures

guide to offshore structures design for engineers
guide to offshore structures design for engineersguide to offshore structures design for engineers
guide to offshore structures design for engineers
ProfSNallayarasu
 
Free high-school-science-texts-physics
Free high-school-science-texts-physicsFree high-school-science-texts-physics
Free high-school-science-texts-physics
منتدى الرياضيات المتقدمة
 
Mansour_Rami_20166_MASc_thesis
Mansour_Rami_20166_MASc_thesisMansour_Rami_20166_MASc_thesis
Mansour_Rami_20166_MASc_thesisRami Mansour
 
Drilling engineering
Drilling engineeringDrilling engineering
Drilling engineering
Steffones K
 
Die casting2
Die casting2Die casting2
Die casting2
Prateek Gupta
 
Prassl w l_-_drilling_engineer
Prassl w l_-_drilling_engineerPrassl w l_-_drilling_engineer
Prassl w l_-_drilling_engineerDaniel Cordoba
 
Analysis and control of an in situ hydrogen generation and fuel cell power sy...
Analysis and control of an in situ hydrogen generation and fuel cell power sy...Analysis and control of an in situ hydrogen generation and fuel cell power sy...
Analysis and control of an in situ hydrogen generation and fuel cell power sy...Jupira Silva
 
Richard fitzpatrick
Richard fitzpatrickRichard fitzpatrick
Richard fitzpatrick
Diego Garcia Dos Santos
 
Water-Resources-Engineering-Chin.pdf
Water-Resources-Engineering-Chin.pdfWater-Resources-Engineering-Chin.pdf
Water-Resources-Engineering-Chin.pdf
RajeshMahana2
 
Heat exchanger - Training course material
Heat exchanger - Training course materialHeat exchanger - Training course material
Heat exchanger - Training course material
Bassem Eleaba, MEng
 
[A. hobbacher] fatigue_design_of_welded_joints_and
[A. hobbacher] fatigue_design_of_welded_joints_and[A. hobbacher] fatigue_design_of_welded_joints_and
[A. hobbacher] fatigue_design_of_welded_joints_and
Ilham Ilham
 
Guide for the design of crane supporting steel structures
Guide for the design of crane supporting steel structuresGuide for the design of crane supporting steel structures
Guide for the design of crane supporting steel structures
Timóteo Rocha
 
Physical Introduction
Physical IntroductionPhysical Introduction
Physical Introduction
Nathaniel Blevins
 
Mac crimmon r.a. crane-supporting steel structures- design guide (2005)
Mac crimmon r.a.   crane-supporting steel structures- design guide (2005)Mac crimmon r.a.   crane-supporting steel structures- design guide (2005)
Mac crimmon r.a. crane-supporting steel structures- design guide (2005)
Kritam Maharjan
 
The gage block handbook
The gage block handbookThe gage block handbook
The gage block handbookgoyito13
 
Review of completion_technologies(1)
Review of completion_technologies(1)Review of completion_technologies(1)
Review of completion_technologies(1)
Lawrence Kwende
 

Similar to Offshore structures (20)

guide to offshore structures design for engineers
guide to offshore structures design for engineersguide to offshore structures design for engineers
guide to offshore structures design for engineers
 
Frmsyl1213
Frmsyl1213Frmsyl1213
Frmsyl1213
 
Free high-school-science-texts-physics
Free high-school-science-texts-physicsFree high-school-science-texts-physics
Free high-school-science-texts-physics
 
HASMasterThesis
HASMasterThesisHASMasterThesis
HASMasterThesis
 
Mansour_Rami_20166_MASc_thesis
Mansour_Rami_20166_MASc_thesisMansour_Rami_20166_MASc_thesis
Mansour_Rami_20166_MASc_thesis
 
10.1.1.652.4894
10.1.1.652.489410.1.1.652.4894
10.1.1.652.4894
 
Drilling engineering
Drilling engineeringDrilling engineering
Drilling engineering
 
Die casting2
Die casting2Die casting2
Die casting2
 
Prassl w l_-_drilling_engineer
Prassl w l_-_drilling_engineerPrassl w l_-_drilling_engineer
Prassl w l_-_drilling_engineer
 
Analysis and control of an in situ hydrogen generation and fuel cell power sy...
Analysis and control of an in situ hydrogen generation and fuel cell power sy...Analysis and control of an in situ hydrogen generation and fuel cell power sy...
Analysis and control of an in situ hydrogen generation and fuel cell power sy...
 
Richard fitzpatrick
Richard fitzpatrickRichard fitzpatrick
Richard fitzpatrick
 
Water-Resources-Engineering-Chin.pdf
Water-Resources-Engineering-Chin.pdfWater-Resources-Engineering-Chin.pdf
Water-Resources-Engineering-Chin.pdf
 
Heat exchanger - Training course material
Heat exchanger - Training course materialHeat exchanger - Training course material
Heat exchanger - Training course material
 
[A. hobbacher] fatigue_design_of_welded_joints_and
[A. hobbacher] fatigue_design_of_welded_joints_and[A. hobbacher] fatigue_design_of_welded_joints_and
[A. hobbacher] fatigue_design_of_welded_joints_and
 
Guide for the design of crane supporting steel structures
Guide for the design of crane supporting steel structuresGuide for the design of crane supporting steel structures
Guide for the design of crane supporting steel structures
 
General physics
General physicsGeneral physics
General physics
 
Physical Introduction
Physical IntroductionPhysical Introduction
Physical Introduction
 
Mac crimmon r.a. crane-supporting steel structures- design guide (2005)
Mac crimmon r.a.   crane-supporting steel structures- design guide (2005)Mac crimmon r.a.   crane-supporting steel structures- design guide (2005)
Mac crimmon r.a. crane-supporting steel structures- design guide (2005)
 
The gage block handbook
The gage block handbookThe gage block handbook
The gage block handbook
 
Review of completion_technologies(1)
Review of completion_technologies(1)Review of completion_technologies(1)
Review of completion_technologies(1)
 

More from TouihriMohsen1

Serc rsi resistance-feu
Serc rsi resistance-feuSerc rsi resistance-feu
Serc rsi resistance-feu
TouihriMohsen1
 
Sécurité incendie. guides de construction métallique. sécurité incendie et ca...
Sécurité incendie. guides de construction métallique. sécurité incendie et ca...Sécurité incendie. guides de construction métallique. sécurité incendie et ca...
Sécurité incendie. guides de construction métallique. sécurité incendie et ca...
TouihriMohsen1
 
Réaction au feu, résistance au feu définitions et normes nelinkia
Réaction au feu, résistance au feu  définitions et normes   nelinkiaRéaction au feu, résistance au feu  définitions et normes   nelinkia
Réaction au feu, résistance au feu définitions et normes nelinkia
TouihriMohsen1
 
Pratique du calcul de la résistance au feu des structures en béton
Pratique du calcul de la résistance au feu des structures en bétonPratique du calcul de la résistance au feu des structures en béton
Pratique du calcul de la résistance au feu des structures en béton
TouihriMohsen1
 
Pdfcoffee.com eurocode 8-calcul-sismique-pdf-free
Pdfcoffee.com eurocode 8-calcul-sismique-pdf-freePdfcoffee.com eurocode 8-calcul-sismique-pdf-free
Pdfcoffee.com eurocode 8-calcul-sismique-pdf-free
TouihriMohsen1
 
Ouvrages coupe feu
Ouvrages coupe feuOuvrages coupe feu
Ouvrages coupe feu
TouihriMohsen1
 
Belovolova arina
Belovolova arinaBelovolova arina
Belovolova arina
TouihriMohsen1
 

More from TouihriMohsen1 (8)

Serc rsi resistance-feu
Serc rsi resistance-feuSerc rsi resistance-feu
Serc rsi resistance-feu
 
Sécurité incendie. guides de construction métallique. sécurité incendie et ca...
Sécurité incendie. guides de construction métallique. sécurité incendie et ca...Sécurité incendie. guides de construction métallique. sécurité incendie et ca...
Sécurité incendie. guides de construction métallique. sécurité incendie et ca...
 
Réaction au feu, résistance au feu définitions et normes nelinkia
Réaction au feu, résistance au feu  définitions et normes   nelinkiaRéaction au feu, résistance au feu  définitions et normes   nelinkia
Réaction au feu, résistance au feu définitions et normes nelinkia
 
R15
R15R15
R15
 
Pratique du calcul de la résistance au feu des structures en béton
Pratique du calcul de la résistance au feu des structures en bétonPratique du calcul de la résistance au feu des structures en béton
Pratique du calcul de la résistance au feu des structures en béton
 
Pdfcoffee.com eurocode 8-calcul-sismique-pdf-free
Pdfcoffee.com eurocode 8-calcul-sismique-pdf-freePdfcoffee.com eurocode 8-calcul-sismique-pdf-free
Pdfcoffee.com eurocode 8-calcul-sismique-pdf-free
 
Ouvrages coupe feu
Ouvrages coupe feuOuvrages coupe feu
Ouvrages coupe feu
 
Belovolova arina
Belovolova arinaBelovolova arina
Belovolova arina
 

Recently uploaded

CFD Simulation of By-pass Flow in a HRSG module by R&R Consult.pptx
CFD Simulation of By-pass Flow in a HRSG module by R&R Consult.pptxCFD Simulation of By-pass Flow in a HRSG module by R&R Consult.pptx
CFD Simulation of By-pass Flow in a HRSG module by R&R Consult.pptx
R&R Consult
 
一比一原版(IIT毕业证)伊利诺伊理工大学毕业证成绩单专业办理
一比一原版(IIT毕业证)伊利诺伊理工大学毕业证成绩单专业办理一比一原版(IIT毕业证)伊利诺伊理工大学毕业证成绩单专业办理
一比一原版(IIT毕业证)伊利诺伊理工大学毕业证成绩单专业办理
zwunae
 
space technology lecture notes on satellite
space technology lecture notes on satellitespace technology lecture notes on satellite
space technology lecture notes on satellite
ongomchris
 
English lab ppt no titlespecENG PPTt.pdf
English lab ppt no titlespecENG PPTt.pdfEnglish lab ppt no titlespecENG PPTt.pdf
English lab ppt no titlespecENG PPTt.pdf
BrazilAccount1
 
一比一原版(UofT毕业证)多伦多大学毕业证成绩单如何办理
一比一原版(UofT毕业证)多伦多大学毕业证成绩单如何办理一比一原版(UofT毕业证)多伦多大学毕业证成绩单如何办理
一比一原版(UofT毕业证)多伦多大学毕业证成绩单如何办理
ydteq
 
一比一原版(SFU毕业证)西蒙菲莎大学毕业证成绩单如何办理
一比一原版(SFU毕业证)西蒙菲莎大学毕业证成绩单如何办理一比一原版(SFU毕业证)西蒙菲莎大学毕业证成绩单如何办理
一比一原版(SFU毕业证)西蒙菲莎大学毕业证成绩单如何办理
bakpo1
 
Fundamentals of Electric Drives and its applications.pptx
Fundamentals of Electric Drives and its applications.pptxFundamentals of Electric Drives and its applications.pptx
Fundamentals of Electric Drives and its applications.pptx
manasideore6
 
AP LAB PPT.pdf ap lab ppt no title specific
AP LAB PPT.pdf ap lab ppt no title specificAP LAB PPT.pdf ap lab ppt no title specific
AP LAB PPT.pdf ap lab ppt no title specific
BrazilAccount1
 
The Benefits and Techniques of Trenchless Pipe Repair.pdf
The Benefits and Techniques of Trenchless Pipe Repair.pdfThe Benefits and Techniques of Trenchless Pipe Repair.pdf
The Benefits and Techniques of Trenchless Pipe Repair.pdf
Pipe Restoration Solutions
 
Final project report on grocery store management system..pdf
Final project report on grocery store management system..pdfFinal project report on grocery store management system..pdf
Final project report on grocery store management system..pdf
Kamal Acharya
 
CME397 Surface Engineering- Professional Elective
CME397 Surface Engineering- Professional ElectiveCME397 Surface Engineering- Professional Elective
CME397 Surface Engineering- Professional Elective
karthi keyan
 
Planning Of Procurement o different goods and services
Planning Of Procurement o different goods and servicesPlanning Of Procurement o different goods and services
Planning Of Procurement o different goods and services
JoytuBarua2
 
DESIGN A COTTON SEED SEPARATION MACHINE.docx
DESIGN A COTTON SEED SEPARATION MACHINE.docxDESIGN A COTTON SEED SEPARATION MACHINE.docx
DESIGN A COTTON SEED SEPARATION MACHINE.docx
FluxPrime1
 
Governing Equations for Fundamental Aerodynamics_Anderson2010.pdf
Governing Equations for Fundamental Aerodynamics_Anderson2010.pdfGoverning Equations for Fundamental Aerodynamics_Anderson2010.pdf
Governing Equations for Fundamental Aerodynamics_Anderson2010.pdf
WENKENLI1
 
Cosmetic shop management system project report.pdf
Cosmetic shop management system project report.pdfCosmetic shop management system project report.pdf
Cosmetic shop management system project report.pdf
Kamal Acharya
 
在线办理(ANU毕业证书)澳洲国立大学毕业证录取通知书一模一样
在线办理(ANU毕业证书)澳洲国立大学毕业证录取通知书一模一样在线办理(ANU毕业证书)澳洲国立大学毕业证录取通知书一模一样
在线办理(ANU毕业证书)澳洲国立大学毕业证录取通知书一模一样
obonagu
 
Student information management system project report ii.pdf
Student information management system project report ii.pdfStudent information management system project report ii.pdf
Student information management system project report ii.pdf
Kamal Acharya
 
HYDROPOWER - Hydroelectric power generation
HYDROPOWER - Hydroelectric power generationHYDROPOWER - Hydroelectric power generation
HYDROPOWER - Hydroelectric power generation
Robbie Edward Sayers
 
road safety engineering r s e unit 3.pdf
road safety engineering  r s e unit 3.pdfroad safety engineering  r s e unit 3.pdf
road safety engineering r s e unit 3.pdf
VENKATESHvenky89705
 
Investor-Presentation-Q1FY2024 investor presentation document.pptx
Investor-Presentation-Q1FY2024 investor presentation document.pptxInvestor-Presentation-Q1FY2024 investor presentation document.pptx
Investor-Presentation-Q1FY2024 investor presentation document.pptx
AmarGB2
 

Recently uploaded (20)

CFD Simulation of By-pass Flow in a HRSG module by R&R Consult.pptx
CFD Simulation of By-pass Flow in a HRSG module by R&R Consult.pptxCFD Simulation of By-pass Flow in a HRSG module by R&R Consult.pptx
CFD Simulation of By-pass Flow in a HRSG module by R&R Consult.pptx
 
一比一原版(IIT毕业证)伊利诺伊理工大学毕业证成绩单专业办理
一比一原版(IIT毕业证)伊利诺伊理工大学毕业证成绩单专业办理一比一原版(IIT毕业证)伊利诺伊理工大学毕业证成绩单专业办理
一比一原版(IIT毕业证)伊利诺伊理工大学毕业证成绩单专业办理
 
space technology lecture notes on satellite
space technology lecture notes on satellitespace technology lecture notes on satellite
space technology lecture notes on satellite
 
English lab ppt no titlespecENG PPTt.pdf
English lab ppt no titlespecENG PPTt.pdfEnglish lab ppt no titlespecENG PPTt.pdf
English lab ppt no titlespecENG PPTt.pdf
 
一比一原版(UofT毕业证)多伦多大学毕业证成绩单如何办理
一比一原版(UofT毕业证)多伦多大学毕业证成绩单如何办理一比一原版(UofT毕业证)多伦多大学毕业证成绩单如何办理
一比一原版(UofT毕业证)多伦多大学毕业证成绩单如何办理
 
一比一原版(SFU毕业证)西蒙菲莎大学毕业证成绩单如何办理
一比一原版(SFU毕业证)西蒙菲莎大学毕业证成绩单如何办理一比一原版(SFU毕业证)西蒙菲莎大学毕业证成绩单如何办理
一比一原版(SFU毕业证)西蒙菲莎大学毕业证成绩单如何办理
 
Fundamentals of Electric Drives and its applications.pptx
Fundamentals of Electric Drives and its applications.pptxFundamentals of Electric Drives and its applications.pptx
Fundamentals of Electric Drives and its applications.pptx
 
AP LAB PPT.pdf ap lab ppt no title specific
AP LAB PPT.pdf ap lab ppt no title specificAP LAB PPT.pdf ap lab ppt no title specific
AP LAB PPT.pdf ap lab ppt no title specific
 
The Benefits and Techniques of Trenchless Pipe Repair.pdf
The Benefits and Techniques of Trenchless Pipe Repair.pdfThe Benefits and Techniques of Trenchless Pipe Repair.pdf
The Benefits and Techniques of Trenchless Pipe Repair.pdf
 
Final project report on grocery store management system..pdf
Final project report on grocery store management system..pdfFinal project report on grocery store management system..pdf
Final project report on grocery store management system..pdf
 
CME397 Surface Engineering- Professional Elective
CME397 Surface Engineering- Professional ElectiveCME397 Surface Engineering- Professional Elective
CME397 Surface Engineering- Professional Elective
 
Planning Of Procurement o different goods and services
Planning Of Procurement o different goods and servicesPlanning Of Procurement o different goods and services
Planning Of Procurement o different goods and services
 
DESIGN A COTTON SEED SEPARATION MACHINE.docx
DESIGN A COTTON SEED SEPARATION MACHINE.docxDESIGN A COTTON SEED SEPARATION MACHINE.docx
DESIGN A COTTON SEED SEPARATION MACHINE.docx
 
Governing Equations for Fundamental Aerodynamics_Anderson2010.pdf
Governing Equations for Fundamental Aerodynamics_Anderson2010.pdfGoverning Equations for Fundamental Aerodynamics_Anderson2010.pdf
Governing Equations for Fundamental Aerodynamics_Anderson2010.pdf
 
Cosmetic shop management system project report.pdf
Cosmetic shop management system project report.pdfCosmetic shop management system project report.pdf
Cosmetic shop management system project report.pdf
 
在线办理(ANU毕业证书)澳洲国立大学毕业证录取通知书一模一样
在线办理(ANU毕业证书)澳洲国立大学毕业证录取通知书一模一样在线办理(ANU毕业证书)澳洲国立大学毕业证录取通知书一模一样
在线办理(ANU毕业证书)澳洲国立大学毕业证录取通知书一模一样
 
Student information management system project report ii.pdf
Student information management system project report ii.pdfStudent information management system project report ii.pdf
Student information management system project report ii.pdf
 
HYDROPOWER - Hydroelectric power generation
HYDROPOWER - Hydroelectric power generationHYDROPOWER - Hydroelectric power generation
HYDROPOWER - Hydroelectric power generation
 
road safety engineering r s e unit 3.pdf
road safety engineering  r s e unit 3.pdfroad safety engineering  r s e unit 3.pdf
road safety engineering r s e unit 3.pdf
 
Investor-Presentation-Q1FY2024 investor presentation document.pptx
Investor-Presentation-Q1FY2024 investor presentation document.pptxInvestor-Presentation-Q1FY2024 investor presentation document.pptx
Investor-Presentation-Q1FY2024 investor presentation document.pptx
 

Offshore structures

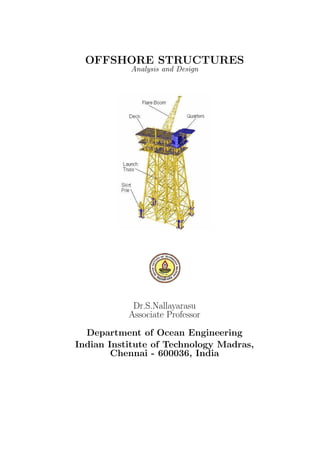
  • 1. OFFSHORE STRUCTURES Analysis and Design Dr.S.Nallayarasu Associate Professor Department of Ocean Engineering Indian Institute of Technology Madras, Chennai - 600036, India
  • 2. 2
  • 3. Contents 1 INTRODUCTION 9 1.1 General . . . . . . . . . . . . . . . . . . . . . . . . . . . . . . . . . . . . . . 9 1.2 Types of Offshore Structures . . . . . . . . . . . . . . . . . . . . . . . . . . . 10 1.3 Fixed Platforms . . . . . . . . . . . . . . . . . . . . . . . . . . . . . . . . . . 11 1.3.1 Steel template Structures . . . . . . . . . . . . . . . . . . . . . . . . . 11 1.3.2 Concrete Gravity Platforms . . . . . . . . . . . . . . . . . . . . . . . 11 1.4 Compliant Structures . . . . . . . . . . . . . . . . . . . . . . . . . . . . . . . 15 1.4.1 Compliant Tower . . . . . . . . . . . . . . . . . . . . . . . . . . . . . 15 1.4.2 Guyed Tower . . . . . . . . . . . . . . . . . . . . . . . . . . . . . . . 16 1.4.3 Tension Leg Platforms . . . . . . . . . . . . . . . . . . . . . . . . . . 16 1.4.4 Articulated Tower . . . . . . . . . . . . . . . . . . . . . . . . . . . . . 17 1.5 Floating Structures . . . . . . . . . . . . . . . . . . . . . . . . . . . . . . . . 18 1.5.1 Floating Production System . . . . . . . . . . . . . . . . . . . . . . . 18 1.5.2 Floating Production, Storage and offloading System . . . . . . . . . . 19 1.6 Subsea System . . . . . . . . . . . . . . . . . . . . . . . . . . . . . . . . . . 19 1.7 Fixed Platform Concepts . . . . . . . . . . . . . . . . . . . . . . . . . . . . . 20 1.7.1 Functional Classification . . . . . . . . . . . . . . . . . . . . . . . . . 20 1.7.2 Geometrical Classification . . . . . . . . . . . . . . . . . . . . . . . . 20 3
  • 4. Contents Contents 1.7.3 Foundation Concepts . . . . . . . . . . . . . . . . . . . . . . . . . . . 21 2 DESIGN METHODOLOGY 23 2.1 General . . . . . . . . . . . . . . . . . . . . . . . . . . . . . . . . . . . . . . 23 2.2 Design Stages . . . . . . . . . . . . . . . . . . . . . . . . . . . . . . . . . . . 24 2.2.1 FEED . . . . . . . . . . . . . . . . . . . . . . . . . . . . . . . . . . . 24 2.2.2 Basic Design . . . . . . . . . . . . . . . . . . . . . . . . . . . . . . . . 24 2.2.3 Detailed Design . . . . . . . . . . . . . . . . . . . . . . . . . . . . . . 25 3 LOADS 29 3.1 General . . . . . . . . . . . . . . . . . . . . . . . . . . . . . . . . . . . . . . 29 3.2 Types of Loads . . . . . . . . . . . . . . . . . . . . . . . . . . . . . . . . . . 29 3.3 Gravity Loads . . . . . . . . . . . . . . . . . . . . . . . . . . . . . . . . . . . 30 3.3.1 Dead Loads . . . . . . . . . . . . . . . . . . . . . . . . . . . . . . . . 30 3.3.2 Facility Dead Loads . . . . . . . . . . . . . . . . . . . . . . . . . . . . 30 3.3.3 Fluid Loads . . . . . . . . . . . . . . . . . . . . . . . . . . . . . . . . 30 3.3.4 Live Loads . . . . . . . . . . . . . . . . . . . . . . . . . . . . . . . . . 31 3.3.5 Drilling Loads . . . . . . . . . . . . . . . . . . . . . . . . . . . . . . . 31 3.4 Environmental Loads . . . . . . . . . . . . . . . . . . . . . . . . . . . . . . . 31 3.4.1 Wind Loads . . . . . . . . . . . . . . . . . . . . . . . . . . . . . . . . 31 3.4.2 Wave and Current Loads . . . . . . . . . . . . . . . . . . . . . . . . . 34 3.4.3 Current Profile . . . . . . . . . . . . . . . . . . . . . . . . . . . . . . 35 3.4.4 Marine Growth . . . . . . . . . . . . . . . . . . . . . . . . . . . . . . 36 3.4.5 Morison Equation . . . . . . . . . . . . . . . . . . . . . . . . . . . . . 37 3.4.6 Wave-Current Interaction . . . . . . . . . . . . . . . . . . . . . . . . 37 4
  • 5. Contents Contents 3.4.7 Selection of Wave Theory . . . . . . . . . . . . . . . . . . . . . . . . 38 3.4.8 Wave Load on a Member . . . . . . . . . . . . . . . . . . . . . . . . . 39 3.4.9 Maximum Global Loads . . . . . . . . . . . . . . . . . . . . . . . . . 44 3.4.10 Buoyancy Loads . . . . . . . . . . . . . . . . . . . . . . . . . . . . . . 45 3.4.11 Ice Loads . . . . . . . . . . . . . . . . . . . . . . . . . . . . . . . . . 47 3.4.12 Mud Loads . . . . . . . . . . . . . . . . . . . . . . . . . . . . . . . . 48 3.5 Load Estimation and Distribution . . . . . . . . . . . . . . . . . . . . . . . . 49 3.6 Load Combinations . . . . . . . . . . . . . . . . . . . . . . . . . . . . . . . . 51 4 MATERIALS AND CORROSION 53 4.1 General . . . . . . . . . . . . . . . . . . . . . . . . . . . . . . . . . . . . . . 53 4.2 Structural Steel . . . . . . . . . . . . . . . . . . . . . . . . . . . . . . . . . . 54 4.2.1 Structural Member Classification . . . . . . . . . . . . . . . . . . . . 54 4.2.2 Steel Grades . . . . . . . . . . . . . . . . . . . . . . . . . . . . . . . . 54 4.2.3 Manufacturing . . . . . . . . . . . . . . . . . . . . . . . . . . . . . . 56 4.2.4 Chemical Requirements . . . . . . . . . . . . . . . . . . . . . . . . . 56 4.2.5 Carbon Equivalent (CE) . . . . . . . . . . . . . . . . . . . . . . . . . 56 4.2.6 Mechanical Requirements . . . . . . . . . . . . . . . . . . . . . . . . 57 4.2.7 Notch Toughness Requirements . . . . . . . . . . . . . . . . . . . . . 57 4.2.8 Supplementary Requirements . . . . . . . . . . . . . . . . . . . . . . 57 4.3 Corrosion . . . . . . . . . . . . . . . . . . . . . . . . . . . . . . . . . . . . . 57 4.3.1 Seawater Corrosion . . . . . . . . . . . . . . . . . . . . . . . . . . . . 57 4.3.2 Factors influencing corrosion . . . . . . . . . . . . . . . . . . . . . . . 58 4.3.3 types of corrosion . . . . . . . . . . . . . . . . . . . . . . . . . . . . . 60 4.3.4 Rates of corrosion . . . . . . . . . . . . . . . . . . . . . . . . . . . . . 61 5
  • 6. Contents Contents 4.4 Corrosion Protection . . . . . . . . . . . . . . . . . . . . . . . . . . . . . . . 62 4.5 Cathodic Protection . . . . . . . . . . . . . . . . . . . . . . . . . . . . . . . 62 4.5.1 Sacrificial Anode System . . . . . . . . . . . . . . . . . . . . . . . . . 63 5 SIMULATION 67 5.1 General . . . . . . . . . . . . . . . . . . . . . . . . . . . . . . . . . . . . . . 67 5.2 Structure Geometry selection . . . . . . . . . . . . . . . . . . . . . . . . . . 68 5.3 Geometry Simulation . . . . . . . . . . . . . . . . . . . . . . . . . . . . . . . 68 5.3.1 Axis System . . . . . . . . . . . . . . . . . . . . . . . . . . . . . . . . 69 5.3.2 Joints or Nodes . . . . . . . . . . . . . . . . . . . . . . . . . . . . . . 69 5.3.3 Members and properties . . . . . . . . . . . . . . . . . . . . . . . . . 70 5.3.4 Offsets and Eccentricities . . . . . . . . . . . . . . . . . . . . . . . . . 71 5.3.5 Wish-bone Connections . . . . . . . . . . . . . . . . . . . . . . . . . . 71 5.3.6 Dummy Structure Models . . . . . . . . . . . . . . . . . . . . . . . . 72 5.4 Foundation Simulation . . . . . . . . . . . . . . . . . . . . . . . . . . . . . . 75 5.4.1 Pile Modelling . . . . . . . . . . . . . . . . . . . . . . . . . . . . . . . 75 5.4.2 Soil Simulation . . . . . . . . . . . . . . . . . . . . . . . . . . . . . . 77 5.4.3 Pile Group Effect . . . . . . . . . . . . . . . . . . . . . . . . . . . . . 77 5.5 Load Simulation . . . . . . . . . . . . . . . . . . . . . . . . . . . . . . . . . . 80 5.5.1 Dead Loads . . . . . . . . . . . . . . . . . . . . . . . . . . . . . . . . 80 5.5.2 Equipment Loads . . . . . . . . . . . . . . . . . . . . . . . . . . . . . 80 5.5.3 Fluid Loads . . . . . . . . . . . . . . . . . . . . . . . . . . . . . . . . 80 5.5.4 Drilling Loads . . . . . . . . . . . . . . . . . . . . . . . . . . . . . . . 81 5.5.5 Live Loads . . . . . . . . . . . . . . . . . . . . . . . . . . . . . . . . . 81 5.5.6 Wind, Wave and Current . . . . . . . . . . . . . . . . . . . . . . . . . 81 6
  • 7. Contents Contents 6 In-place Analyses 85 6.1 Principle . . . . . . . . . . . . . . . . . . . . . . . . . . . . . . . . . . . . . . 85 6.2 Geometry Simulation . . . . . . . . . . . . . . . . . . . . . . . . . . . . . . . 86 6.2.1 Simplified Topside Model . . . . . . . . . . . . . . . . . . . . . . . . . 87 6.2.2 Load Simulation . . . . . . . . . . . . . . . . . . . . . . . . . . . . . 87 6.2.3 Topsides Load COG Shift Envelope . . . . . . . . . . . . . . . . . . . 88 6.2.4 Minimum and Maximum Water Depth . . . . . . . . . . . . . . . . . 88 6.2.5 Maximum Wave Loads . . . . . . . . . . . . . . . . . . . . . . . . . . 89 6.2.6 Allowable Stresses . . . . . . . . . . . . . . . . . . . . . . . . . . . . 89 7 Dynamic Analysis 91 7.1 Principle . . . . . . . . . . . . . . . . . . . . . . . . . . . . . . . . . . . . . . 91 7.2 Geometry Simulation . . . . . . . . . . . . . . . . . . . . . . . . . . . . . . . 91 7.3 Load Simulation . . . . . . . . . . . . . . . . . . . . . . . . . . . . . . . . . . 92 7.3.1 Computer Generated Mass . . . . . . . . . . . . . . . . . . . . . . . . 92 7.3.2 Direct Input Mass . . . . . . . . . . . . . . . . . . . . . . . . . . . . 92 7.4 Foundation Simulation . . . . . . . . . . . . . . . . . . . . . . . . . . . . . . 93 7.5 Solution . . . . . . . . . . . . . . . . . . . . . . . . . . . . . . . . . . . . . . 93 7.5.1 Dynamic Amplification factor . . . . . . . . . . . . . . . . . . . . . . 94 8 Fatigue Analysis 95 8.1 General . . . . . . . . . . . . . . . . . . . . . . . . . . . . . . . . . . . . . . 95 8.2 Deterministic Fatigue Analysis . . . . . . . . . . . . . . . . . . . . . . . . . . 95 8.3 Wave Scatter Data . . . . . . . . . . . . . . . . . . . . . . . . . . . . . . . . 96 8.4 Spectral Fatigue Analysis . . . . . . . . . . . . . . . . . . . . . . . . . . . . . 98 7
  • 8. Contents Contents 8.4.1 Principle . . . . . . . . . . . . . . . . . . . . . . . . . . . . . . . . . . 98 8.4.2 Wave Spectra . . . . . . . . . . . . . . . . . . . . . . . . . . . . . . . 98 8.4.3 Wave Theory Selection . . . . . . . . . . . . . . . . . . . . . . . . . . 99 8.4.4 Wave Steepness . . . . . . . . . . . . . . . . . . . . . . . . . . . . . . 99 8.4.5 Transfer Functions . . . . . . . . . . . . . . . . . . . . . . . . . . . . 99 8.4.6 Selection of Frequencies . . . . . . . . . . . . . . . . . . . . . . . . . 100 8.4.7 Stress Amplitudes . . . . . . . . . . . . . . . . . . . . . . . . . . . . . 100 8.4.8 Fatigue Life Calculation . . . . . . . . . . . . . . . . . . . . . . . . . 101 8.4.9 S-N Curves . . . . . . . . . . . . . . . . . . . . . . . . . . . . . . . . 102 8.4.10 Stress Concentration Factors . . . . . . . . . . . . . . . . . . . . . . . 102 8.4.11 Foundation Linearisation . . . . . . . . . . . . . . . . . . . . . . . . . 104 9 Ship Impact Analysis 107 9.1 Impact Vessels . . . . . . . . . . . . . . . . . . . . . . . . . . . . . . . . . . . 107 9.2 Principle . . . . . . . . . . . . . . . . . . . . . . . . . . . . . . . . . . . . . . 108 9.3 Method of Computing Impact Energy Dissipation . . . . . . . . . . . . . . . 108 9.4 Energy dissipation by member . . . . . . . . . . . . . . . . . . . . . . . . . . 108 9.5 Energy Dissipation by Overall jacket deflection . . . . . . . . . . . . . . . . . 110 9.6 Structural Strength During Impact . . . . . . . . . . . . . . . . . . . . . . . 110 9.7 Push Over Analysis . . . . . . . . . . . . . . . . . . . . . . . . . . . . . . . . 110 8
  • 9. Chapter 1 INTRODUCTION 1.1 General One of the greatest discovery of 20th century was oil and it has so many applications that it cannot be separated from mankind. The oil exploration has started as early as 1900 and the oil exploration initially was concentrated on on land. As the need for oil expands in an explosive rate, need for find new discoveries was eminent. During the middle of 20th century, oil discovery started in near shore and medium range of water depth. The need for qualified offshore structural personnel are rapidly increasing as the oil industry moves into deeper water in the search for additional supplies of oil and gas, new technology is emerging at a rapid peace for the development of new concepts for offshore platforms. This book gives brief introduction to offshore engineering with basic concepts of various types of offshore structures and provide insight into various design issues and requirements, fabrication and installation techniques. Chapter 1 gives introduction in to types of offshore platforms based on water depth require- ments, geometry and installation concepts. Chapter 2 gives some introduction to design methodology, and various design stages in a offshore development project. Chapter 3 gives basic loads applied on offshore structures and techniques of calculations of such loading. Chapter 4 gives introduction to material requirement for offshore structures including cor- rosion. 9
  • 10. 1.2. Types of Offshore Structures Chapter 1. INTRODUCTION Chapter 5 gives introduction to materials used for offshore structures, and corrosion and cathodic protection. Chapter 6 describes inplace analysis methodology, load combinations and and various prin- ciples involved in the design. Chapter 7 describes methodology to carry out the dynamic analysis of an offshore platform and its application to fatigue and seismic analyses. Chapter 8 gives method of fatigue analysis such as deterministic and spectral methods in- cluding, selection of S-N curves, SCF equations etc. Chapter 9 give some introduction in to ship impact with offshore platforms and method to carry out push over analysis. 1.2 Types of Offshore Structures The offshore structures built in the ocean to explore oil and gas are located in depths from very shallow water to the deep ocean. Depending on the water depth and environmental conditions, the structural arrangement and need for new ideas required. Based on geometry and behaviour, the offshore structures for oil and gas development has been divided into following categories. 1. Fixed Platforms • Steel template Structures • Concrete Gravity Structures 2. Compliant tower • Compliant Tower • Guyed Tower • Articulated Tower • Tension Leg Platform 3. Floating Structures • Floating Production System • Floating Production, Storage and Offloading System 10
  • 11. 1.3. Fixed Platforms Chapter 1. INTRODUCTION 1.3 Fixed Platforms The fixed type of platform shall exhibit a low natural period and deflection again environ- mental loads. 1.3.1 Steel template Structures The steel template type structure consists of a tall vertical section made of tubular steel members supported by piles driven into the sea be with a deck placed on top, providing space for crew quarters, a drilling rig, and production facilities. The fixed platform is economically feasible for installation in water depths up to 500m. These template type structures will be fixed to seabed by means of tubular piles either driven through legs of the jacket (main piles) or through skirt sleeves attached to the bottom of the jacket. The principle behind the fixed platform design is to minimize the natural period of the structure below 4 seconds to avoid resonant behaviour with the waves (period in the order of 4 to 25 seconds. The structural and foundation configuration shall be selected to achieve this concept. 1.3.2 Concrete Gravity Platforms Concrete gravity platforms are mostly used in the areas where feasibility of pile installation is remote. These platforms are very common in areas with strong seabed geological conditions either with rock outcrop or sandy formation. Some part of north sea oil fields and Australian coast, these kind of platforms are located. The concrete gravity platform by its name derive its horizontal stability against environmen- tal forces by means of its weight. These structures are basically concrete shells assembled in circular array with stem columns projecting to above water to support the deck and facilities. Concrete gravity platforms have been constructed in water depths as much as 350m. 11
  • 12. 1.3. Fixed Platforms Chapter 1. INTRODUCTION Figure 1.1: Different types of Offshore Structures 12
  • 13. 1.3. Fixed Platforms Chapter 1. INTRODUCTION Figure 1.2: Fixed Template type platform 13
  • 14. 1.3. Fixed Platforms Chapter 1. INTRODUCTION Figure 1.3: Concrete Gravity Platform 14
  • 15. 1.4. Compliant Structures Chapter 1. INTRODUCTION Figure 1.4: Complaint Tower Platform 1.4 Compliant Structures In addition to the developing technologies for exploration and production of oil and natural gas, new concepts in deepwater systems and facilities have emerged to make ultra-deepwater projects a reality. With wells being drilled in water depths of 3000m, the traditional fixed offshore platform is being replaced by state-of-the-art deepwater production facilities. Com- pliant Towers, Tension Leg Platforms, Spars, Subsea Systems, Floating Production Systems, and Floating Production, Storage and Offloading Systems are now being used in water depths exceeding 500m. All of these systems are proven technology, and in use in offshore production worldwide. 1.4.1 Compliant Tower Compliant Tower (CT) consists of a narrow, flexible tower and a piled foundation that can support a conventional deck for drilling and production operations. Unlike the fixed platform, the compliant tower withstands large lateral forces by sustaining significant lateral deflections, and is usually used in water depths between 300m and 600m. 15
  • 16. 1.4. Compliant Structures Chapter 1. INTRODUCTION Figure 1.5: Tension Leg Platforms 1.4.2 Guyed Tower Guyed tower is an extension of complaint tower with guy wires tied to the seabed by means of anchors or piles. This guy ropes minimises the lateral displacement of the platform topsides. This further changes the dynamic characteristics of the system. 1.4.3 Tension Leg Platforms A Tension-leg platform is a vertically moored floating structure normally used for the offshore production of oil or gas, and is particularly suited for water depths around 1000m to 1200 metres (about 4000 ft). The platform is permanently moored by means of tethers or tendons grouped at each of the structure’s corners. A group of tethers is called a tension leg. A feature of the design of the tethers is that they have relatively high axial stiffness (low elasticity), such that virtually all vertical motion of the platform is eliminated. This allows the platform to have the production wellheads on deck (connected directly to the subsea wells by rigid risers), instead of on the seafloor. This makes for a cheaper well completion and gives better control over the production from the oil or gas reservoir. Tension Leg Platform (TLP) consists of a floating structure held in place by vertical, ten- 16
  • 17. 1.4. Compliant Structures Chapter 1. INTRODUCTION Figure 1.6: SeaStar sioned tendons connected to the sea floor by pile-secured templates. Tensioned tendons provide for the use of a TLP in a broad water depth range with limited vertical motion. The larger TLP’s have been successfully deployed in water depths approaching 1250m. Mini-Tension Leg Platform (Mini-TLP) is a floating mini-tension leg platform of relatively low cost developed for production of smaller deepwater reserves which would be uneconomic to produce using more conventional deepwater production systems. It can also be used as a utility, satellite, or early production platform for larger deepwater discoveries. The world’s first Mini-TLP was installed in the Gulf of Mexico in 1998. SPAR Platform (SPAR) consists of a large diameter single vertical cylinder supporting a deck. It has a typical fixed platform topside (surface deck with drilling and production equipment), three types of risers (production, drilling, and export), and a hull which is moored using a taut catenary system of six to twenty lines anchored into the seafloor. SPAR’s are presently used in water depths up to 1000m, although existing technology can extend its use to water depths as great as 2500m. 17
  • 18. 1.4. Compliant Structures Chapter 1. INTRODUCTION 1.4.4 Articulated Tower Articulated tower is an extension of tension leg platform. The tension cables are replaced by one single buoyant shell with sufficient buoyancy and required restoring moment against lateral loads. The main part of the configuration is the universal joint which connects the shell with the foundation system. The foundation system usually consists of gravity based concrete block or some times with driven piles. The articulated tower concept is well suited for intermediate water depths ranging from 150m to 500m. Figure 1.7: Articulated Tower Platforms 18
  • 19. 1.5. Floating Structures Chapter 1. INTRODUCTION 1.5 Floating Structures 1.5.1 Floating Production System Floating Production System (FPS) consists of a semi-submersible unit which is equipped with drilling and production equipment. It is anchored in place with wire rope and chain, or can be dynamically positioned using rotating thrusters. Production from subsea wells is transported to the surface deck through production risers designed to accommodate platform motion. The FPS can be used in a range of water depths from 600m to 2500m feet. 1.5.2 Floating Production, Storage and offloading System Floating Production, Storage and Offloading System (FPSO) consists of a large tanker type vessel moored to the seafloor. An FPSO is designed to process and stow production from nearby subsea wells and to periodically offload the stored oil to a smaller shuttle tanker. The shuttle tanker then transports the oil to an onshore facility for further processing. An FPSO may be suited for marginally economic fields located in remote deepwater areas where a pipeline infrastructure does not exist. Currently, there are no FPSO’s approved for use in the Gulf of Mexico. However, there are over 70 of these systems being used elsewhere in the world. 1.6 Subsea System Subsea System (SS) ranges from single subsea wells producing to a nearby platform, FPS, or TLP to multiple wells producing through a manifold and pipeline system to a distant production facility. These systems are presently used in water depths greater than 1500m. 1.7 Fixed Platform Concepts For the last few decades, the fixed platform concept has been utilized extensively over 300m depth with various configurations. 19
  • 20. 1.7. Fixed Platform Concepts Chapter 1. INTRODUCTION Figure 1.8: Floating Production storage and offloading system (FPSO) 1.7.1 Functional Classification The offshore platforms for oil and gas exploration purpose can be classified based on func- tionality and purpose of installation. • Wellhead platform - primarily meant for drilling and supporting wellhead equipment. It supports very few equipment such as wellhead control panel and piping. Occasionally it also supports helicopter landing structure for emergency evacuation. • Process Platform - primary meant for production facilities (oil or gas) and it may support in addition to equipment for production, such as power generation, utilities and living quarters. • Riser Platform - This is another kind of structure specially built to support all the incoming and outgoing risers on a planned complex. This will also be connected to the main platform by bridge. • Living Quarters Platform - Some times due to safety requirements, the living quar- ters will be supported on a separate structure away from the wellhead and process platforms. This types of platform will be located atleas 50m away from the neighbor- ing process platforms and will be connected by a bridge. 20
  • 21. 1.7. Fixed Platform Concepts Chapter 1. INTRODUCTION Figure 1.9: Platform Complex • Flare Support Platform- The flare boom structure to flare the excess gas from well reservoirs may be supported on a separate structure either a tripod or four legged jacket for safety reasons. This is to avoid excessive heat on wellhead and process equipment on the neighboring platforms. Usually this will located away by a distance to be calculated based on the heat output during flaring. 1.7.2 Geometrical Classification The structural configuration of fixed template type structures vary extensively from location to location depending on the requirement and environmental conditions such as water depth, wave and current loads etc. Based on geometry, jackets can be classified in to following categories. • Tripod - basically to support minimum facility such as few wellhead and riser or to support a bridge between two major platforms or to support a flare boom • 4 Legged- typically for wellhead platforms • 6 or 8 Legged - mainly for process complex 21
  • 22. 1.7. Fixed Platform Concepts Chapter 1. INTRODUCTION 1.7.3 Foundation Concepts The offshore platforms shall be fixed to the seabed by means of piles either driven through the main legs of the jacket or through skirt sleeves attached to the jacket legs or the combinations of both main and skirt piles. This kind of arrangement is shown in the following pictures. 22
  • 23. Chapter 2 DESIGN METHODOLOGY 2.1 General The design of offshore structure is not an single step design process. The structural config- uration, arrangement, member sizes and its specification requirements can be arrived after few design cycles. In order to achieve a optimum design suitable for the installation method proposed and satisfy the final operating requirements, a design procedure suitable for the project shall be developed. In an offshore project, the design of structural elements cannot be initiated unless the basic understanding of the needs are identified. The basic needs are • What is the type of platform ? Oil or Gas, Process or Wellhead or Quarters etc • What is floor area of topsides required ? • Expected maximum weight of facilities ? • What is basic water depth and environmental parameters such as wave and current ? • Where is it located ?. Earthquake prone ?. • What is type of installation ? Lift installed or Launch installed ? • Any CAPEX constraints ? The answer to the above questions will give some indication of type of jacket and topsides required. 23
  • 24. 2.2. Design Stages Chapter 2. DESIGN METHODOLOGY 2.2 Design Stages The various design stages in an offshore project is listed below. • Front End Engineering Design (FEED) or Concept Selection • Basic Design • Detailed Design 2.2.1 FEED The first step in initiating an offshore project is a FEED or concept selection. This stage of project will involve following steps in all disciplines such as Process, Mechanical, Electrical and Instrumentation in addition to Structural Engineering. • Collection Process Data and identifying process needs and equipment • Preliminary equipment sizing and area requirements • Weight estimation based on past projects • Identification of Structural configurations • Preliminary estimation of structural weight • Identification of installation methods • Estimation of CAPEX within ±40%. The above activities will define the project to a basic understanding and will provide enough insight into carrying out further engineering activities. 2.2.2 Basic Design At this stage of the project, the data collected during the FEED stage will be further verified to make sure the authenticity and reliability of such data for further use. A detailed weight estimates of all items involved in the project will be carried out. The process and mechanical requirements will be further defined and identified. A Design Basis (DB) will be developed for the proposed facility containing following information. 24
  • 25. 2.2. Design Stages Chapter 2. DESIGN METHODOLOGY • Process information containing type of well fluid (oil or gas) and its characteristics, safety requirements and kind of process technology to be adopted. • Mechanical requirement such as type of facility and basic equipment required for the process, and material handling and safety • Electrical requirement such power generation equipment, lighting and switch gears etc • Instrumentation requirement such as basic control system, feedback requirement etc. • Piping information such as pressures, pipe sizes required etc. • Meta-Ocean information such as water depth, wave, current, wind and tidal infor- mation at the site. • Structural requirement such as materials proposed or available for use in the country, design method to be adopted, codes and specifications to be used etc. • Installation information such as type of barge, lifting crane, loadout-method, piling hammer etc. At the basic design stage, the deck area required, number deck levels, etc will be defined. This will lead to identification of number of legs required to support the deck. Normally the spacing between deck legs for a typical platform can vary from 10m to 20m beyond which it may become uneconomical to design a braced deck truss structure. Basic weight estimates for various disciplines such as structural, mechanical, electrical, in- strumentation and piping will be carried out. Based on the weight of total deck, it may then be decided to fabricate the deck in one piece or in various modules. This kind decision can only be taken together with the viable installation options such ”Availability of Heavy Lift vessels in the region” or use of float-over technique. In case such methods are not possible, then the total topsides shall be divided in to various functional modules such as compres- sion module, process module module, utility module, quarters module, etc. These modules are self contained units with structure, piping, equipment etc fabricated and transported to the site. These modules are then installed on top of the ”module Support Frame”, which transfers the loads to the jacket. Some times this module support frame may not needed, if the modules are organised properly over the legs. This kind of basic ideas shall be made at the basic design stage. 25
  • 26. 2.2. Design Stages Chapter 2. DESIGN METHODOLOGY Figure 2.1: Deck Installation Concepts - Integrated Deck (Single Lift) Figure 2.2: Deck Installation Concepts - Integrated Deck (Float Over) 26
  • 27. 2.2. Design Stages Chapter 2. DESIGN METHODOLOGY Utility Module Living Quarters Wellhead Module Process Module Module Support Frame Drill Rig Figure 2.3: Deck Installation Concepts - Modular Deck (MSF) Compression Module Living Quarters Process Module Utility Module Offshore Splice Figure 2.4: Deck Installation Concepts - Modular Deck (Modules) 27
  • 28. 2.2. Design Stages Chapter 2. DESIGN METHODOLOGY 2.2.3 Detailed Design Detailed design of offshore platform will be initiated once the basic design confirms the economic viability and technical feasibility. In the Detailed design or engineering of an offshore platform following items of the jacket and deck will be developed in detail. Deck Jacket Framing Plans Framing Plans Framing Elevations Framing Elevations Joint Details Joint Details Plate Girder Details Pile make-up Connection Details Launch Truss Details Welding Details Welding Details Deck plating & grating Launch Cradle details Stairways and Walkways Walkways Lifting Padeyes Lifting Padeyes Transportation tie-down Transportation Tie-down Monorails Details Caissons and supports Equipment Support Details Conductor guides Flare Boom Barge Bumbers Bridge Boat Landing Crane Pedestal Closure Plate details Riser Clamps Table 2.1: Detailed Design Items All necessary analysis required to complete the design above items shall be carried out. 28
  • 29. 2.2. Design Stages Chapter 2. DESIGN METHODOLOGY Deck Jacket Inplace Inplace Loadout Loadout Sea Transportation Sea Transportation Lifting or Floatover Lifting or Launch Miscellaneous Calculations Upending Dynamic Fatigue (Deterministic or Spectral) On bottom Stability Pile Driveability Cathodic Protection Ship Impact Table 2.2: Detailed Design Analysis 29
  • 30. 2.2. Design Stages Chapter 2. DESIGN METHODOLOGY 30
  • 31. Chapter 3 LOADS 3.1 General 3.2 Types of Loads Loads on offshore structures are gravity loads and environmental loads. Gravity loads are arising from dead weight of structure and facilities either permanent or temporary. Seismic loads are arising from gravity loads and is a derived type. Environmental loads play a major role governing the design of offshore structures. Before starting the design of any structure, prediction of environmental loads accurately is impor- tant. Various environmental loads acting on the offshore platform is listed below. • Gravity Loads – Structural Dead Loads – Facility Dead Loads – Fluid Loads – Live Loads – Drilling Loads • EnvironmentalLoads – Wind Loads – Wave Loads – Current Loads 31
  • 32. 3.3. Gravity Loads Chapter 3. LOADS – Buoyancy Loads – Ice Loads – Mud Loads • Seismic Loads 3.3 Gravity Loads 3.3.1 Dead Loads Dead loads includes the all the fixed items in the platform deck, jacket, bridge and flare structures. It includes all primary steel structural members, secondary structural items such as boat landing, padeyes, stiffeners, handrails, deck plating, small access platforms etc. The primary structural steel members will be calculated based on the structural information in the model automatically when a computer program is used to analyse the structure. But the weight of secondary structural steel items shall be calculated applied to the structural model at appropriate locations. 3.3.2 Facility Dead Loads The structure built either for drilling or wellhead type platform or for process type platform supports various equipment and facilities. These are fixed type items and not structural components. they do not have any stiffness to offer in the global integrity of the structure and shall not be modelled. The weight of such items shall be calculated and applied at the appropriate locations according the plan of the structure. These items include • Mechanical equipment • Electrical equipment • Piping connecting each equipment • Electrical Cable trays • Instrumentation items 32
  • 33. 3.3. Gravity Loads Chapter 3. LOADS 3.3.3 Fluid Loads The fluid loads are weight of fluid on the platform during operation. This may include all the fluid in the equipment and piping. The weight of these items shall be calculated accurately and applied to the correct locations. 3.3.4 Live Loads Live loads are defined as movable loads and will be temporary in nature. Live loads will only be applied on areas designated for the purpose of storage either temporary or long term. Further, the areas designed for laydown during boat transfer of materials from boat shall also be considered as live loads. Other live load include open areas such as walkways, access platforms, galley areas in the living quarters, helicopter loads in the helipad, etc. These loads shall be applied in accordance with the requirement from the operator of the platform. This load vary in nature from owner to owner but a general guideline on the magnitude of the loads is given below. Sl. No Location Load (kN/m2 ) 1 Storage / laydown 10 2 Walkway 5 3 Access Platform 5 4 Galley 10 Table 3.1: Live Loads 3.3.5 Drilling Loads Drilling loads are due to drill rigs placed on top of the platform for drilling purposes. These are large equipment assembled together and placed on top. Normally, drilling rigs are as heavy as 500 Tonnes to 1000 Tonnes. These will deliver reaction forces on the deck and the stiffness of the drilling rigs are not considered in the structural analysis. Hence the weight of the structure shall be applied as load on the structure. Further, during drilling, additional loads will be developed due to drill string and pulling operations. these loads also shall be considered in the analysis. 33
  • 34. 3.4. Environmental Loads Chapter 3. LOADS 3.4 Environmental Loads 3.4.1 Wind Loads The wind speed at 10m above LAT (Lowest Astronomical Tide) is normally provided (Vo). This wind speed shall be extrapolated to the height above for the calculation of wind speed. The extrapolation shall be calculated as below. V = Vo y 10 1 8 (3.1) where y is the elevation of point in consideration in m above LAT and V is the velocity at that point. Wind loads shall be calculated as per API RP2A guidelines. Sustained wind speeds(10min mean) shall be used to compute global platform wind loads and gust wind (3 second) shall be used to compute the wind loads to design individual members. The wind pressure can be calculated as fw = ρg 2 V 2 (3.2) where F is the wind pressure per unit area, ρ (0.01255 kN/m3 ) is the density of air, g is the gravitational acceleration (9.81 m/sec2 ) and V is the wind speed in m/sec. the above equation can be simplified by substituting the values and can be expressed as fw = 0.6V 2 kN/m2 (3.3) The total wind load on the platform can be calculated using the wind blockage area and the pressure calculated as above. The shape coefficient (Cs) shall be selected as per AP RP2A guidelines. But for the calculation of global wind load (for jacket and deck global analysis) shape coefficient can be 1.0. The total force on the platform can be calculated as Fx = fwAxCs (3.4) Fy = fwAyCs (3.5) 34
  • 35. 3.4. Environmental Loads Chapter 3. LOADS Y X θ Fθ Ay Ay A1 A2 Fy Fx The exposed areas (Ax and Ay) shall be calculated as length x height or width x height depending on the axis system followed. Wind load on oblique directions can be calculated using following relationship. Fθ = Fxcos(θ) + Fysin(θ) (3.6) In practical design, it is often only Fx and FY will be calculated and applied in the structural analysis as basic loads and the wind load effect due to non-orthogonal directions are simulated using factors in terms of Fx and Fy in the load combinations. The factors can be calculated as The projected areas can be calculated as A1 = Ax cos(θ) and A2 = Ay sin(θ) Fθ = fw (A1 + A2)) (3.7) Fθ = fw (Axcos(θ) + Aysin(θ)) (3.8) Fθx = fw (Axcos(θ) + Aysin(θ)) cos(θ) (3.9) Fθy = fw (Axcos(θ) + Aysin(θ)) sin(θ) (3.10) 35
  • 36. 3.4. Environmental Loads Chapter 3. LOADS where Fθx and Fθy are the components of Fθ in x and y directions respectively. Ratio between Fθx and Fx can be expressed as Fθx Fx = fw (Axcos(θ) + Aysin(θ)) cos(θ) fwAx (3.11) Fθx Fx = cos2 (θ) + (Ay/Ax)sin(θ)cos(θ) (3.12) Similarly, ratio between Fθy and Fy can be expressed as Fθy Fy = fw (Axcos(θ) + Aysin(θ)) sin(θ) fwAy (3.13) Fθy Fy = sin2 (θ) + (Ax/Ay)sin(θ)cos(θ) (3.14) 3.4.2 Wave and Current Loads Methodology In applying design waves load onto the offshore structures, there are two ways of applying it. • Design Wave method • Spectral Method In design wave method, a discrete set of design waves (maximum) and associated periods will be selected to generate loads on the structure. These loads will be used to compute the response of the structure. In the spectral method, a energy spectrum of the sea-state for the location will be taken and a transfer function for the response will be generated. These transfer function will be used to compute the stresses in the structural members. 36
  • 37. 3.4. Environmental Loads Chapter 3. LOADS Design Wave method The forces exerted by waves are most dominant in governing the jacket structures design especially the foundation piles. The wave loads exerted on the jacket is applied laterally on all members and it generates overturning moment on the structure. Period of wind generated waves in the open sea can be in the order of 2 to 20 seconds. Theses waves are called gravity waves and contain most part of wave energy. Maximum wave shall be used for the design of offshore structures. The relationship between the significant wave height(Hs) and the maximum wave height (Hmax) is Hmax = 1.86Hs (3.15) The above equation correspond to a computation based on 1000 waves in a record. The design wave height for various regions is tabulated below. Region 1 year 100 year Bay of Bengal 8 18 Gulf of Mexico 12 24 South China Sea 11 24 Arabian Sea 8 18 Gulf of Thailand 6 12 Persian Gulf 5 12 North Sea 14 22 Table 3.2: Maximum design waves in various regions API RP2A requires both 1 year and 100 year recurrence wave shall be used for the design of jacket and piles. Appropriate combination of loads with these waves shall be used in the design. A one-third increase in permissible stress is allowed for 100 year storm conditions. Spectral Method Instead of simulating the design wave environment by discrete maximum wave, a design sea- state described by energy spectrum of for the given site will be used in the load simulation. A directional spectrum can also be used to simulate the changes design wave sea-state. 37
  • 38. 3.4. Environmental Loads Chapter 3. LOADS Surface Seabed Wind Driven Current Tidal Current X Y Figure 3.1: Current Profiles Various sea-state energy spectra are available for use, some of which are listed below. • PM Spectra • Jonswap Spectra • ISSC Spectra 3.4.3 Current Profile Oceans currents induce drag loading on offshore structures. These currents together with the action of waves generate dynamic loads. Ocean currents are classified into few types based on their nature viz, tidal current, wind driven current and current generated due to ocean circulation. Wind driven currents are small in nature and it varies linearly with depth where as tidal currents vary nonlinearly with depth. Similarly, the currents generated due to ocean circulation will vary nonlinear with depth and can be as much as 5 m /sec. The current variation with depth is shown in Figures and can be expressed as below. VT = VoT y h 1 7 (3.16) where VT is the tidal current at any height from sea bed, VoT is the tidal current at the surface, y is the distance measure in m from seabed nd h is the water depth. VW = VoW y h (3.17) 38
  • 39. 3.4. Environmental Loads Chapter 3. LOADS where VW is the wind driven current at any height from sea bed, VoW is the wind driven current at the surface, y is the distance measure in m from seabed nd h is the water depth. 3.4.4 Marine Growth Marine growth is an important part in increasing the loads on offshore structures. The growth of marine algae increases the diameter and roughness of members which in turn cause the wave or current loading to increase. Detailed discussion on the member roughness and its relationship with hydrodynamic coefficients can be found in API RP2A. The thickness of marine growth generally decrease with depth from the mean sea level and it is maximum in the splash zone. The thickness of marine growth in the splash zone can be as much as 20cm and will reduce below to 5cm. In deeper zones, the thickness may be negligible. Splash Zone is a region where the water levels fluctuate between low to high. The actual elevation of the bottom and top of these vary from location to location due to different tidal conditions. In general terms, the splash zone will vary from -3m to +5m. In structural analysis, the increased diameter of the member (D = d + tm) shall be included so that the wave and current loads can be calculated correctly. D and d are the diameter of increased member and original member respectively and tm is the thickness of marine growth. The roughness of the marine growth is an important parameter in determining the drag and inertia coefficients. reference shall be made relevant API RP2A clauses for more details. 3.4.5 Morison Equation Wave and current loading can be calculated by Morison equation. Morison equation can be written as : FT = 1 2 CD ρw D V |V | + πD2 4 CM ρw a (3.18) where FT is the total force, ρw is the density of water, CD and CM are the drag and inertia coefficients respectively, D is the diameter of the member including marine growth, V is the velocity and a is the acceleration. 39
  • 40. 3.4. Environmental Loads Chapter 3. LOADS The first term in the equation is drag component (FD)and the second term is the inertia component (FI). This can be expressed as FT = FD + FI (3.19) Most of the time, current exist in the same direction of the wave propagation and hence the current shall be taken into consideration in the load calculation. However, algebraic sum of wave and current loads is different from calculation of load by adding the horizontal water particle velocity with the current velocity and computing the loads. This is because of nonlinear term in the drag equation. Current velocity shall be added vectorially with the water particle velocity before computa- tion of drag force, i.e. V = Vw + Vc where V is the total velocity, Vw is the Velocity due to waves and Vc is the velocity of current. This is required since there is a square term in the drag force equation. 3.4.6 Wave-Current Interaction The wave current interaction is an important phenomenon since the waves propagate on the current. Both current modifies the wave and wave modifies the current exist. But the former takes most priority in the calculations of wave loads. This interaction modifies the wave parameters and modifies the wave field. Depending on the direction of current in respect of wave direction, it either stretches the wave longer or shortens it. If the current travels in the same direction as the wave, then the wave period becomes longer and it is called apparent wave period (Tapp). Recommendation of API RP2A shall be used to estimate the apparent wave period. Following simultaneous equations shall be solved to obtain the apparent wave period. L T = L Tapp + VI (3.20) Tapp = 2πL g tanh kh (3.21) VI = 4π/L sinh kh 0 −h Uc(z) cosh 2k(z + h)dz (3.22) Refer to API clause 2.3.1.b (1) for more details on how to compute this apparent wave period. 40
  • 41. 3.4. Environmental Loads Chapter 3. LOADS 3.4.7 Selection of Wave Theory The computation of wave kinematics such as velocity and acceleration involves the equations from wave theory. There are various kinds of solutions available depending on the accuracy required, and parameters involved in the computation. The various wave theories are listed below. • Linear / Airy Wave Theory • Stokes Wave Theory (up to 5th order approximations) • Stream Function Wave Theory (up to 22nd order approximations) • Cnoidal Wave Theory Depending on the location such as deep water or shallow water and associated wave param- eters, a suitable wave theory shall be selected for use. API RP 2A recommends to use a chart for such selection based on d/gT2 and H/gT2 as the X and Y axis. Refer to Figure. The wave theories discussed above are for non-breaking waves. For H/h > 0.78, these theories are not applicable as the waves tend to break. In such situation, empirical equations shall be used to calculate the breaking wave forces on the structures. 3.4.8 Wave Load on a Member The various steps involved in calculating loads on a member can be shown graphically. Morison equation is a general form and can not be applied to all members in the offshore structure. It was developed specifically for a surface piercing cylinder like pile of a structure. But in reality, the members of the offshore structure may be horizontal or inclined in space and can not used without modification. Water Wave Kinematics Airy wave theory is considered in the calculation of wave kinematics. Consider a progressive wave with water surface elevation depicted by cosine curve, ζ = H 2 cos(kx − ωt) (3.23) 41
  • 42. 3.4. Environmental Loads Chapter 3. LOADS Figure 3.2: Selection of wave theory for load calculation 9ref : API RP 2A) and the corresponding velocity potential is given by φ = − H 2 ω k cosh k(h + z) sinh kh sin(kx − ωt) (3.24) The horizontal and vertical velocity and acceleration of water particle can be calculated using the following equations. Vh = − ∂φ ∂x = H 2 ω cosh k(h + z) sinh kh cos(kx − ωt) (3.25) 42
  • 43. 3.4. Environmental Loads Chapter 3. LOADS Figure 3.3: Procedure for Calculation Wave Plus Current Loads (Extract from API RP 2A) Vv = − ∂φ ∂z = H 2 ω sinh k(h + z) sinh kh sin(kx − ωt) (3.26) ah = ∂Vh ∂t = H 2 ω2 cosh k(h + z) sinh kh sin(kx − ωt) (3.27) av = ∂Vv ∂t = − H 2 ω2 sinh k(h + z) sinh kh cos(kx − ωt) (3.28) where k is the wave number defined by 2π/L, ω is the wave circular frequency defined by 2π/T, L is the wave length, and x is the distance of the point in consideration from origin. Maximum Load on a vertical member Consider a case of a surface piercing cylinder such as pile of a structure or a leg of a jacket, the combined drag and inertia force (total force) varies with time and will be maximum only at one occasion. In order find the maximum force, phase angle at which the maximum force occurs shall be found first. Let us express the total force on the pile by substituting the velocity and acceleration com- ponents and integrating between the limits (from surface to seabed, i.e., 0 to -h), 43
  • 44. 3.4. Environmental Loads Chapter 3. LOADS Mean Sea Level (M.S.L) Highest Astronomical Tide (HAT) Lowest Astronomical Tide (LAT) h x y Direction of Wave Propagation Figure 3.4: Wave Loads on Jacket Structure FT = 1 2 CD ρ D π2 H2 T2 cos θ| cos θ| sinh2 kh sinh(2kh) 4k + h 2 −CM ρ πD2 4 2π2 H T2 sin θ k (3.29) The total force will be maximum when, ∂FT ∂θ = 0 (3.30) 44
  • 45. 3.4. Environmental Loads Chapter 3. LOADS Substituting the values of velocity and acceleration components in to the drag and inertia force equation and differentiating with respect to θ and rearranging the terms, we get θmax = cos−1 − πD H CM CD 2 sinh2 kh (sinh 2kh + 2kh) (3.31) Maximum Load on a horizontal member Consider a case of a horizontal cylinder such as brace of a jacket, the combined drag and inertia force (total force) varies with time and will be maximum only at one occasion. In order find the maximum force, phase angle at which the maximum force occurs shall be found first. Let us express the total force on the pile by substituting the velocity and acceleration, FT = 1 2 CD ρ D H2 ω2 4 cos θ| cos θ| cosh2 k(z + h) sinh kh −CM ρ πD2 4 Hω2 2 sin θ cosh2 k(z + h) sinh kh (3.32) The total force will be maximum when, ∂FT ∂θ = 0 (3.33) Substituting the values of velocity and acceleration components in to the drag and inertia force equation and differentiating with respect to θ and rearranging the terms, we get θmax = sin−1 − πD 2H CM CD sinh kh cosh k(h + z) (3.34) Maximum Load on a inclined member The resultant force on a arbitrarily oriented circular cylinder in water waves can be calculated using vector analysis combined with Morison equation. 45
  • 46. 3.4. Environmental Loads Chapter 3. LOADS The resultant force on a cylinder in general has component normal to the cylinder axis Fn and a component along the axis of the cylinder (a tangential component) Ft. Thus, the total force per unit length of the cylinder can be written as F = Fn + Ft (3.35) Each of these components can be expressed as functions of the fluid particle motions by using Morison’s equation. The force in normal direction can be expressed as Fn = Fn D + Fn I (3.36) where Fn D and Fn I are the drag and inertia forces respectively. These forces can be expressed as Fn D = 1 2 Cn DDρVn|Vn| (3.37) Fn I = 1 4 πCn M ID2 ρan (3.38) where Cn D = Drag coefficient for flow normal to the cylinder Cn M = Inertia coefficient for flow normal to the cylinder D = Diameter of cylinder ρ = Density of seawater Vn = Velocity of fluid particle normal to the cylinder axis an = Acceleration of fluid particle normal to the cylinder axis In the tangential direction, only a skin friction drag term exists since inertial component along the member axis does not exist unless a axial inertia coefficient is specified. Hence the equation for tangential force can be written as Ft = Ft D (3.39) Ft D = 1 2 Ct DDρVt|Vt| (3.40) where 46
  • 47. 3.4. Environmental Loads Chapter 3. LOADS Cn D = Drag coefficient for flow tangential to the cylinder Vt = Velocity of fluid particle tangential to the cylinder axis These forces can be summed and expressed in terms of cylinder local axis as below. Fx = 1 2 Ct DDρVt|Vt| (3.41) Fy = 1 2 Cn DDρVn|Vy| + 1 4 πCn M ID2 ρay (3.42) Fz = 1 2 Cn DDρVn|Vz| + 1 4 πCn M ID2 ρaz (3.43) The maximum forces can only be found numerically by calculating the forces for one wave cycle. 3.4.9 Maximum Global Loads Maximum global loads on a platform can be calculated using two principles. • Maximum Base Shear Method • Maximum Overturning Moment Method It is important that the wave loads on the structure be checked for both conditions. The maximum overturning moment method will give more pile loads than the other. Similarly, the maximum base shear method may govern the design of some jacket leg members near seabed due to high shear. Maximum Base Shear Maximum base shear or maximum total force on a structure has to be determined for the global analysis of structures. As the wave propagates across structure wave force on each member is different and all the locations will not be attaining the maximum forces. To find the maximum total force a structure, following steps need to be considered. • Position the wave crest at the origin of the structure as shown in Figure. 47
  • 48. 3.4. Environmental Loads Chapter 3. LOADS • Divide one wave cycle into number of segments either in terms of θ or in terms of length. • Compute the wave forces on all members at that instant of time using water wave velocities and accelerations computed. • Sum up the forces in horizontal direction for all the members. • Repeat the calculation in step 4 for all the points for one wave cycle. • The maximum of all the total forces computed in step 5 is the maximum base shear or total force. Maximum Overturning moment Maximum overturning moment on a structure can be determined following the procedure for the maximum base shear case. In this case, the loads on the members shall be multiplied by the lever arm from mud-line. This shall be summed up and the procedure shall be repeated for all the steps in the wave. 3.4.10 Buoyancy Loads The offshore structural members mostly made buoyant by air tight sealing of the welds to avoid water entry. This is purposely planned so that the overall structure will have adequate buoyancy during installation. Typical example is the jacket structure. This kind of structure requires at least a reserve buoyancy of 10% to 15%. The reserve buoyancy is defined as buoyancy in excess of its weight. To obtain this buoyancy, structural tubular members are carefully selected such that their buoyancy / weight ratio is greater than 1.0. This means that the member will float in water. On other hand, if the member is part of a structure supported at its two ends and forced to be submerged by weight of other members, this member will experience a upward force equal to the displaced volume of water. This is called buoyancy force. The buoyancy force can be calculated by two methods. • Marine Method • Rational Method The marine method assumes that the member in consideration considered to have rigid body motion. This means that the weight of the member is calculated using submerged density 48
  • 49. 3.4. Environmental Loads Chapter 3. LOADS Water Surface Buoyancy by Rational Method Selfweight including buoyancy (Marine Method) Self Weight alone Figure 3.5: Buoyancy Calculation methods of steel and applied to the member vertically down as an uniformly distributed load. This buoyant weight WB of the member per unit length can be calculated as WB = 1 4 π(D2 − (D − t)2 )(ρs − 1.025) (3.44) where ρs is the density of steel Unlike gravity which is a true body force acting on every particle of a body, buoyancy is the resultant of fluid pressure acting on the surface of the body. These pressures can only act normal to the surface. The rational method takes in to account this pressure distribution on the structure, results in a system of loads consisting of distributed loads along the members and concentrated loads at the joints. The loads on the members are perpendicular to the member axis and in the vertical plane containing the member. The magnitude of this distributed member load can be expressed as BB = 1 4 πD2 ρw cos α (3.45) where α is the angle between the member and its projection on a horizontal plane The joint loads consists of forces acting in the directions of all of the members meeting at the joint. These joint forces act in a direction that would compress the corresponding members 49
  • 50. 3.4. Environmental Loads Chapter 3. LOADS if they acted directly on them, and have magnitude of : PB = ρwAh (3.46) where A = ”displaced” area i.e. the material area for flooded members, the enclosed area for non-flooded members h = water depth at the end of the member being considered 3.4.11 Ice Loads For structures located in polar regions and cold countries, ice loading shall be considered in the design. In this regions, the ice sheets of varying thicknesses can move from one location to other due to tide and under water current. These ices sheets when come closer and hit the offshore structures, large impact force is experienced by the structure. Mean Sea Level (M.S.L) Highest Astronomical Tide (HAT) Lowest Astronomical Tide (LAT) F Figure 3.6: Ice Loading on a structure 50
  • 51. 3.5. Load Estimation and Distribution Chapter 3. LOADS This kind of force cannot be calculated by means of analytical tools. However, based on experimental studies, an empirical equation is available and can be used to estimate the force Fice. Fice = C f A (3.47) where fice = Crushing strength of ice vary between 1.5 MPa to 3.5 MPa Cice = Ice force coefficient vary between 0.3 to 0.7 A = Area struck by ice (Diameter of member x ice sheet thickness) 3.4.12 Mud Loads Platforms located in the vicinity of the river mouth (shallow water platforms) may experience the mud flow loads. The river flow brings sediment transport and nearby mud towards the platform and may slide through the location. Sometimes over a long period of time sediment settlement at the location of the platform may have sloping surface and mud slides can also generate mud loads. These loads can be calculated using Fmud = Cmud τ D (3.48) where Cmud = Force Coefficient vary from 7 to 9 τ = Shear strength of soil 5 KPa to 10 kPa D = Diameter of pile or or member) 3.5 Load Estimation and Distribution The gravity loads on the topside shall be estimated with care, especially at the initial stage of the project. During initial stage, no reliable information may be available. based on past experience weight of various items shall be assumed. Hence the possibility of weight overrun during the project can occur. In order to reduce the risk of such situation and further consequences of re-design, a planned method of estimation and control shall be introduced called ”Weight Control procedure”. 51
  • 52. 3.5. Load Estimation and Distribution Chapter 3. LOADS Mean Sea Level (M.S.L) Highest Astronomical Tide (HAT) Lowest Astronomical Tide (LAT) Stiff and Stable Soil Soft or Unstable soil Mud Slide Figure 3.7: Mud Loading on a structure In the weight control procedure, the weight elements of an topside shall be divided into the following categories. • Primary Structure • Secondary Structure • Mechanical Equipment • Piping & Bulks • Electrical Equipment • Instrumentation In a typical wellhead platform, the distribution or break down of total weight or payload is shown in Table. 52
  • 53. 3.5. Load Estimation and Distribution Chapter 3. LOADS No Category % 1 Primary Structure 20 2 Secondary Structure 15 3 Mechanical Equipment 25 4 Piping & Bulks 25 5 Electrical Equipment 10 6 Instrumentation 5 Total 100 Table 3.3: Typical Break down of total topside loads The weight estimation of various components will start as early as FEED stage. Structural analysis of concepts selected will require reasonable data for loading the structure with and subsequent analysis work. However, the equipment and other information may not be available at so early in the project. Hence weight estimation with suitable ”contingency” shall be used in the design. Further, during the progress of the project, design requirement may change due to fundamental change in process techniques, equipment selection etc. This contingency is used to allow for such unforeseen growth in the topside load. This contingency is normally kept at higher during the initial stage and can be reduced once the information on each item is available. No Category FEED Basic Detail Fabrication Weighing Design Design Stage Stage 1 Primary Structure 25 20 15 10 5 2 Secondary Structure 35 30 25 15 5 3 Mechanical Equipment 45 30 25 15 5 4 Piping & Bulks 35 30 25 15 5 5 Electrical Equipment 40 30 15 10 5 6 Instrumentation 35 30 25 15 5 Table 3.4: Variation of contingency through project duration Further, the variation in weight due to mill tolerances, fabrication tolerance, welding etc shall also be accounted for in the design. This allowances can be normally estimated and included. The total allowance for this shall be at least 5%. There is another allowance normally kept aside during the design is the allowance for future expansion. This is normally decided by owner or developer of the field and identified future expansion. This is called Future expansion allowance. 53
  • 54. 3.6. Load Combinations Chapter 3. LOADS 10 20 30 40 50 FEED BASIC DESIGN DETAIL DESIGN FABRICATION DESIGN / FABRICATION STAGES Upper bound Lower bound Figure 3.8: Variation of Contingency through project duration 3.6 Load Combinations The load combinations used for adequacy checking of any offshore structure can be divided into following four categories. • Normal Operating Case - Maximum gravity loads arising from normal operation of the platform with 1 year return period wave, current and wind. This case is used to check the structure against loads during the normal operation of the platform. • Hydro-test case - This is a case where hydro-testing and commissioning of equipment and piping is carried out offshore. In this case, the equipment and piping will be fully filled with sea water and maximum gravity loads will be developed. It should be noted that not all equipment will be hydro-tested simultaneously. It will be done one by one. This case is used to check the local strength of the deck structure. • Extreme Storm Case - Maximum gravity loads arising from extreme case with 100 year return period storm wave, current and wind. This case is used to check the structure due to loads during 100 year return period storm together with platform gravity loads. – Some platforms are designed to be unmanned and will be operation during the storm with remote control. Typically, a wellhead platform with only very mini- 54
  • 55. 3.6. Load Combinations Chapter 3. LOADS mum personnel onboard will be fully functional except that the personnel will be evacuated during the storm. – Second type of platforms are process platforms with attached living quarters where large number of people staying on board, platform will be shutdown, and the people will be evacuated during a severe storm. • Pull out case - Minimum gravity loads arising from extreme case with 100 year return period storm wave, current and wind. This case is used to check the maximum tension loads on the piles and structural members. • Seismic case - Maximum gravity loads with seismic loads from either strength level earthquake or ductility level earthquake as per actual design requirement. This case is used to check the seismic condition if the platform is located in seismically active region. Depending on type of platform operation such as process, welhead / drilling or living quar- ters, the required load combinations during a normal operation or extreme storm may change. This is illustrated in the Tables. The above table is based on the Working stress method (WSD) and does not include any contingencies. Suitable contingency shall be added to the load combination. 55
  • 56. 3.6. Load Combinations Chapter 3. LOADS Normal Hydro-test Extreme Tension No Load Category Operating case Storm Pullout Seismic case case case case case 1 Gravity Loads Structural Dead Loads 1.00 1.00 1.00 0.90 1.00 Mechanical Equipment 1.00 1.00 1.00 0.90 1.00 Piping & Bulks 1.00 1.00 1.00 0.90 1.00 Electrical Equipment 1.00 1.00 1.00 0.90 1.00 Instrumentation 1.00 1.00 1.00 0.90 1.00 Operating Fluids 1.00 - 1.00 - 1.00 Hydro-test Fluids 1.00 1.00 - - - Live Loads 1.00 0.50 - - 0.50 2 Drilling Loads Drilling Equipment 1.00 1.00 1.00 0.90 1.00 Supplies 1.00 - - - 0.50 Hook Loads 1.00 - - - Rotary Loads - - 1.00 - 3 Environmental Loads Operating Wind 1.00 1.00 - - Extreme Wind - - 1.00 1.00 Operating Wave+current 1.00 1.00 - - - Extreme Wave+Current - 1.00 1.00 - 4 Seismic Loads - - - - 1.00 Table 3.5: Load Combination for an offshore platform design based WSD 56
  • 57. Chapter 4 MATERIALS AND CORROSION 4.1 General Selection of suitable material for the offshore structure is a very important aspect. Materials for offshore applications include the following. • Structural Materials – Structural Steel - Low carbon steel used for ll kinds of structural members in the platforms – Structural concrete - Marine grade concrete used for construction of columns and bases of gravity type platforms – Cement grout - used for grouting annulus between the pile and jacket leg or skirt • Piping Materials – Carbon Steel used for normal process piping – Stainless steel – Steel Alloys such duplex steel, super duplex steel etc for transporting corrosive fluids such crude oil etc – Fibre Reinforced Plastics - used for sea water service such as fire water system • Miscellaneous Materials – Fibre Reinforced Plastics - used for splash zone protection of piles and members, marine growth preventer etc – Fibre Glass - used for grating on offshore platforms – Timber - used for miscellaneous applications such as launch skid, temporary works, mudmat, etc. 57
  • 58. 4.2. Structural Steel Chapter 4. MATERIALS AND CORROSION 4.2 Structural Steel Offshore structures are generally constructed of structural steel. But these structures are mostly either fixed template type structures and deep water complaint structures. Some times the concrete gravity type structure are also constructed. In this chapter, the type of steel materials and its behaviour under water is discussed. 4.2.1 Structural Member Classification Structural members in the offshore structures can be classified into following categories based on the criticality. • Primary Structural Member - Primary Structural members shall include members and components essential to the overall integrity and safety of the primary structure. • Secondary Structural Member - Secondary Structural Steel shall include members and components essential to the local integrity of the structure where failure of these members will not affect the overall integrity and safety of the primary structure. • Special Members - Special members are parts of primary members located in, or at the vicinity of, critical load transmission areas and of stress concentration locations. • Ancillary Members - Ancillary’ members are minor members and attachments, which do not fall in the above categories. Typical examples in each category is given in Table 4.1. Category Deck Jacket Primary Legs, main truss members, Legs, piles, braces plate girders Secondary stringers, floor plates Minor braces, caissons, conductor supports Special Nodes, lifting padeyes Nodes, padeyes Ancillary handrails, platforms, supports walkways, bumpers and guides Table 4.1: Typical member types in Deck and Jacket 4.2.2 Steel Grades The four (4) grades of steel, which may be used to fabricate plate, rolled shapes, built-up girders and beams, and tubulars, are 58
  • 59. 4.2. Structural Steel Chapter 4. MATERIALS AND CORROSION • Mild Steel (MS) • Special Mild Steel (SMS) • High Strength Steel (HS) • Special High Strength Steel (SHS) Mild Steel (MS) a) Mild Steel (MS) plate, shapes, and plate for tubulars, shall conform to ASTM A 36, ”Specification for Structural Steel”. b) Structural grade seamless line pipe may be used for tubular less than 508 mm O.D., for handrails, grating supports, walkways, or as shown on the Fabrication Drawings. Line pipe shall meet the requirements of API Specification 5L Grade B or ASTM A 53 Grade B. c) All mild steel shall have a minimum of 250 MPa yield strength. Special Mild Steel (SMS) Special Mild Steel (SMS) plate shall conform to ASTM A 36, except that this steel shall be manufactured to a fully killed, fine grain practice, grain size six (6) and finer as determined by ASTM E 112. High Strength Steel (HS) a) High Strength Steel (HS) plate shall conform to the requirements of API 2H Grade 50 or ASTM A 633 Grade C. b) High Strength Steel (HS) for rolled shapes shall conform to the requirements of ASTM A 633 Grade D. c) These grades of steel shall be fully killed, fine grain practice, grain size six (6) or finer as determined by ASTM E 112. d) The carbon equivalent index shall be for Grade 50 steels as defined by API Specification 2H. e) High Strength Steel for tubular less than 508 mm O.D. may conform to seamless API Specification 5L. 59
  • 60. 4.2. Structural Steel Chapter 4. MATERIALS AND CORROSION Special High Strength Steel (SHS) • Two (2) special high strength steels may be used in the structure(s): • ”SHS-50” shall conform to the requirements of API 2H Grade 50 or ASTM A 633 Grade C, Normalized High Strength Low Alloy Structural Steel with API 2H supplements S-1, S-4 and S5 applicable to either designation. b) These materials shall be fully killed and normalized, grain size six (6) or finer as determined by ASTM E 112. • The steels shall meet the requirements of ASTM A 578, ”Straight Beam Ultrasonic Examination of Plain and Clad Steel Plates for Special Applications” and ASTM A770. For ultrasonic examination acceptance level II shall be used and the entire plate shall be scanned. Supplementary requirements S1 and S4 shall apply. • The maximum carbon equivalent shall be as defined by API Specification 2H for Grade 50 steels. 4.2.3 Manufacturing Materials shall be produced by a manufacturing process which includes ladle vacuum de- gassing, calcium argon stirring, or other suitable techniques which shall result in removal or shape control of the complex oxy-sulfides. The supplier shall provide a guarantee and sub- stantial proof that the required properties and weldability can be achieved with the proposed process. Melting by the open hearth process shall not be allowed. 4.2.4 Chemical Requirements The maximum allowable sulfur content shall be 0.006 percent. Rare earth metal (REM) additions shall not be permitted. This approval shall be contingent upon a review of the details concerning the type and amount of REM additions, how and at what point in the melting - ladle degassing process are the REM added, the sulfur level and the extent of degassing prior to the REM addition, and the method used for analysis and control. 4.2.5 Carbon Equivalent (CE) CE = C + Mn 6 + Cr + Mo + V 5 + Ni + Cu 15 (4.1) 60
  • 61. 4.3. Corrosion Chapter 4. MATERIALS AND CORROSION 4.2.6 Mechanical Requirements For grade SHS-50, the minimum yield strength shall be 345 MPa and the minimum tensile strength shall be 483 MPa for plates through 100mm in thickness. 4.2.7 Notch Toughness Requirements The Charpy V-notch impact test shall be used for all high strength ASTM materials for notch toughness requirements. The test shall be conducted and acceptance criteria shall be in accordance with API Specification 2H. 4.2.8 Supplementary Requirements Suplementary requirements for structural steel such as S1 through S11 shall be followed as per API 2H. 4.3 Corrosion Corrosion of metals is a electro-chemical process of loss of material from one location. This may get deposited in the same metal in another area. Corrosion in a wet environment attacks the metal by removing the atoms on the metal surface. The metal atoms at the surface lose electrons and become actively charged ions that leave the metal and enter the wet electrolyte. The metal ions join with/to oppositely charged ions from another chemical and form a new, stable compound. 4.3.1 Seawater Corrosion Corrosion in a wet environment attacks the metal by removing the atoms on the metal surface. The metal atoms at the surface lose electrons and become actively charged ions that leave the metal and enter the wet electrolyte. The metal ions join with/to oppositely charged ions from another chemical and form a new, stable compound. Corrosion requires energy. During corrosion the reacting components go from a higher to a lower energy state and release the energy needed for the reaction. In the dry corrosion process of Figure 1 the metal and the oxygen combine to produce the oxide on the surface because the reaction leads to a compound (the oxide) at a lower energy level. 61
  • 62. 4.3. Corrosion Chapter 4. MATERIALS AND CORROSION The oxide layer shields the metal from the oxygen and forms a barrier. The oxide will not react with the oxygen in the air or the metal. The barrier makes it difficult for oxygen in the air to contact the metal and it eventually grows so thick that the movement of electrons and ions across it stop. Provided the oxide layer does not crack, or is not removed, the metal is protected from further corrosion. But if the bare metal is exposed to the oxygen, it will again react to form the oxide. In this case the presence of oxygen benefits the metals protection. Removal of the oxygen removes the metals ability to create its own protective corrosion barrier. Corrosion of steel in marine environmental is basically a electro-chemical reaction. This is caused by flow of electrons from one location to another location results in recombined metal or rust deposited in the receiving location called Cathode. The location from where the metal is being taken away is called Anode. The essential requirement of such metal transfer to occur is closed circuit between the two locations. This is provided by the surrounding seawater which is a best electrolyte. The presence of chloride, accelerates the process of corrosion. This process is schematically showing in Figure 4.1. In the above process the electrons from the corroding anode metal move to the connected cathode where they recombine with the atoms of oxygen and water in the electrolyte to make a new hydroxyl ion (OH-). This new negatively charged ion then reacts to make a stable compound with the positively charged metal ions (F2 +) that originally lost the electrons. In this case, the electrons have a continuous pathway to escape the parent metal and the parent metal, which cannot develop a protective barrier, disassociates or falls apart. Once corrosion starts it continues until the ingredients are all used up. 4.3.2 Factors influencing corrosion The factors influencing or accelerating the sea water corrosion process are listed below. • PH value of sea water- The electrolyte in wet corrosion can be neutral, acidic or alkaline. For corrosion in near neutral solutions (pH 6 8) under oxygenated conditions the predominant cathodic reaction is the oxygen absorption reaction (O2 + 2H2O + 4e- = 4OH-) shown in Figure 1. If instead the bimetallic cell has no oxygen present in the electrolyte the hydrogen evolution reaction (H+ + e- = H followed by H + H = H2 gas) becomes the cathodic process and the anode continues to corrode. This reaction is a much slower reaction (the H+ ion has a very low concentration in solution) than the oxygen absorbing reaction. In acidic solutions (pH 0 - 6) the hydrogen ion concentration is higher and the hydrogen evolution reaction is the predominant one. Corrosion rates become extreme as the pH drops (acid gets stronger). 62
  • 63. 4.3. Corrosion Chapter 4. MATERIALS AND CORROSION Cathode Cathode Anode Electrolyte - Sea Water CorrodingMetal-Fe 2e− 2e− Presence of Oxygen H2O O2 2H2O + O2 + 4e− → 4OH− Fe2+ + OH− → Fe(OH)2 Fe → Fe2+ + 2e− → Rust Figure 4.1: Schematic showing the sea water corrosion process • Salt Content - The presence of chloride in sea water increase the chemical reaction that takes place during the corrosion process. • Temperature of water - The effect of temperature on corrosion rate is very impor- tant. The rate of corrosion increases as the electrochemical reaction gets faster in high temperature. • Velocity of flow - The rate of corrosion is higher in water circulating or flowing through than in the stagnant water. During corrosion, ions build up immediately around the anode and cathode saturating their respective regions. The corrosion rate begins to fall due to the concentration of stagnant ions blocking the creation of more ions in the electrolyte. If the ions are removed or more voltage is provided the corrosion rate again picks up. If you want fast corrosion then agitate the electrolyte and add oxygen. 63
  • 64. 4.3. Corrosion Chapter 4. MATERIALS AND CORROSION • Presence of Oxygen - Presence of oxygen is main cause of corrosion process to start. The corrosion reaction requires oxygen and where oxygen is present the metal is cathodic and where oxygen is depleted the metal is anodic and corrodes. The parts of the metal in contact with the highest oxygen concentration become cathodic and are protected, and the areas where oxygen concentration is low will corrode. Steel posts dug into the ground will rust just below the surface because of this effect. 4.3.3 types of corrosion • General / Uniform Corrosion - this is basically a global corrosion occurring uniform over the exposed surfaces of the metal. Typical example of uniform corrosion is the corrosion of offshore structures in sea water. • Localised Corrosion - Some of the localised corrosion effects are listed with brief description of hot it happens. – Pitting Corrosion - This type of corrosion happen due to presence of some kind of opening in the metal surface such as fatigue cracks. In pitting corrosion the metal at the top of the pit has access to the oxygen in the air and becomes the cathode. At the bottom of the pit oxygen is depleted and the metal becomes the anode. The deeper the pit is the less the oxygen available at the bottom and the corrosion rate increases. – Crevice Corrosion - A crevice is created whenever two objects are brought to- gether. Unless they are perfectly flat a crevice is present and oxygen cannot easily enter the gap but is plentiful outside. Corrosion starts in the crevice because of differential aeration. – Stress Corrosion - Metal under tensile stresses can corrode at higher rates than normally expected. The stressed areas have changed electrical potentials to the neighbouring metal and are also more likely to develop microscopic surface cracks. Both situations promote increased corrosion rates. – Galvanic Corrosion - Galvanic corrosion needs to be watched. Dissimilar metals of different potentials joined together by an electrolyte, like process water or rainwater, will cause the more anodic metal to corrode. Running copper water pipe to a galvanised tank will cause the tank to corrode very quickly. Joining copper to steel is nearly as bad. In the galvanic series listed in Table 1 only join metals that are near each other. Some protection from galvanic corrosion can be achieved if the electrolyte is not present. Without the availability of water molecules the corrosion reaction stops because the electrons cannot find a host to complete the chemical reaction. Where dissimilar metals must be used, for example aluminum fins on the copper coils of a refrigeration chiller condenser, protect them from contact with water. If water 64
  • 65. 4.3. Corrosion Chapter 4. MATERIALS AND CORROSION must be used in contact with dissimilar metals insure it is deionised and oxygen free. Air High Oxygen Low Oxygen Sea Water Anode Cathode Rust Steel FE2+ Steel Air High Oxygen Low Oxygen Sea Water Anode Cathode Rust Steel FE2+ Steel Figure 4.2: Schematic showing the pitting and crevice corrosion A metal can corrode without being in contact with another metal. In this case different areas of the metal take on different electrical potentials. This can occur because of variations in the metal metallurgical properties or because of variations in the surface oxide layer, such as a break, thinning, inclusion like mill scale, contaminant like dirt, etc. In pitting corrosion the metal at the top of the pit has access to the oxygen in the air and becomes the cathode. At the bottom of the pit oxygen is depleted and the metal becomes the anode. The deeper the pit is the less the oxygen available at the bottom and the corrosion rate increases. Figure 2 shows the mechanism of pitting corrosion. 4.3.4 Rates of corrosion Variation of corrosion along the depth of water depends on many parameters discussed in the previous section. However, a general trend is that the corrosion rate decrease as the depth increase. This is due to lack of presence of oxygen and decrease in temperature. However, the salt content increases with the depth. Hence the rates of corrosion is a complex phenomenon changes from location to location. The corrosion rate of 0.1mm to 0.5mm per year in the splash zone and 0.05mm to 2mm below the splash zone has been given in the literature. In case of jacket type structures, generally the corrosion allowance in the splash zone vary from 6mm to 12mm and for other regions below, normally no corrosion allowance is provided since sacrificial anodes are provided to protect the steel. The longer the design life of the structure, the corrosion allowance in the splash shall be higher. But some times, a non- corrosive splash zone protection in the form wrapping using FRP materials are also provided inplace of corrosion allowance. 65
  • 66. 4.4. Corrosion Protection Chapter 4. MATERIALS AND CORROSION Zone 1 : Atmospheric Zone 2 : Splash Zone Zone 3: Tidal Zone 4: Continuosly Zone 5: Sub-soil Submerged 0 0.10 0.20 0.40 0.50 0.60 Corrosion Rate mm/year Figure 4.3: Rate of corrosion along depth 4.4 Corrosion Protection There many ways of protecting the structures against corrosion. The possible methods are listed below. • Select base materials such that they have corrosion resistant property inherently. • Providing protective coating or other means to stop the environment from attacking the steel surface. • Cathodic Protection by means of sacrificial anodes or impressed current system. • Providing corrosion inhibitors to stop the corrosion process • Providing sacrificial corrosion allowance in areas where protection by other method does not work. 4.5 Cathodic Protection Cathodic protection has applications in most of the offshore structures and facilities. 66
  • 67. 4.5. Cathodic Protection Chapter 4. MATERIALS AND CORROSION • Offshore Platforms • Jack-up Rigs • Semi-Submersible Platforms • Jetties and Wharves • Submarine Pipelines • FPSOs 4.5.1 Sacrificial Anode System A schematic showing the sacrificial anode system is shown in Figure 4.4. The metal surfaces to be protected shall be connected to a sacrificial anode. In this method, the protective current that flow from the sacrificial anode prevents the flow of corrosive current flowing from anode to cathode. This way the metal corrosion is stopped. Instead, the sacrificial anode corrodes during the process. Anode Sacrificial Cathode Cathode Anode Protectivecurrent Electrolyte - Sea Water CorrodingMetal-Fe Fe2+ 2e− 2e− Presence of Oxygen H2O O2 2H2O + O2 + 4e− → 4OH− Fe2+ + OH− → Fe(OH)2 Fe → Fe2+ + 2e−Anode Vathode Result → Rust Figure 4.4: Schematic showing the sacrificial anode system 67
  • 68. 4.5. Cathodic Protection Chapter 4. MATERIALS AND CORROSION For a freely corroding mild steel in sea water has a potential difference of -0.50 to -0.60 Volts when compared with Silver/Silver Chloride reference electrode. This negative potential increases further when cathodic protection is applied. This negative volts increases more than -0.80 Volts and this indicates that the cathodic protection system is in working condition. This method is very suitable for offshore fixed type platforms. This method does not require any maintenance and no external resources for operation. A typical fixed offshore platform as shown in Figure 4.6 is provided with many number of anodes distributed from mudline to LAT. It is to be noted that the cathodic protection by means of sacrificial anodes does not work in the splash zone due to intermittent exposure. Hence the anodes need not be provided in the splash zone. The amount of sacrificial anodes required to protect the structure depends on the following parameters and shall be carefully studied. • Seawater Resistivity, Salinity, temperature and flow velocity • Total Surface area to be protected • Type of Anode Material and its composition, size and shape Among the various types of anodes used in the industry, the slender stand-off type anode commonly selected due to its simplicity. Anode Material - Aluminum AlloyAnode Core - Steel Tube L l h d b B Cross Section Figure 4.5: Typical details of slender stand-off sacrificial anode 68
  • 69. 4.5. Cathodic Protection Chapter 4. MATERIALS AND CORROSION LAT HAT Splash Zone Anode Seabed Conductors Piles Soil Figure 4.6: Offshore platform protected with sacrificial anodes 69
  • 70. 4.5. Cathodic Protection Chapter 4. MATERIALS AND CORROSION 70
  • 71. Chapter 5 SIMULATION 5.1 General With the advancement in computer and software technology and availability of computers, the structural analysis of structures has been made easy and fast. There are a number of commercial computer programs available specifically coded to carry out three dimensional structural analysis for offshore structures. Few programs are listed below. • SACS - Structural Analysis Computer System - from Engineering Dynamics Inc. USA • Strucad - Also from Engineering Dynamics INC. USA • SESAM - from Det Norske Veritas, Norway The modern day offshore development project schedules does not permit designers to carry out hand calculations due to faster requirement of design and drawings for fabrication. Usually, the first discipline to produce documents and drawings is structural so that the materials can be ordered to mill for production. Hence the structural designers are under very high pressure from fabricators to produce the structural material take off for order placement. The use of structural analysis programs with fast computers has made possible some of the largest structures to be designed in 6 to 8 months. Following preparatory activities are required before analysis and design can be carried out. • Structure Geometry selection • Geometry Simulation 71
  • 72. 5.2. Structure Geometry selection Chapter 5. SIMULATION • Foundation Simulation • Load Simulation 5.2 Structure Geometry selection Structure geometry shall be selected based on various requirement such as layout, water depth, environmental condition, installation methodology and topside loads etc. Figure 5.1: Computer Model of a Wellhead Jacket and Deck 5.3 Geometry Simulation A geometric model of a structure contains a database of following information. 72
  • 73. 5.3. Geometry Simulation Chapter 5. SIMULATION • Joints or Nodes • Members and Properties • Foundation • Loads Each of the above information can be entered in a planned and systematic way so that the post processing and correlating the design drawings with analysis results becomes easier and faster. 5.3.1 Axis System Any computer model of structure require origin and coordinate system so that the structure information such as nodes and loads can be modeled. Normally, orthogonal coordinate system with X, Y and Z will be used. The origin of such system shall be at the geometric center of the platform in plan at the work point and at Mean Sea Level (M.S.L) in elevation as shown in Figure. X Z Y Joint Member LEG LEG BRC XBR Figure 5.2: Computer Model of a Jacket with Axis system 73
  • 74. 5.3. Geometry Simulation Chapter 5. SIMULATION The axis origin at the center of the jacket helps in modeling and transformation of geometry for further installation analyses. 5.3.2 Joints or Nodes Joints or nodes are defined as three dimensional coordinates of junctions of members in the space frame. Joints are work points (W.P.) of ends of members and the member shall be formed along the centreline of the member. Unique numbering system shall be followed so that identification of location of joint becomes easy. For example following joint numbering can be used. No Item Description Joint Numbering 1 Jacket J1 to J999 2 Deck D1 to D999 3 Flare Boom F1 to F999 4 Bridge B1 to B999 5 Living Quarters Q1 to Q999 Table 5.1: Joint Numbering scheme Some software programs has the ability to generate automatic joint numbering based on initial number given by the user. Each panel or plane framing can be given with unique numbering. This numbering schemes will help a lot during post processing of results and identification of members or joints that require redesign. For example, in the deck joint numbering scheme, we can split the numbering system in to blocks and use them in a systematic way. For cellar deck, D1 to D399, and for main deck D400 to D799 and for upper deck D800 to D999 and so on. This way, we can easily identify which node is lying on which deck etc. This method of modeling can only come by experience and can be improved to produce a more user friendly model. This will definitely help during quick processing of results and compiling the information from various analyses for a jacket such as inplace, fatigue, seismic, loadout, transportation and launching etc. 5.3.3 Members and properties A member in structural model is a an element (usually a beam element in terms of Finite Element Terminology) connected between two nodes or joints. This member represents the presence of a structural member in the analysis. The member can be defined by two joints (one at each end of member) and a member group name (under which the member property such as diameter and wall thickness can be assigned). 74
  • 75. 5.3. Geometry Simulation Chapter 5. SIMULATION Similarly, the member properties can also be given in systematic way. Same member group shall not be given to too many segments or members. No Item Description Member group 1 Jacket Legs Prefix with either L or J Horizontal Braces Prefix with H Elevation braces Prefix with V Launch Truss Prefix with T Boat Landing Prefix with BL 2 Deck Cellar Deck Prefix with C Main Deck Prefix with M Upper Deck Prefix with U Crane Pedestal Prefix with P 3 Flare Boom Prefix with F 4 Bridge Prefix with B 5 Living Quarters Prefix with Q Table 5.2: Member Group scheme the above is list in an indication of how systematic a structural model can be made and it is upto the designer to build it the way he wanted. 5.3.4 Offsets and Eccentricities The members connecting at one common joint can be joined to one single joint if the offset between the work points (W.P.) is less than the API RP2A allowable distance of D/4 where D is the diameter of the chord member at the joint. This is based some studies on tubular joints with eccentricities showed that the additional moment generated by these eccentricities have consequences on the member and joint adequacy. The shear capacities of tubular members are generally high and may not be serious issue is the eccentricity is within D/4. However, this rule shall not be applied to deck truss. The column, brace and plate girder junction shall be modelled with additional joint even if the eccentricities are less than D/4. This is required to model the shear transfer between the brace and plate girder through the web of the girder. If a separate joint is not modelled, the vertical component of the braces forces will directly taken by the column and the shear capacity of the plate girder at the joint may be checked correctly. 75
  • 76. 5.3. Geometry Simulation Chapter 5. SIMULATION Figure 5.3: Computer Model of a vertical elevation of jacket 5.3.5 Wish-bone Connections The conductors are tubes inserted through series of guides in the jacket at various levels and driven in to the seabed for at least 30 to 40m. These tubes are later used to pass through the drill safely without damaging the jacket members. Further, these tubes prevent the drill pipes (normally very small diameter, typically 13 to 16 inch) from failure due to large displacement and vortex induced vibration. These conductors are not structurally connected to jacket members but just touching the conductor guides at different elevations. Total number of such conductors may vary from platform to platform, in some cases, there may as much as 30 to 40 conductors of 30 inch diameters. Wave and current loading on conductors need to be included in the structural analysis and hence they need to to modelled. The conductors and the structural elements at the conductor guide level will be modelled through a ”stiff element” called wish bone with only axial stiffness so that it will transfer 76
  • 77. 5.3. Geometry Simulation Chapter 5. SIMULATION Brace Brace Brace Chord e1 e2 For e1 and e2 less than D/4 For e1 and e2 greater than D/4 Common Joint for all the braces Separate Joint for each brace e1 e2 Figure 5.4: Joint offset or eccentricities in jacket tubular Joint Brace Brace Column Plate Girder e1 e2 Should be modelled even if e1 and e2 are less than D/4 Separate Joint for each brace e1 e2 Increased web thicknessIncreased Flange Thickness Figure 5.5: Joint offset or eccentricities in deck truss Joint the lateral loads from wave and current on conductors. The length of the wish bones will be very small. This is done by creating a joint with almost same coordinate of the structural joint. 77
  • 78. 5.3. Geometry Simulation Chapter 5. SIMULATION Conductor Support Braces Conductor Guide Anulus Gap Wish bone Figure 5.6: Wish bone modelling of conductor / guide interface 5.3.6 Dummy Structure Models Jacket structure has many appurtenances attached to it. The wave and current loading on them shall be taken into account but the stiffness need not considered in the global analysis of jacket. This is to simplify the load path and to understand the behaviour clearly. Further the materials of such appurtenances may not be in line with the main structure, it is obvious to ignore them in the global structural stiffness. Such structures are listed below. • Boat Landing • Barge Bumber • Launch Runner • Mudmat • Anodes • Conductors • Risers • J-tube Similarly, the deck structure has many appurtenances as listed below. • Walkways 78
  • 79. 5.4. Foundation Simulation Chapter 5. SIMULATION • Stairways • Platforms • Equipment Supports • Monorails But these items on the deck does not have wave or current loading but may have wind loading on them. Since the wind loading on deck is normally considered as block area, this may not be the case. But these appurtenances need to be modelled to simulate the vertical COG. This is required in the sea transportation analysis and seismic analysis. Refer to relevant section for more details. The dummy structure can be modelled in two ways. The first method is to model as a structural member and give very high Young modulus so that the stiffness is very low. This method will lead to large displacements and may not be correct. The other method is to remove such members after the loads are calculated and summed to the nearest joint. Some of the software programs have this ability to simulate dummy structure based on this method. 5.4 Foundation Simulation 5.4.1 Pile Modelling In an offshore structure, the piles hold them on to the sea bed. This needs to be simulated in the structural analysis involving their inplace strength and stability. There are type of pile system that can be used in the offshore structures. • Main Pile • Skirt Pile As it can be seen from the figure that the skirt pile is always grouted with the skirt sleeve of the jacket. But in the case of main pile, the annulus between the pile and the jacket leg may be grouted or not grouted depending on the design water depth. Like other structural elements of the jacket structure, pile is also a structural member and shall be modelled according to the diameter, wall thickness and material properties. It is the load transfer mechanism between the jacket leg and pile that requires special care in simulation of actual load transfer. 79
  • 80. 5.4. Foundation Simulation Chapter 5. SIMULATION Jacket Brace Jacket LegPile Wish-Bone Structure Node Pile Node Pile to Deck Connection Pile To Jacket Connection Pile Head Node Figure 5.7: Pile Simulation for an Offshore jacket 80
  • 81. 5.4. Foundation Simulation Chapter 5. SIMULATION For the case of grouted skirt piles and main piles, the model becomes much easier by simply specifying the cross section as a ”Composite Section” containing jacket leg, pile and the annulus filled with cement grout. The equivalent axial area, shear area and bending stiffness can be calculated using the equivalent section concept and used in the analysis. But for the case of main pile, this cannot be done. The pile and jacket are two parallel members physically connected at the top of jacket by means welded connections and else where no welding but spacers are placed inside the jacket leg to provide contact points for load transfer. These spacers are specially located at the horizontal framing such that the lateral loads from the wave and current can be easily transferred to the piles. 5.4.2 Soil Simulation Piles below seabed shall be modelled in the structural analysis to reflect the vertical and lateral behaviour of pile soil system. This is very essential to simulate the jacket and deck deflections and pile stresses. This can be done in three ways. • Equivalent Pile Stub - • P-Y, T-Z and Q-Z Curves - • Linearised Pile Stiffness Matrix - 5.4.3 Pile Group Effect The skirt piles for very large jackets normally arranged in cluster at each corner to resist the forces from gravity and environmental loads. These pile clusters can be arranged in various ways but due to construction limitations usually they will arranged in closed manner as shown in the Figures 5.10 and ??. The distance between the jacket leg and the farthest pile shall be kept to a minimum possible for fabrication to avoid unnecessary bending on jacket legs as well on the pile sleeves. It is a good practice to space the centre to centre of adjacent piles at a distance of 3D where D is the diameter of the pile. This will prove a clear distance between the pile face of 2D.Even with this separation, the effect of load on one pile will affect the behaviour of the adjacent pile. The issues to be looked into are two categories as listed below. • Effect Axial Capacity • Effect on P-Y, T-Z and Q-Z behaviour 81
  • 82. 5.4. Foundation Simulation Chapter 5. SIMULATION Jacket Legs Brace Skirt Sleeve Main Pile Soil Lateral Resistance Figure 5.8: Pile Simulation for an Offshore jacket 82
  • 83. 5.4. Foundation Simulation Chapter 5. SIMULATION Figure 5.9: Pile Group arrangements for 4 legged platform Figure 5.10: Pile Group arrangements for 8 legged platform 83