This paper introduces an object-based image analysis (OBIA) method leveraging structure tensor for identifying complex coastal landforms through multiscale texture extraction, noise reduction, and maximum likelihood classification. The method improves classification accuracy by utilizing a non-negative matrix factorization for dimensionality reduction and generating texton histograms to compare object characteristics effectively. The effectiveness of this approach is demonstrated through classification of various coastal land types using high-resolution satellite imagery from Hainan Island.
![Natarajan Meghanathan et al. (Eds) : ACITY, VLSI, AIAA, CNDC - 2016
pp. 69–80, 2016. © CS & IT-CSCP 2016 DOI : 10.5121/csit.2016.60907
OBIA ON COASTAL LANDFORM BASED
ON STRUCTURE TENSOR
Sun Shuting, Liu Jianqiang and Zou Bin
Key laboratory of Space Ocean Remote Sensing and Application,
SOA, Beijing, China
National Satellite Ocean Application Service, Beijing, China
sst19910323@gmail.com
jqliu@mail.nsoas.org.cn
zoubin@mail.nsoas.org.cn
ABSTRACT
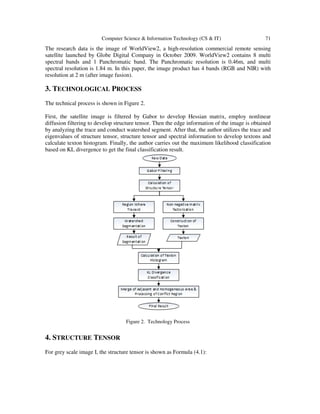
This paper presents the OBIA method based on structure tensor to identify complex coastal
landforms. That is, develop Hessian matrix by Gabor filtering and calculate multiscale structure
tensor. Extract edge information of image from the trace of structure tensor and conduct
watershed segment of the image. Then, develop texons and create texton histogram. Finally,
obtain the final results by means of maximum likelihood classification with KL divergence as
the similarity measurement. The study findings show that structure tensor could obtain
multiscale and all-direction information with small data redundancy. Moreover, the method
described in the current paper has high classification accuracy.
KEYWORDS
OBIA, Structure Tensor, Texton & Coastal Zone
1. INTRODUCTION
Remote sensing with its large amount of information, access to information faster, shorter cycle,
less restricted and so on provides a new method for the investigation of the coastal zone. In view
of the characteristics of the coastal zone, the methods of land use classification are proposed. The
original classification method of the coastal zone is based on pixel-based classification, such as
Maximum Likelihood or ISODATA. These methods are suitable for low and medium spatial
resolution remote sensing image; as for high-resolution images, information, such as texture
information single pixel able to contain has its limitation. Thus, object oriented classification is
widely used. That method firstly segment image to object, which is a series of homogeneous
regions adjacent to each other. After that, classify these objects.
In recent years, some scholars have applied the object-oriented classification to the classification
of coastal landform. In the year 2009, Wang Changying[1] has proposed a coastline extraction
methods based on Apriori Algorithm, which can extract 5 different kind of coastline: artificial
coastline, bedrock coastline, sandy coastline, muddy coastline and biological coastline. Using
such method, the extraction accuracy can reach 3 pixels by using Landsat image(30m).](https://image.slidesharecdn.com/csit65607-160805095627/85/OBIA-on-Coastal-Landform-Based-on-Structure-Tensor-1-320.jpg)
![Natarajan Meghanathan et al. (Eds) : ACITY, VLSI, AIAA, CNDC - 2016
pp. 69–80, 2016. © CS & IT-CSCP 2016 DOI : 10.5121/csit.2016.60907
OBIA ON COASTAL LANDFORM BASED
ON STRUCTURE TENSOR
Sun Shuting, Liu Jianqiang and Zou Bin
Key laboratory of Space Ocean Remote Sensing and Application,
SOA, Beijing, China
National Satellite Ocean Application Service, Beijing, China
sst19910323@gmail.com
jqliu@mail.nsoas.org.cn
zoubin@mail.nsoas.org.cn
ABSTRACT
This paper presents the OBIA method based on structure tensor to identify complex coastal
landforms. That is, develop Hessian matrix by Gabor filtering and calculate multiscale structure
tensor. Extract edge information of image from the trace of structure tensor and conduct
watershed segment of the image. Then, develop texons and create texton histogram. Finally,
obtain the final results by means of maximum likelihood classification with KL divergence as
the similarity measurement. The study findings show that structure tensor could obtain
multiscale and all-direction information with small data redundancy. Moreover, the method
described in the current paper has high classification accuracy.
KEYWORDS
OBIA, Structure Tensor, Texton & Coastal Zone
1. INTRODUCTION
Remote sensing with its large amount of information, access to information faster, shorter cycle,
less restricted and so on provides a new method for the investigation of the coastal zone. In view
of the characteristics of the coastal zone, the methods of land use classification are proposed. The
original classification method of the coastal zone is based on pixel-based classification, such as
Maximum Likelihood or ISODATA. These methods are suitable for low and medium spatial
resolution remote sensing image; as for high-resolution images, information, such as texture
information single pixel able to contain has its limitation. Thus, object oriented classification is
widely used. That method firstly segment image to object, which is a series of homogeneous
regions adjacent to each other. After that, classify these objects.
In recent years, some scholars have applied the object-oriented classification to the classification
of coastal landform. In the year 2009, Wang Changying[1] has proposed a coastline extraction
methods based on Apriori Algorithm, which can extract 5 different kind of coastline: artificial
coastline, bedrock coastline, sandy coastline, muddy coastline and biological coastline. Using
such method, the extraction accuracy can reach 3 pixels by using Landsat image(30m).](https://image.slidesharecdn.com/csit65607-160805095627/75/OBIA-on-Coastal-Landform-Based-on-Structure-Tensor-1-2048.jpg)
![70 Computer Science & Information Technology (CS & IT)
Proposed by Bigün[2] in 1987, structure tensor indicates the consistency of the matrix which was
originally used for detection of linear symmetry. In recent years, structure tensor method is
improved from 2 aspects:
In practice, the distance between objects and the viewpoint is different, in addition, objects have
specific spatial scale. Therefore, single scale structure tensor is unable to describe texture
information of different scales. Thus, scientists expand single scale structure tensor to multiscale
structure tensor to enhance the capacity in describing image information, Sensitive to noise,
structure tensor usually requires filtering. The most common filter is the Gaussian filter.
Nonlinear structure tensor was proposed by M Rousson et al [3] in 2003, that is, Gaussian filter is
replaced by nonlinear filter, which could preserve more information and restrain noise at the
same time.
Multiscale structure tensor is able to extract multiscale and all-direction information with small
data redundancy. In the past 30 years, it has been successfully applied in many fields such as
image recovery [4], frequency and ridge estimation [5], texture analysis [6] and image processing
in neural biology field [7]. In this paper, in order to develop multiscale structure tensor, Hessian
matrix is constructed using Gabor wavelet and nonlinear diffusion filter is used to reduce the
noise. Multiscale structure tensor serves as texture information about coastal areas.
It is difficult to directly compare the similarity of 2 objects due to different amount of pixels in
different objects. In this paper, texton histogram is used to describe the information of the
objects.
Texton is the fundamental microstructure of natural image. [8] A plurality of similar texture and
spectral features in the same texture area can compose such microstructure. These measurement
vectors have certain similarity. Typical vectors can be used to represent all similar vectors in the
region and discard the others. Which can reduce amount of computation and to multivariable
decoupling in order to reduce the correlation of vectors. The texton histogram is a typical
application of this theory. In this method, New measurement vectors are obtained by clustering
the old measurement vectors.
2. STUDY AREA AND RESEARCH DATA
The study area is located in the southeast of Hainan Island. As it’s shown in figure 1.
Figure 1. Location of Study Area](https://image.slidesharecdn.com/csit65607-160805095627/85/OBIA-on-Coastal-Landform-Based-on-Structure-Tensor-2-320.jpg)
![72 Computer Science & Information Technology (CS & IT)
T = ݇ ∗ ቤ
ܫ௫
ଶ
ܫ௫ܫ௬
ܫ௫ܫ௬ ܫ௬
ଶ ቤ (4.1)
Where Ix is the partial derivative of the image in x direction and Iy is the partial derivative in y
direction. It is easy to extend Formula (4.1) to higher order as shown in Formula (4.2):
T = ݇ ∗ ቤ
∑(ܫ௫
ଶ
) ∑(ܫ௫ܫ௬)
∑(ܫ௫ܫ௬) ∑(ܫ௬
ଶ
)
ቤ (4.2)
For multi spectral data, the structure tensor is the sum of the tensor product of each band.
Scheunders[9] has proposed the multiscale feature description method based on wavelet and the
wavelet basis function γ satisfies the Formula (4.3):
ቊ
lim௫,௬→∞ ߛ(,ݔ )ݕ = 0
ߛ(,ݔ )ݕ ݀ݕ݀ݔ = 1
(4.3)
Where γ is a kind of two dimensional differentiable function. Therefore, wavelet basis function
can be used as multi scale convolution kernel. The elements in a Hessian matrix are obtained by
convolving the image and calculating the partial derivative.
ቀೣ
ቁ = ܽ௦
൭
ങ(∗γೞ)
ങೣ
ങ(∗γೞ)
ങ
൱ (4.4)
Where a is the wavelet base (constant). γs is the wavelet basis function in scale s. Gabor wavelet
is used as wavelet basis function based on the method of Shoudong Han et al [7].
4.1. Gabor Filters
Gabor filters is to divided signal into many small time intervals. Using Fourier transform to
analyse each time intervals. The specific process is to add a Gaussian function to f(t) as window
function and then doing Fourier transform. As for the two-dimensional data, its window function
is as follows [10]:
݃(,ݔ )ݕ =
ଵ
ଶగఙమ ݁ି
భ
మ
(
ೣశ
)మ
(4.5)
Put it into Gabor transformation function:
ܩ = ݂(ݐ(݃)ݐ − ܾ)݁ିఠ௧∞
ି∞
݀ݐ (4.6)
Obtain Gabor basis function of two-dimensional discrete data:
G(,ݔ )ݕ =
ଵ
ଶగఙమ ݁ି
భ
మ
(
ೣశ
)మ
cos (2ߨ݂(ߠݏܿݔ + ))ߠ݊݅ݏݕ (4.7)
f is the frequency, determined by formula (5.4); θis the angle, make it as 0°, 45°,90°,135°](https://image.slidesharecdn.com/csit65607-160805095627/85/OBIA-on-Coastal-Landform-Based-on-Structure-Tensor-4-320.jpg)
![Computer Science & Information Technology (CS & IT) 73
f =
ଵ
ଶ·ଶ√ଶ
(݊ = 0,1,2) (4.8)
Therefore, the calculation of the multiscale structure tensor is as Formula (4.9):
T = ݇ ∗ ቤ
∑(ܦ௫
ଶ
) ∑(ܦ௫ܦ௬)
∑(ܦ௫ܦ௬) ∑(ܦ௬
ଶ
)
ቤ (4.9)
4.2. Nonlinear Diffusion Filter
PM diffusion is a nonlinear diffusion model proposed by Perona and Malik [11] in 1990. It is a
kind of nonlinear adaptive PDE algorithm. The calculation process contains detection of edge and
direction of the image. In non-edge area, the filter is isotropic of high smooth degree. In edge
area, the filter is anisotropic with low smooth degree. The application of it to images could
reduce noise and maintain or even enhance image characteristics at the same time.
Discrete nonlinear diffusion PM equation is shown in Formula (4.10):
∂T(,ݔ )ݕ = ݀݅∑(݃(ݒ ∑ |∇ܶ(݅, ݆)|ଶଶ
ୀଵ
ଶ
ୀଵ )∇ܶ(,ݔ ))ݕ (4.10)
Where T(x,y) is the structure tensor of pixel in the image with a coordinates of (x, y), g is the
edge detection function shown in Formula (4.11):
݃(|∇)|ݔ =
ଵ
|∇௫|ഄାఋ
(4.11)
Where ε is a positive constant to prevent the denominator as 0; and δ is the harmonic parameter
of diffusion filter. This paper takes δ as 0.7.
5. IMAGE SEGMENTATION
In this paper, watershed segmentation is applied, which is a region-based mathematical
morphology segmentation method. It could obtain single pixel width, connection, enclosure and
accurate outline.
Watershed algorithm can only segment single band image. In case of processing multi-bands
image, certain algorithm should be used to reduce the dimension.
Structure tensor with higher order (4.2) can effectively process multi-band data. In addition, the
Hessian matrix is developed by gradient, which contains the structure information of local
neighbourhood areas without mutual offset of the gradients of rising edge and falling edge.
The trace of structure tensor of any pixel (x,y) of an image is calculated by Formula (5.1):
,ݔ(݁ܿܽݎݐ )ݕ = (݁ܿܽݎݐฬ
ܶ(,ݔ )ݕ ܶ(,ݔ ݕ + ݊)
ܶ(ݔ + ݉, )ݕ ܶ(ݔ + ݉, ݕ + ݊)
ฬ) (5.1)
Where m and n is the length and width respectively of the image. In this paper, the part of trace
>0 is selected as the gradient image.](https://image.slidesharecdn.com/csit65607-160805095627/85/OBIA-on-Coastal-Landform-Based-on-Structure-Tensor-5-320.jpg)
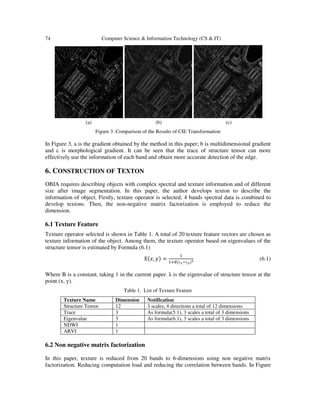
![Computer Science & Information Technology (CS & IT) 75
4, a shows the clustering results by using this method, b shows the result without using nnmf, c
shows the clustering result by only using Spectral information.
(a) (b) (c)
Figure 4. Results of Clustering of the Texton
The comparison of the results of the above three methods shows that texton can effectively
identify most objects and is an effective method. NNMF not only reduces computation load, but
also reduces the correlation between bands. It maintains more information without reducing
classification accuracy after dimensionality reduction.
At a result, a 10 dimensional texton is obtained.
7. CLASSIFICATION OF THE OBJECTS
The author divides the images into the following 7 categories: seawater, land water area, forest
land, farm land, building, bare land and coastal (tidal zone) coastal (intertidal zone). based on
characteristics of the image and Szuster B W’s [12] method.
The vegetation is classified based on density degree in line with Ecker’s standards [13] as well as
the Ethnography of Hainan. Forest in the study area in the south-eastern end of Hainan Island is
the forest land and other terrestrial vegetation is farm land. The coastal type is the muddy coast,
which can be further divided into tidal and intertidal zones.
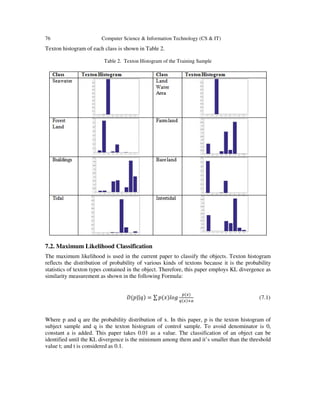
7.1. Texton Histogram of the Training Sample
With the calculation in Chapter 6, the author employs 10 dimension textons to describe the
characteristics of the object. However, the author cannot directly compare two objects due to
different amount of textons (i.e. pixels) in different objects. Therefore, Texton histogram is used
in the current paper to describe the information of object so as to compare the similarity of two
objects with different number of pixels. The process of generating texton histogram is as the
followings:
a) Classify these textons into 9 groups by ISODATA and record the group of each texton.
b) Obtain texton histogram by count the frequency of the group of all textons in an object.
c) Turns different histogram in the same dimension by histogram normalization.](https://image.slidesharecdn.com/csit65607-160805095627/85/OBIA-on-Coastal-Landform-Based-on-Structure-Tensor-7-320.jpg)
![Computer Science & Information Technology (CS & IT) 77
7.3. Processing of Classification Result
Watershed algorithm cannot avoid the over-segmentation, so the phenomenon exists that 2 areas
adjacent to each other are of the same class The border width of Watershed algorithm is fixed as
1. Kang, T. Yung’s [14] Bridge algorithm can eliminate such boundary. Bridge algorithm is
defined as a connection of connected points. In the binary image, for a point whose value is 0, if
there is more than 2 points with value of 1 as it neighbourhood, value of the point is 1. As it’s
shown in Formula (7.2)
1 0 0
1 0 1
0 0 1
ܥℎܽ݊݃݁ ݅݊ݐ
1 0 0
1 1 1
0 0 1
(7.2)
Texton histogram of seawater and land water area is similar, water areas are combined after
extraction, mainly, the largest area is seawater.
8. RESULT OF THE EXPERIMENT AND ASSESSMENT OF THE
ACCURACY
The study area is shown in Figure 6. The image is taken by Worldview2 on June 27th
, 2011,
located at 18°46′39″N,110°29′45″E with the size at 1 000×1 000 pixels.
Figure 5 Original Image of the Study Area](https://image.slidesharecdn.com/csit65607-160805095627/85/OBIA-on-Coastal-Landform-Based-on-Structure-Tensor-9-320.jpg)
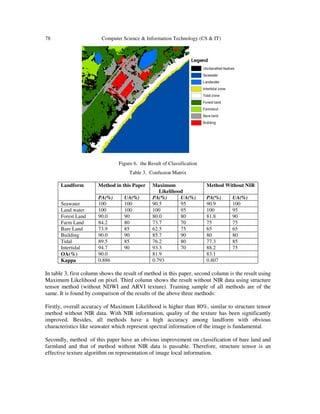
![Computer Science & Information Technology (CS & IT) 79
Thirdly, overall accuracy of the method described in this paper can reaches 90.0%, 8.9% higher
than that of the maximum likelihood method with 0.093 rise of Kappa coefficient. In conclusion,
method of this paper has high classification accuracy.
8. CONCLUSIONS
The findings of the current study demonstrate that structure tensor is an excellent texture operator
because of its capacity in obtaining all-direction and multiscale information with small data
redundancy. The overall accuracy of the OBIA method based on structure tensor adopted in this
paper is above 90% and this method can be effectively applied in classifying coastal landforms.
Meanwhile, the author finds that there is quite big room for improvement of the current method
as structure tensor texture can be further optimized by energy function of wavelet.
FUNDING
Project supported by Welfare Special Industry Fund of Marine Public Welfare, SOA of China
(Grant No. 201505014).
REFERENCES
[1] 王常颖. 基于数据挖掘的遥感影像海岸带地物分类方法研究[D]. 青岛: 中国海洋大学, 2009.
[2] Bigün J, Granlund G H, Wiklund J. Multidimensional orientation estimation with applications to
texture analysis and optical flow[J]. IEEE Transactions on Pattern Analysis & Machine Intelligence,
1991 (8): 775-790.
[3] Rousson M, Brox T, Deriche R. Active unsupervised texture segmentation on a diffusion based
feature space[C]//Computer vision and pattern recognition, 2003. Proceedings. 2003 IEEE computer
society conference on. IEEE, 2003, 2: II-699-704 vol. 2.
[4] Chierchia G, Pustelnik N, Pesquet-Popescu B, et al. A nonlocal structure tensor-based approach for
multicomponent image recovery problems[J]. Image Processing, IEEE Transactions on, 2014, 23(12):
5531-5544.
[5] Mikaelyan A, Bigun J. Frequency and ridge estimation using structure tensor[C]//Biometric
Technologies in Forensic Science (BTFS 2013), Nijmegen, Netherlands, October 14-15, 2013.
Radboud University Nijmegen, 2013: 58-59.
[6] Han S, Wang X. Texture Segmentation Using Graph Cuts in Spectral Decomposition Based
Riemannian Multi-Scale Nonlinear Structure Tensor Space[J]. International Journal of Computer
Theory and Engineering, 2015, 7(4): 259.
[7] Budde M D, Frank J A. Examining brain microstructure using structure tensor analysis of histological
sections[J]. Neuroimage, 2012, 63(1): 1-10.
[8] Tuceryan M, Jain A K. Texture analysis[J]. The handbook of pattern recognition and computer
vision, 1998, 2: 207-248.
[9] Scheunders P. A multivalued image wavelet representation based on multiscale fundamental
forms.[J]. IEEE Transactions on Image Processing, 2002, 11(5):568-575.](https://image.slidesharecdn.com/csit65607-160805095627/85/OBIA-on-Coastal-Landform-Based-on-Structure-Tensor-11-320.jpg)
![80 Computer Science & Information Technology (CS & IT)
[10] Lee T S. Image representation using 2D Gabor wavelets[J]. Pattern Analysis and Machine
Intelligence, IEEE Transactions on, 1996, 18(10): 959-971.
[11] Lindeberg T. Scale-space theory in computer vision[M]. Springer Science & Business Media, 2013.
[12] Szuster B W, Chen Q, Borger M. A comparison of classification techniques to support land cover and
land use analysis in tropical coastal zones[J]. Applied Geography, 2011, 31(2): 525-532.
[13] Eckert S. Improved Forest Biomass and Carbon Estimations Using Texture Measures from
WorldView-2 Satellite Data[J]. Remote Sensing, 2012, 4(4):810-829.
[14] Kong T Y, Rosenfeld A. Digital topology: introduction and survey[J]. Computer Vision, Graphics,
and Image Processing, 1989, 48(3): 357-393.
AUTHORS
Sun Shuting (1991.3~)
Master student of National Satellite Ocean Application Service, China.
Research direction: OBIA and Antarctic Sea Ice.
Liu Jianqiang (1964.9~)
Research Fellow,
Deputy director of National Satellite Ocean Application Service, China.
Research direction: Construction of Ocean Satellite and Ocean Remote Sensing
Zou Bin (1969.2~)
Research Fellow of National Satellite Ocean Application Service, China.
Research direction: Ocean Remote Sensing](https://image.slidesharecdn.com/csit65607-160805095627/85/OBIA-on-Coastal-Landform-Based-on-Structure-Tensor-12-320.jpg)