Downloaded 150 times
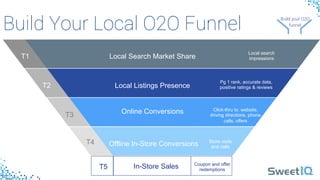
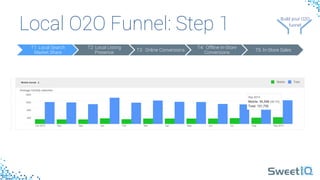
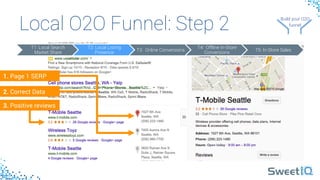
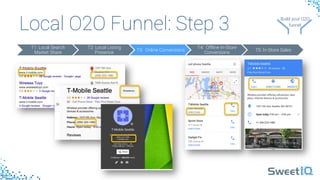

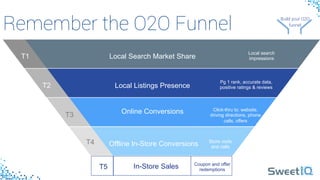
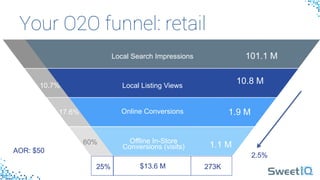
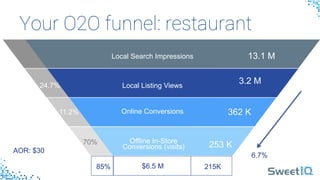
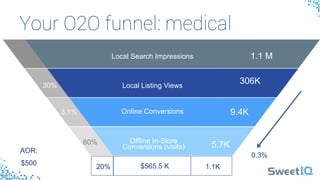


This document discusses how local businesses can build an online to offline (O2O) funnel to drive more in-store sales. It outlines a 5-step O2O funnel that includes: 1) increasing local search market share, 2) optimizing local listings, 3) driving online conversions, 4) increasing offline in-store conversions, and 5) boosting in-store sales. Case studies are provided showing how the O2O funnel can be modeled and ROI calculated for retail, restaurant, and medical businesses. Optimization of the O2O funnel is presented as a way for local businesses to get more shoppers and increase local ROI.


![[Survey] Instant noodle store share in Vietnam](https://cdn.slidesharecdn.com/ss_thumbnails/instantnoodlesurveyinvietnam062417-170624134544-thumbnail.jpg?width=640&height=640&fit=bounds)


