Download to read offline
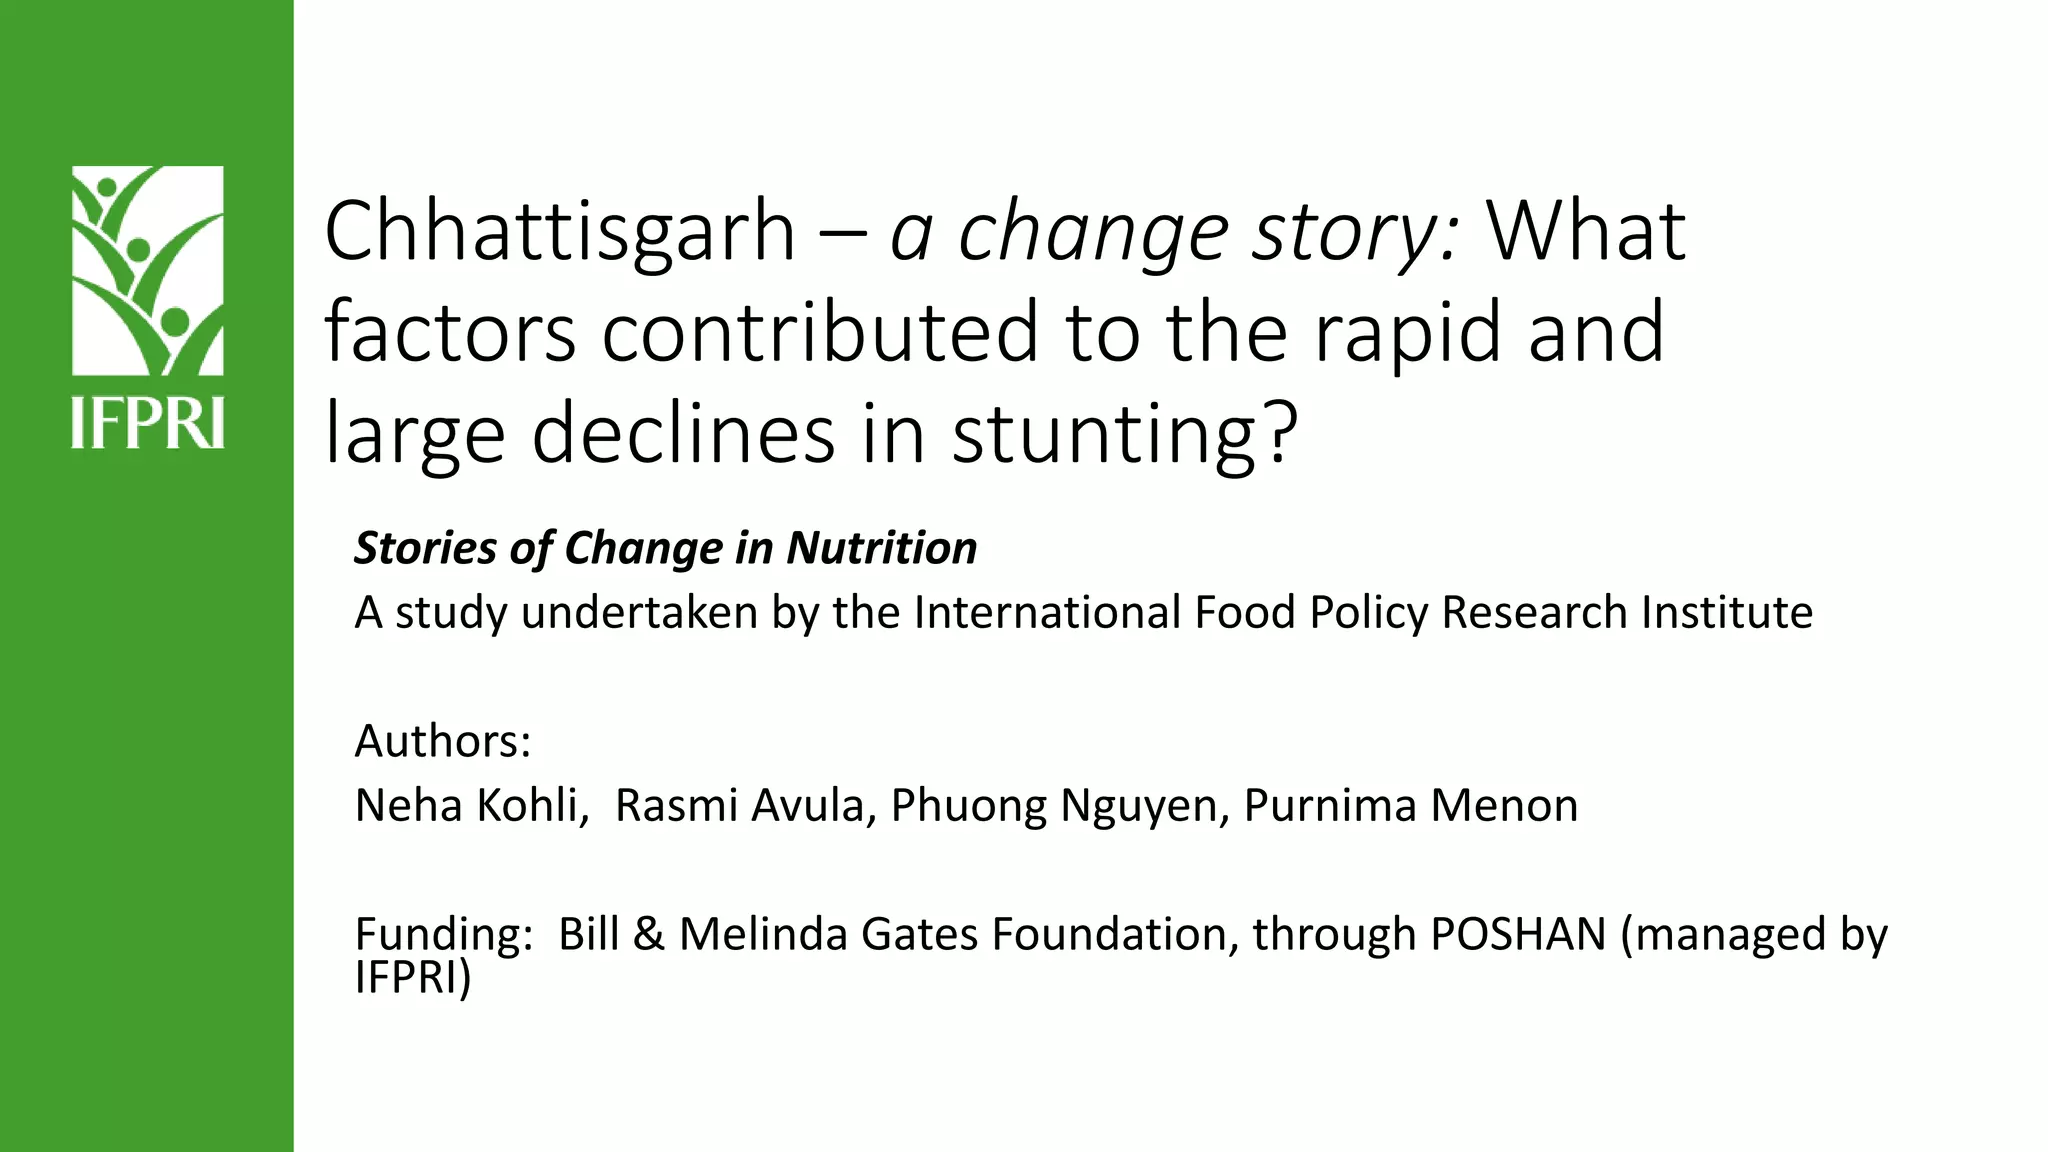

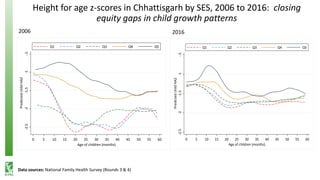
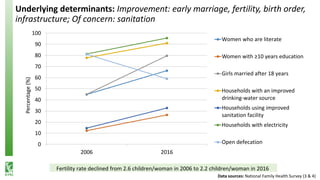
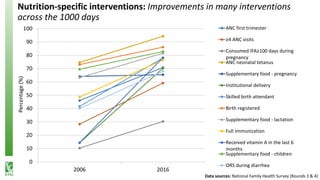

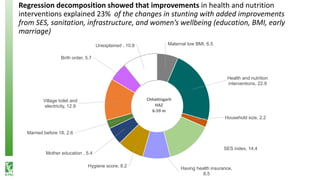


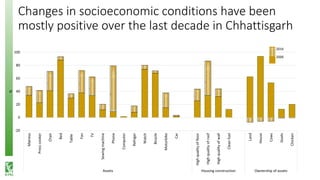


Chhattisgarh experienced a significant decline in stunting rates among children under five, attributed to various factors such as improved health and nutrition interventions, socioeconomic changes, and effective policy implementations over a decade. The state's health reforms, particularly the community-based 'mitanin' program, played a crucial role in these improvements, supported by collaboration between civil society and development partners. Overall, the study highlights the importance of multi-faceted approaches in addressing malnutrition and improving public health outcomes.


