Download to read offline
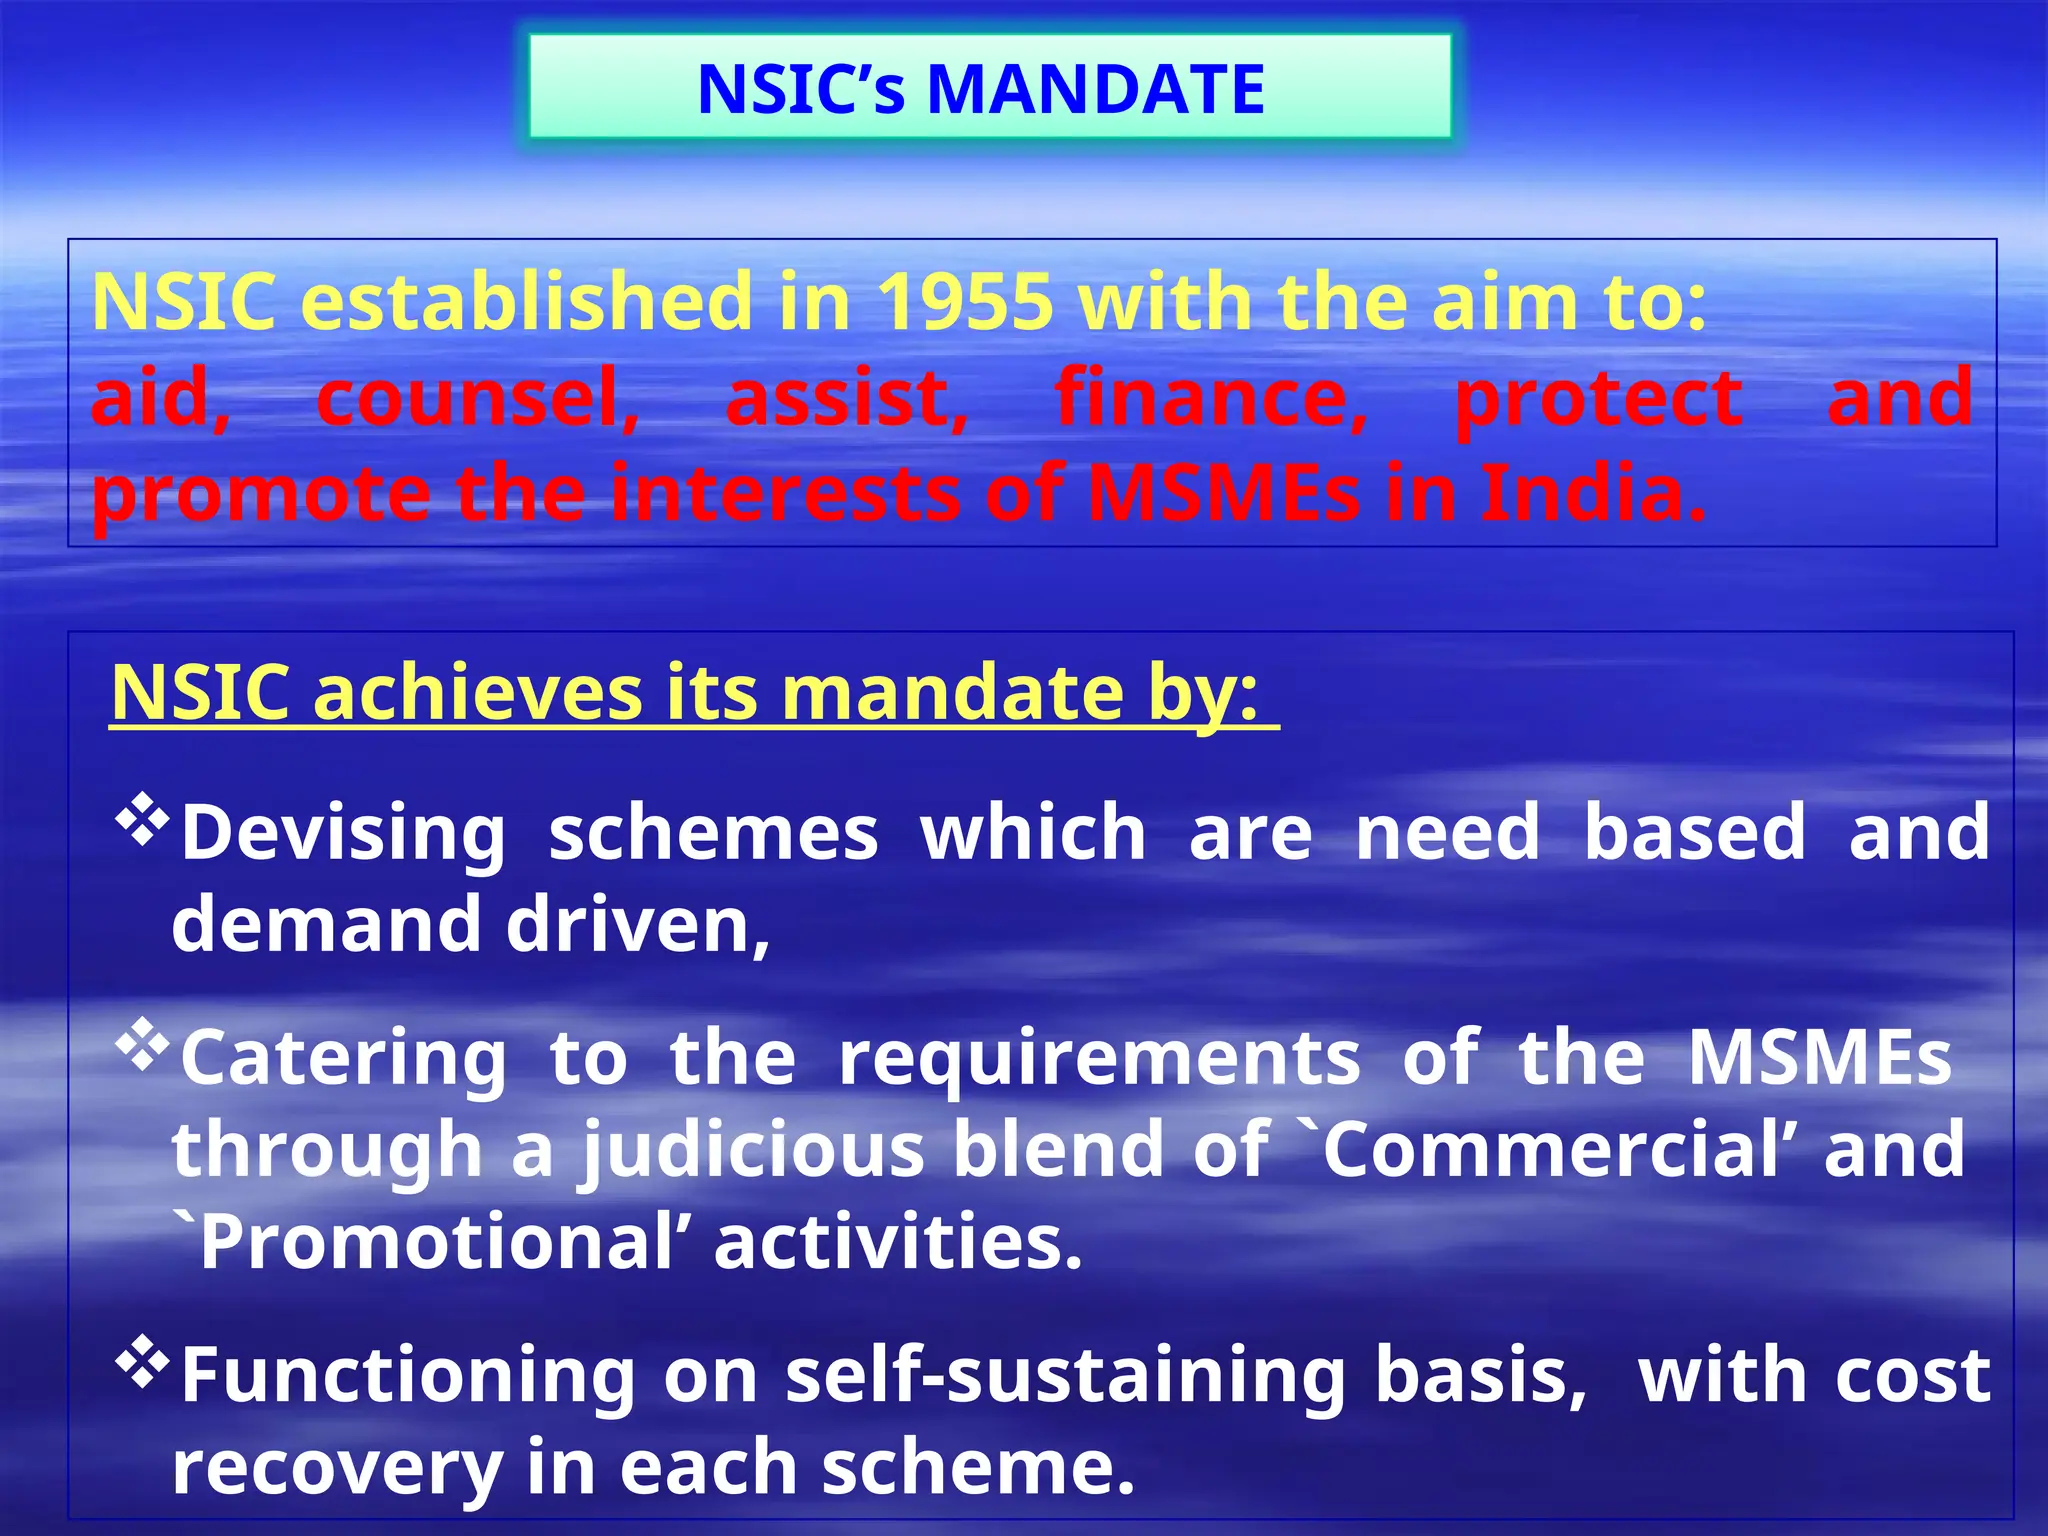
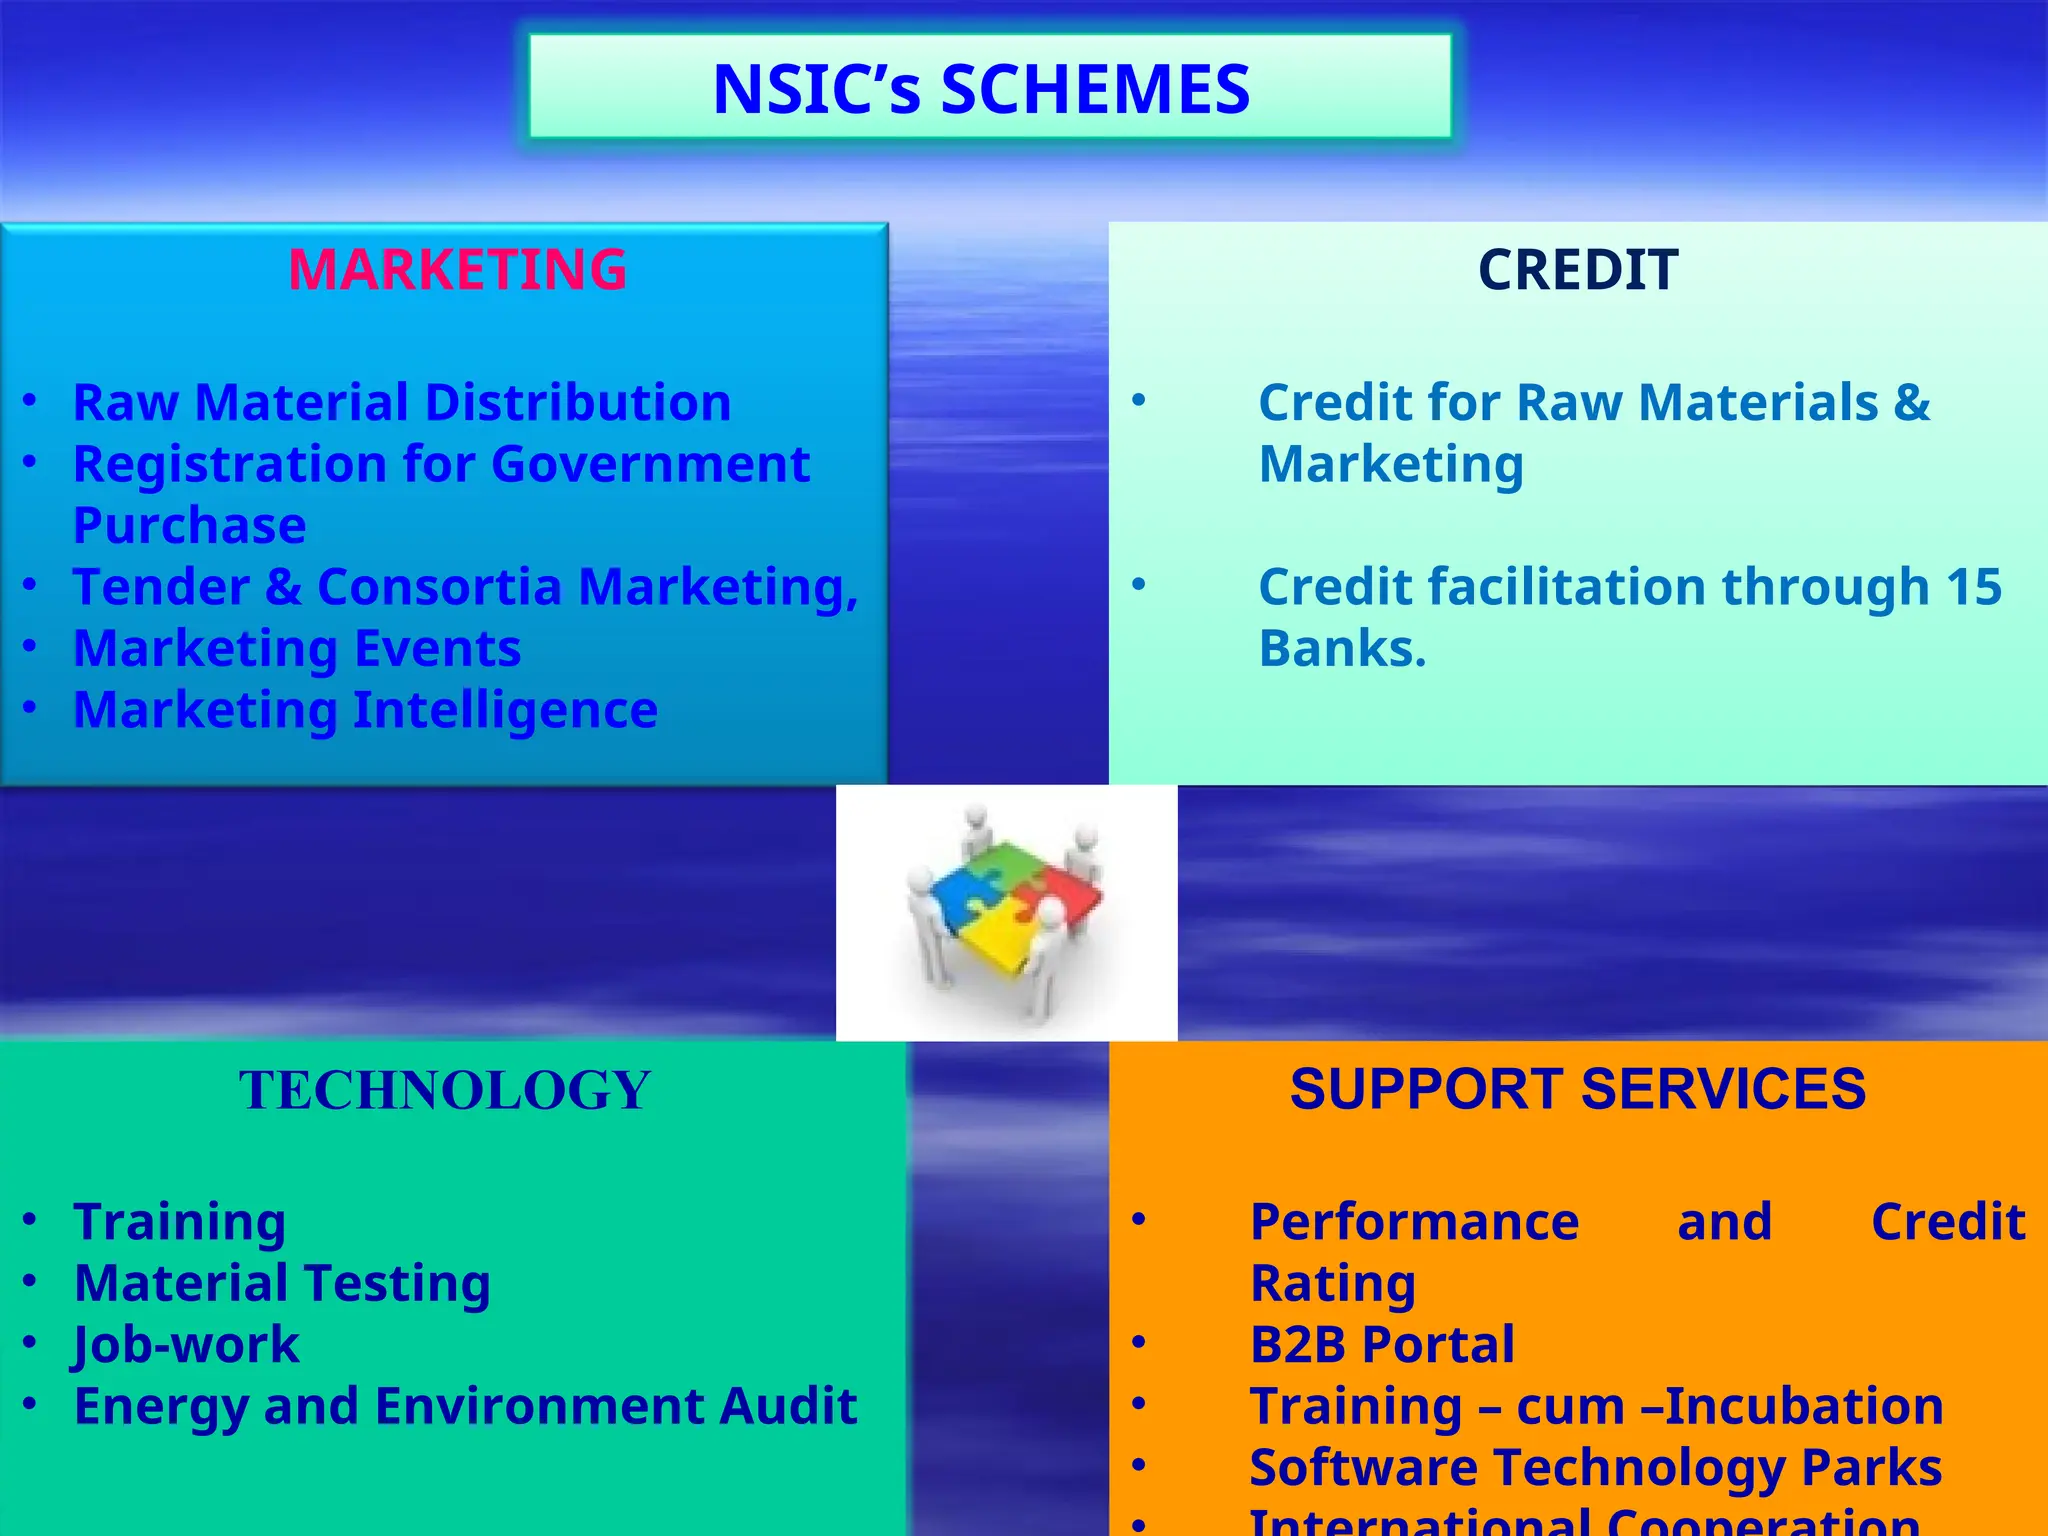
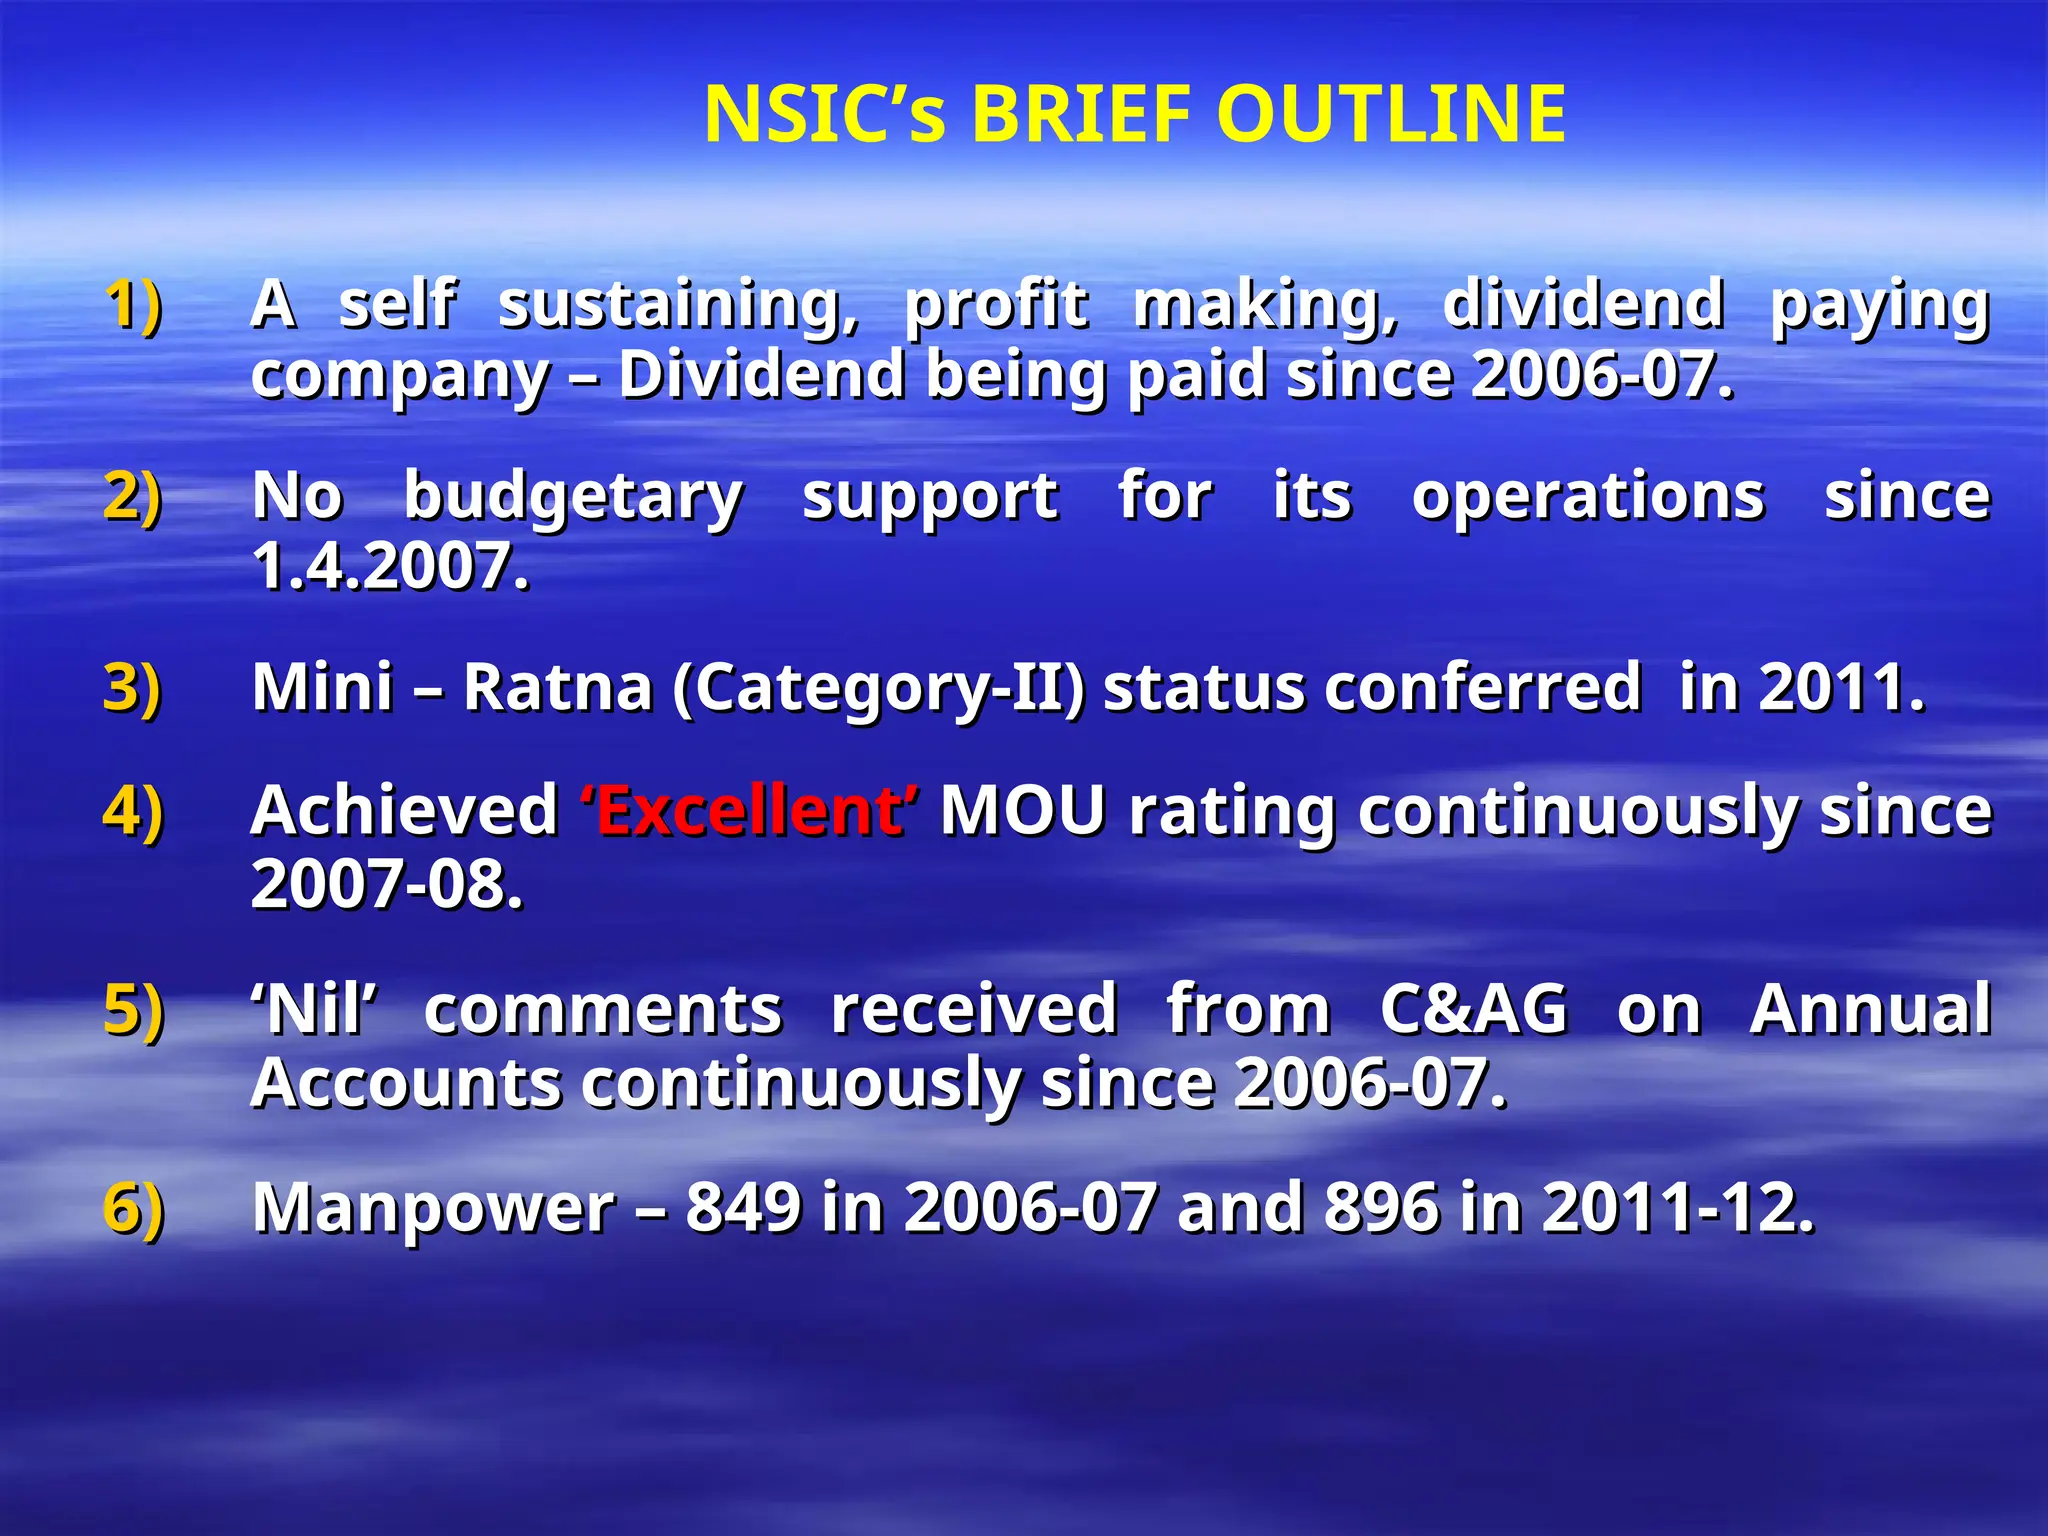
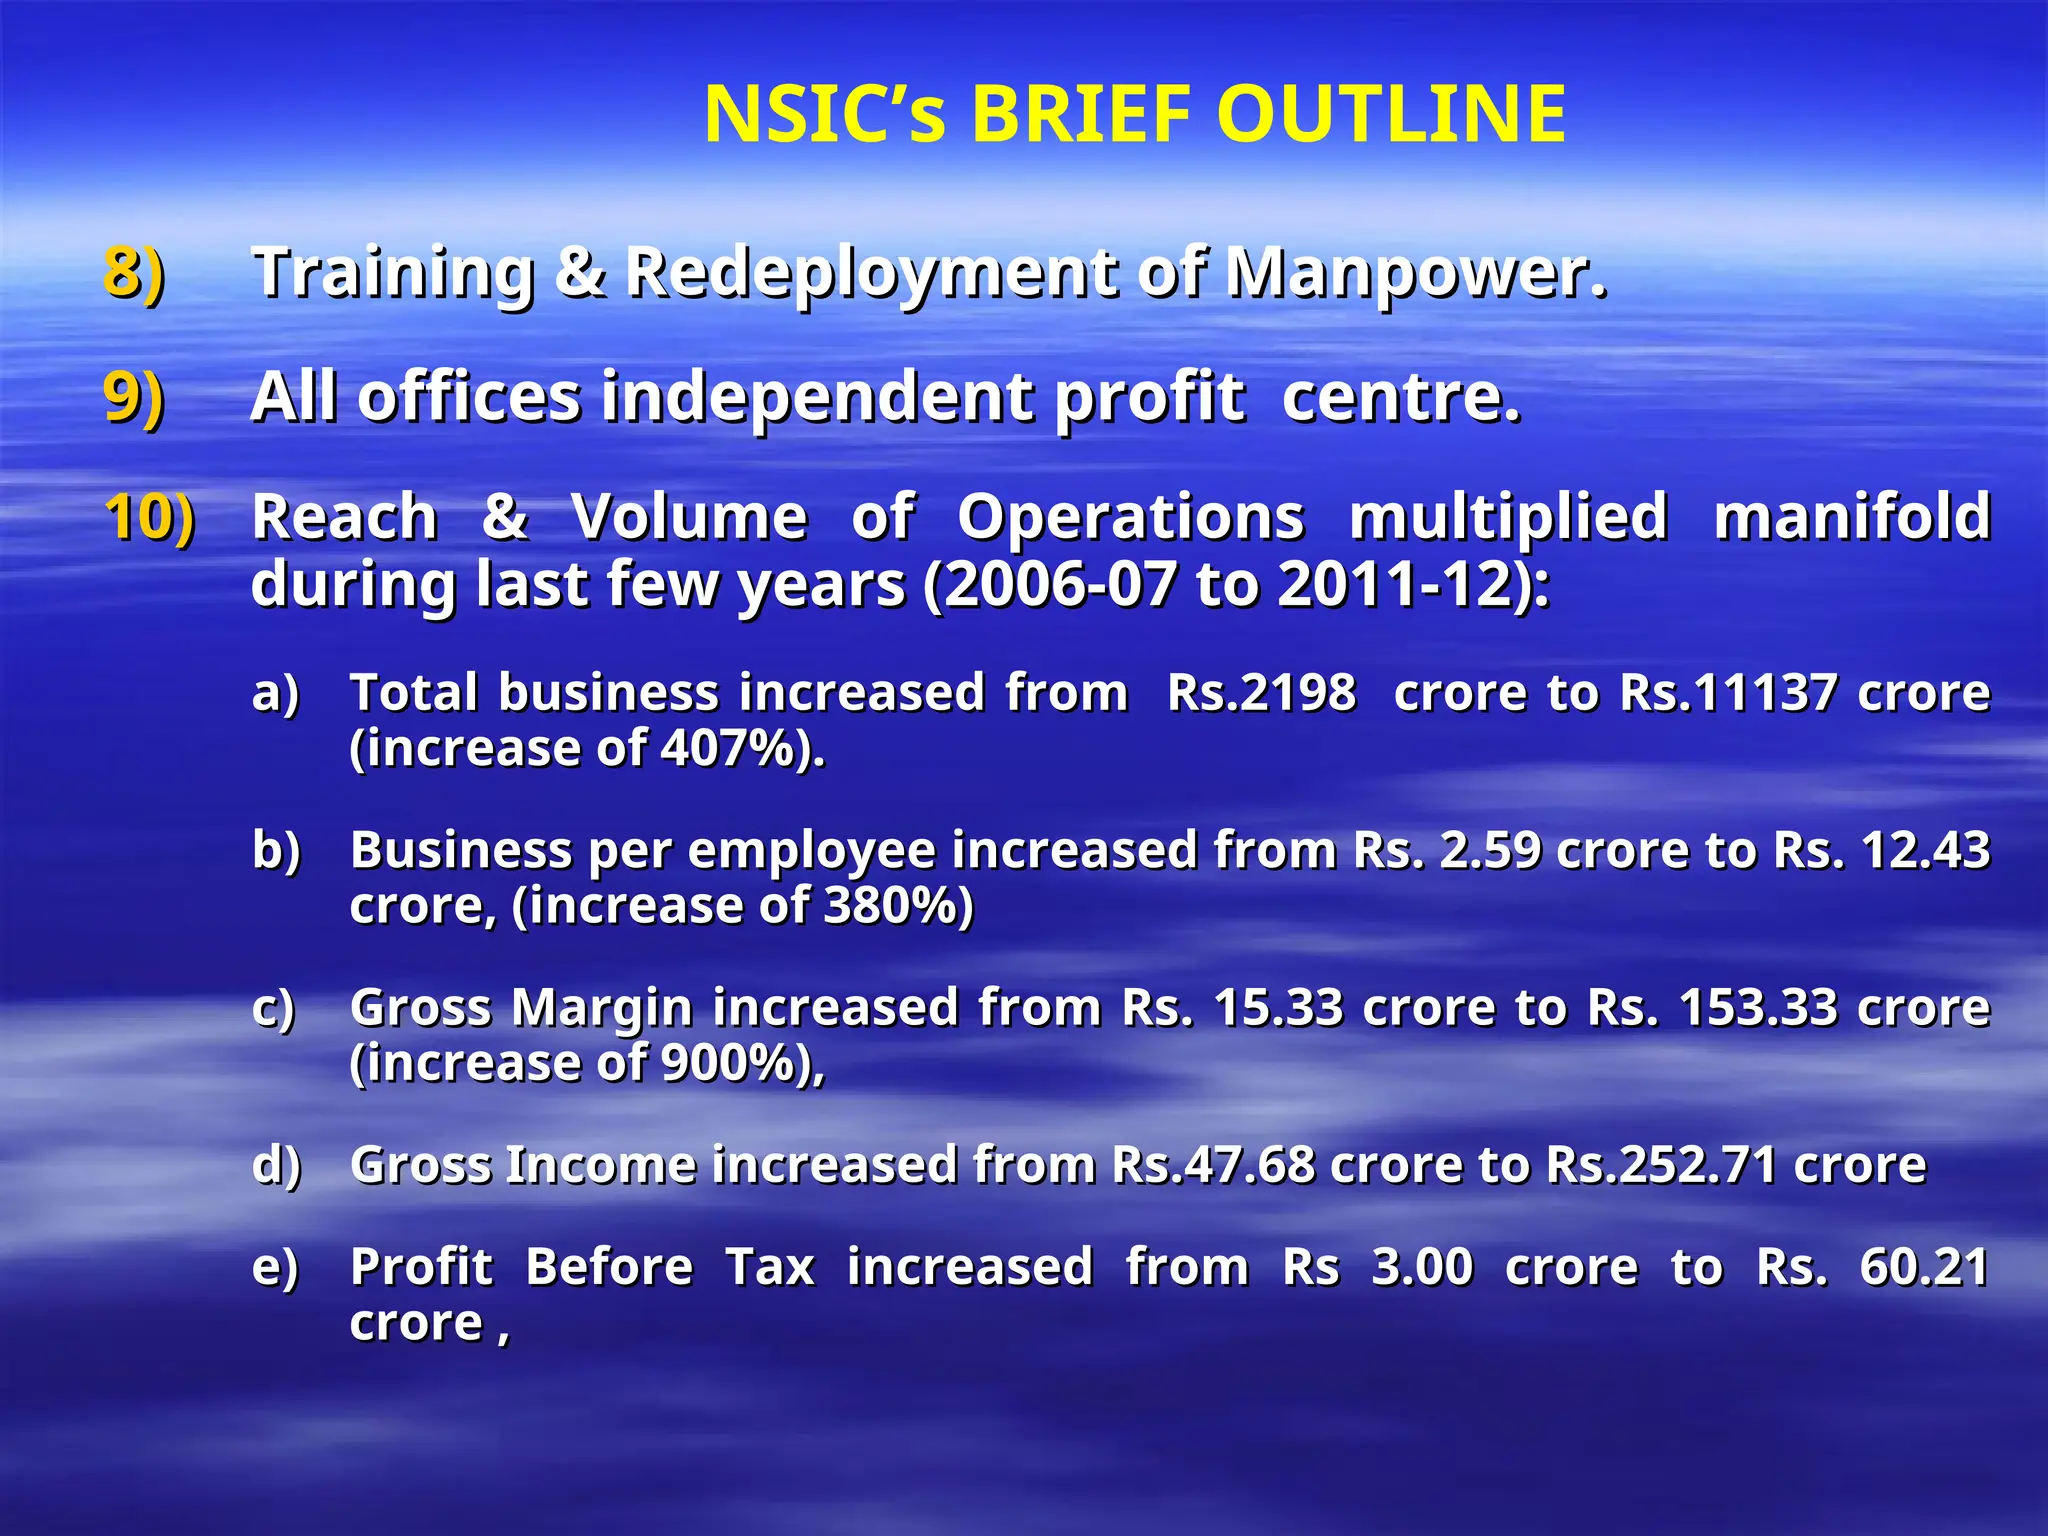
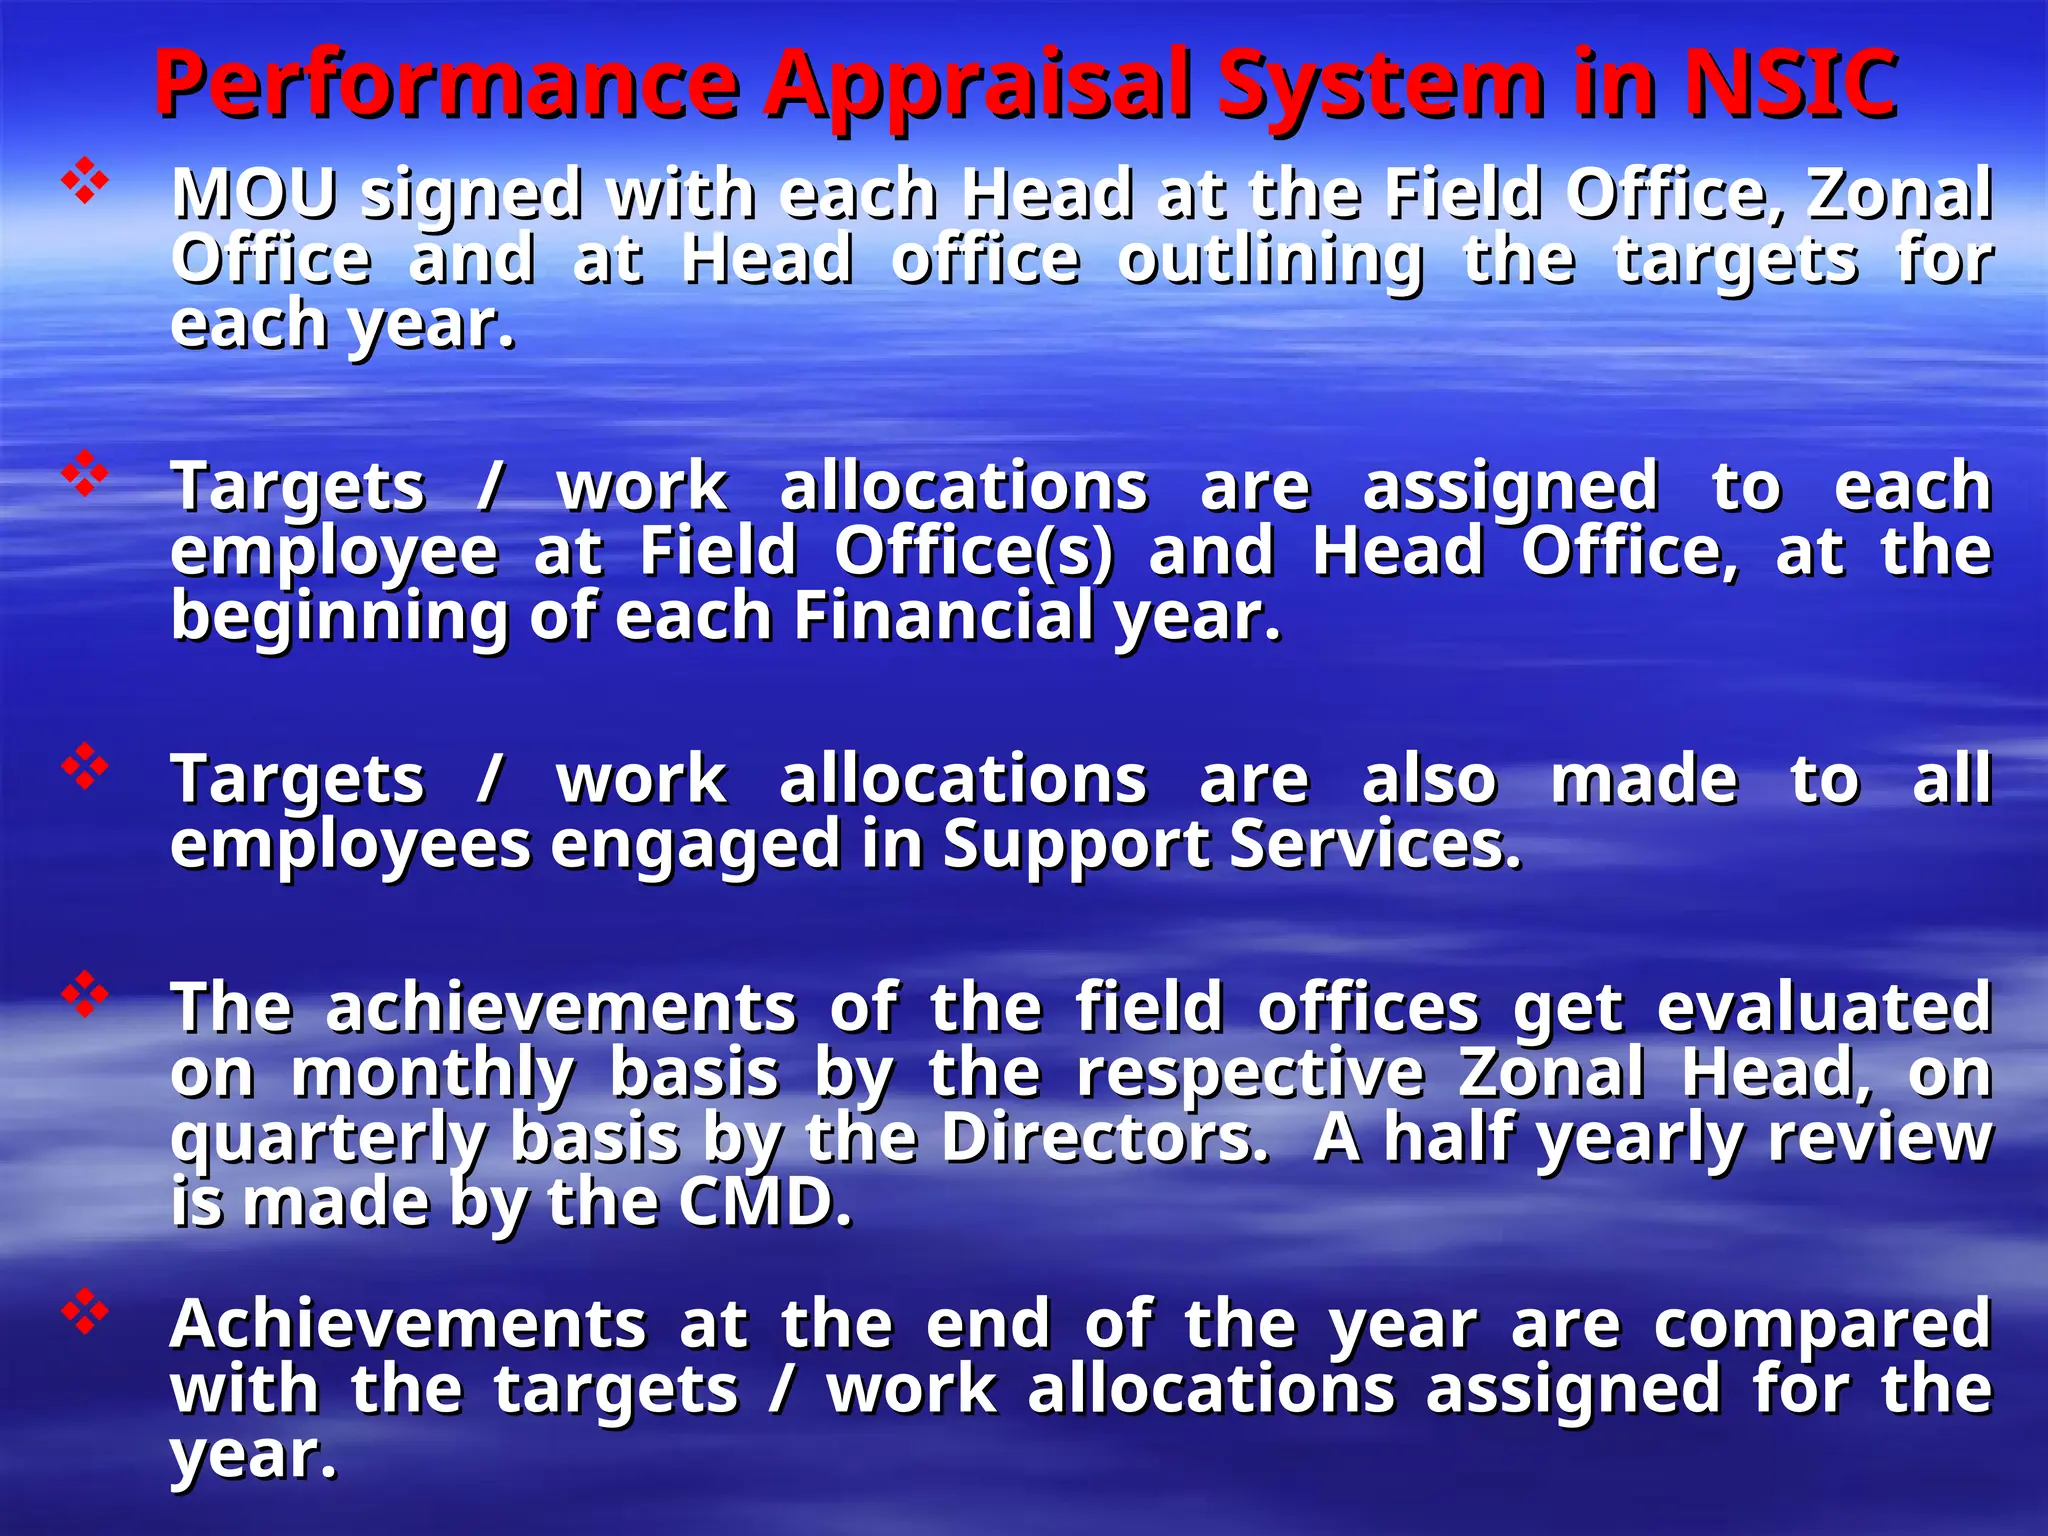
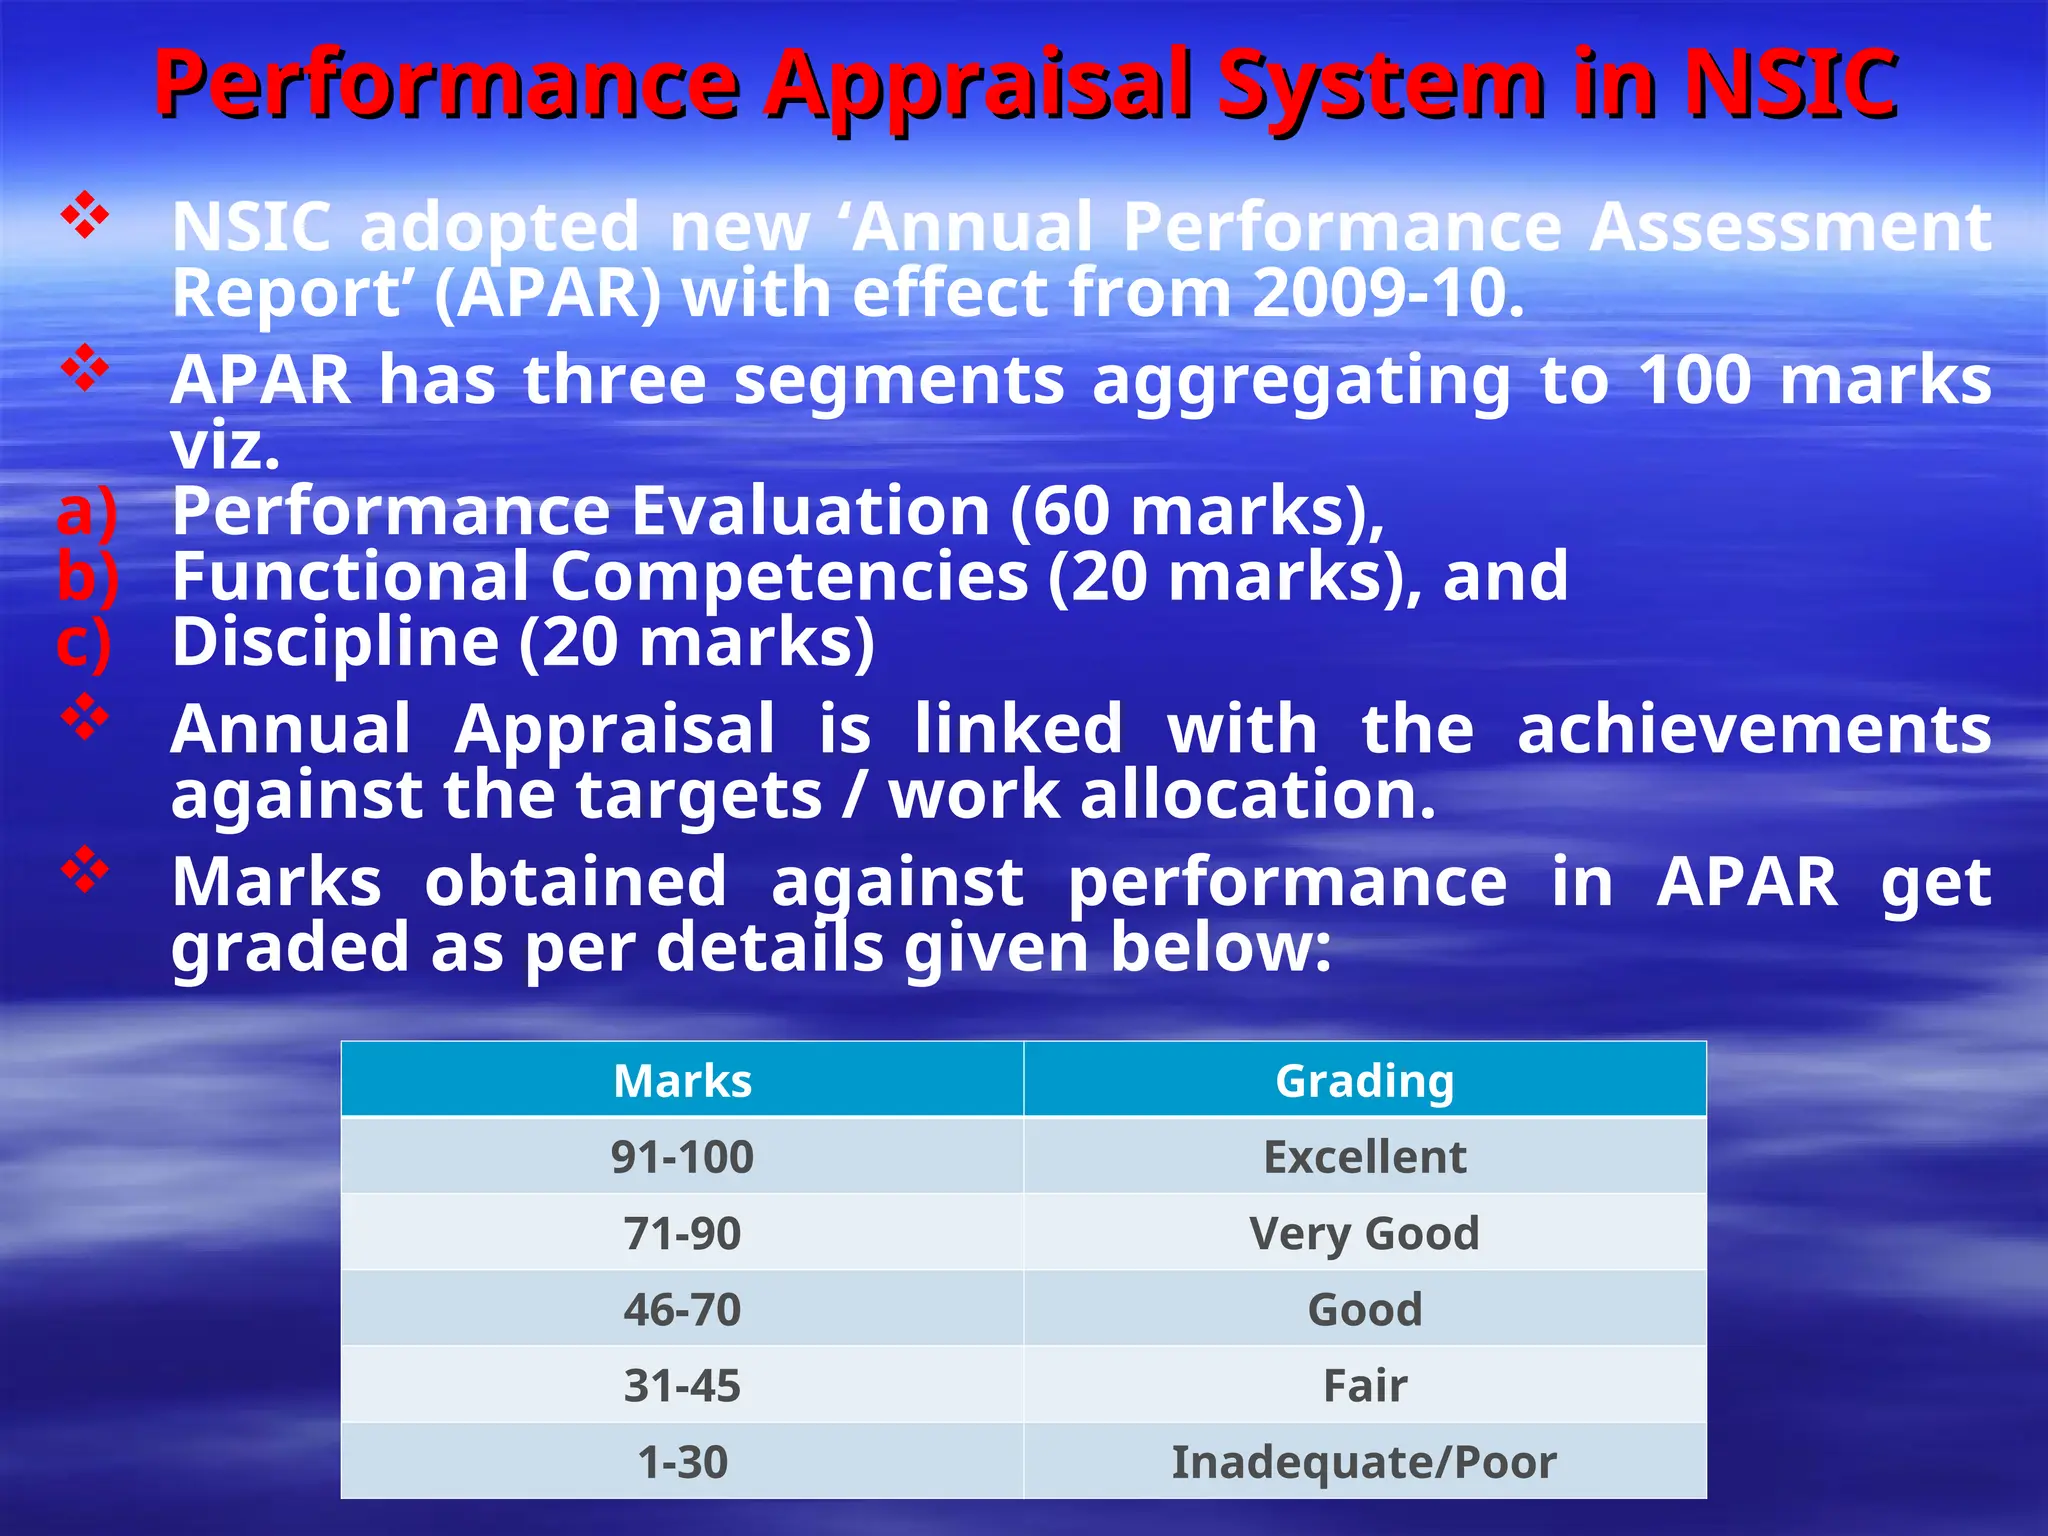
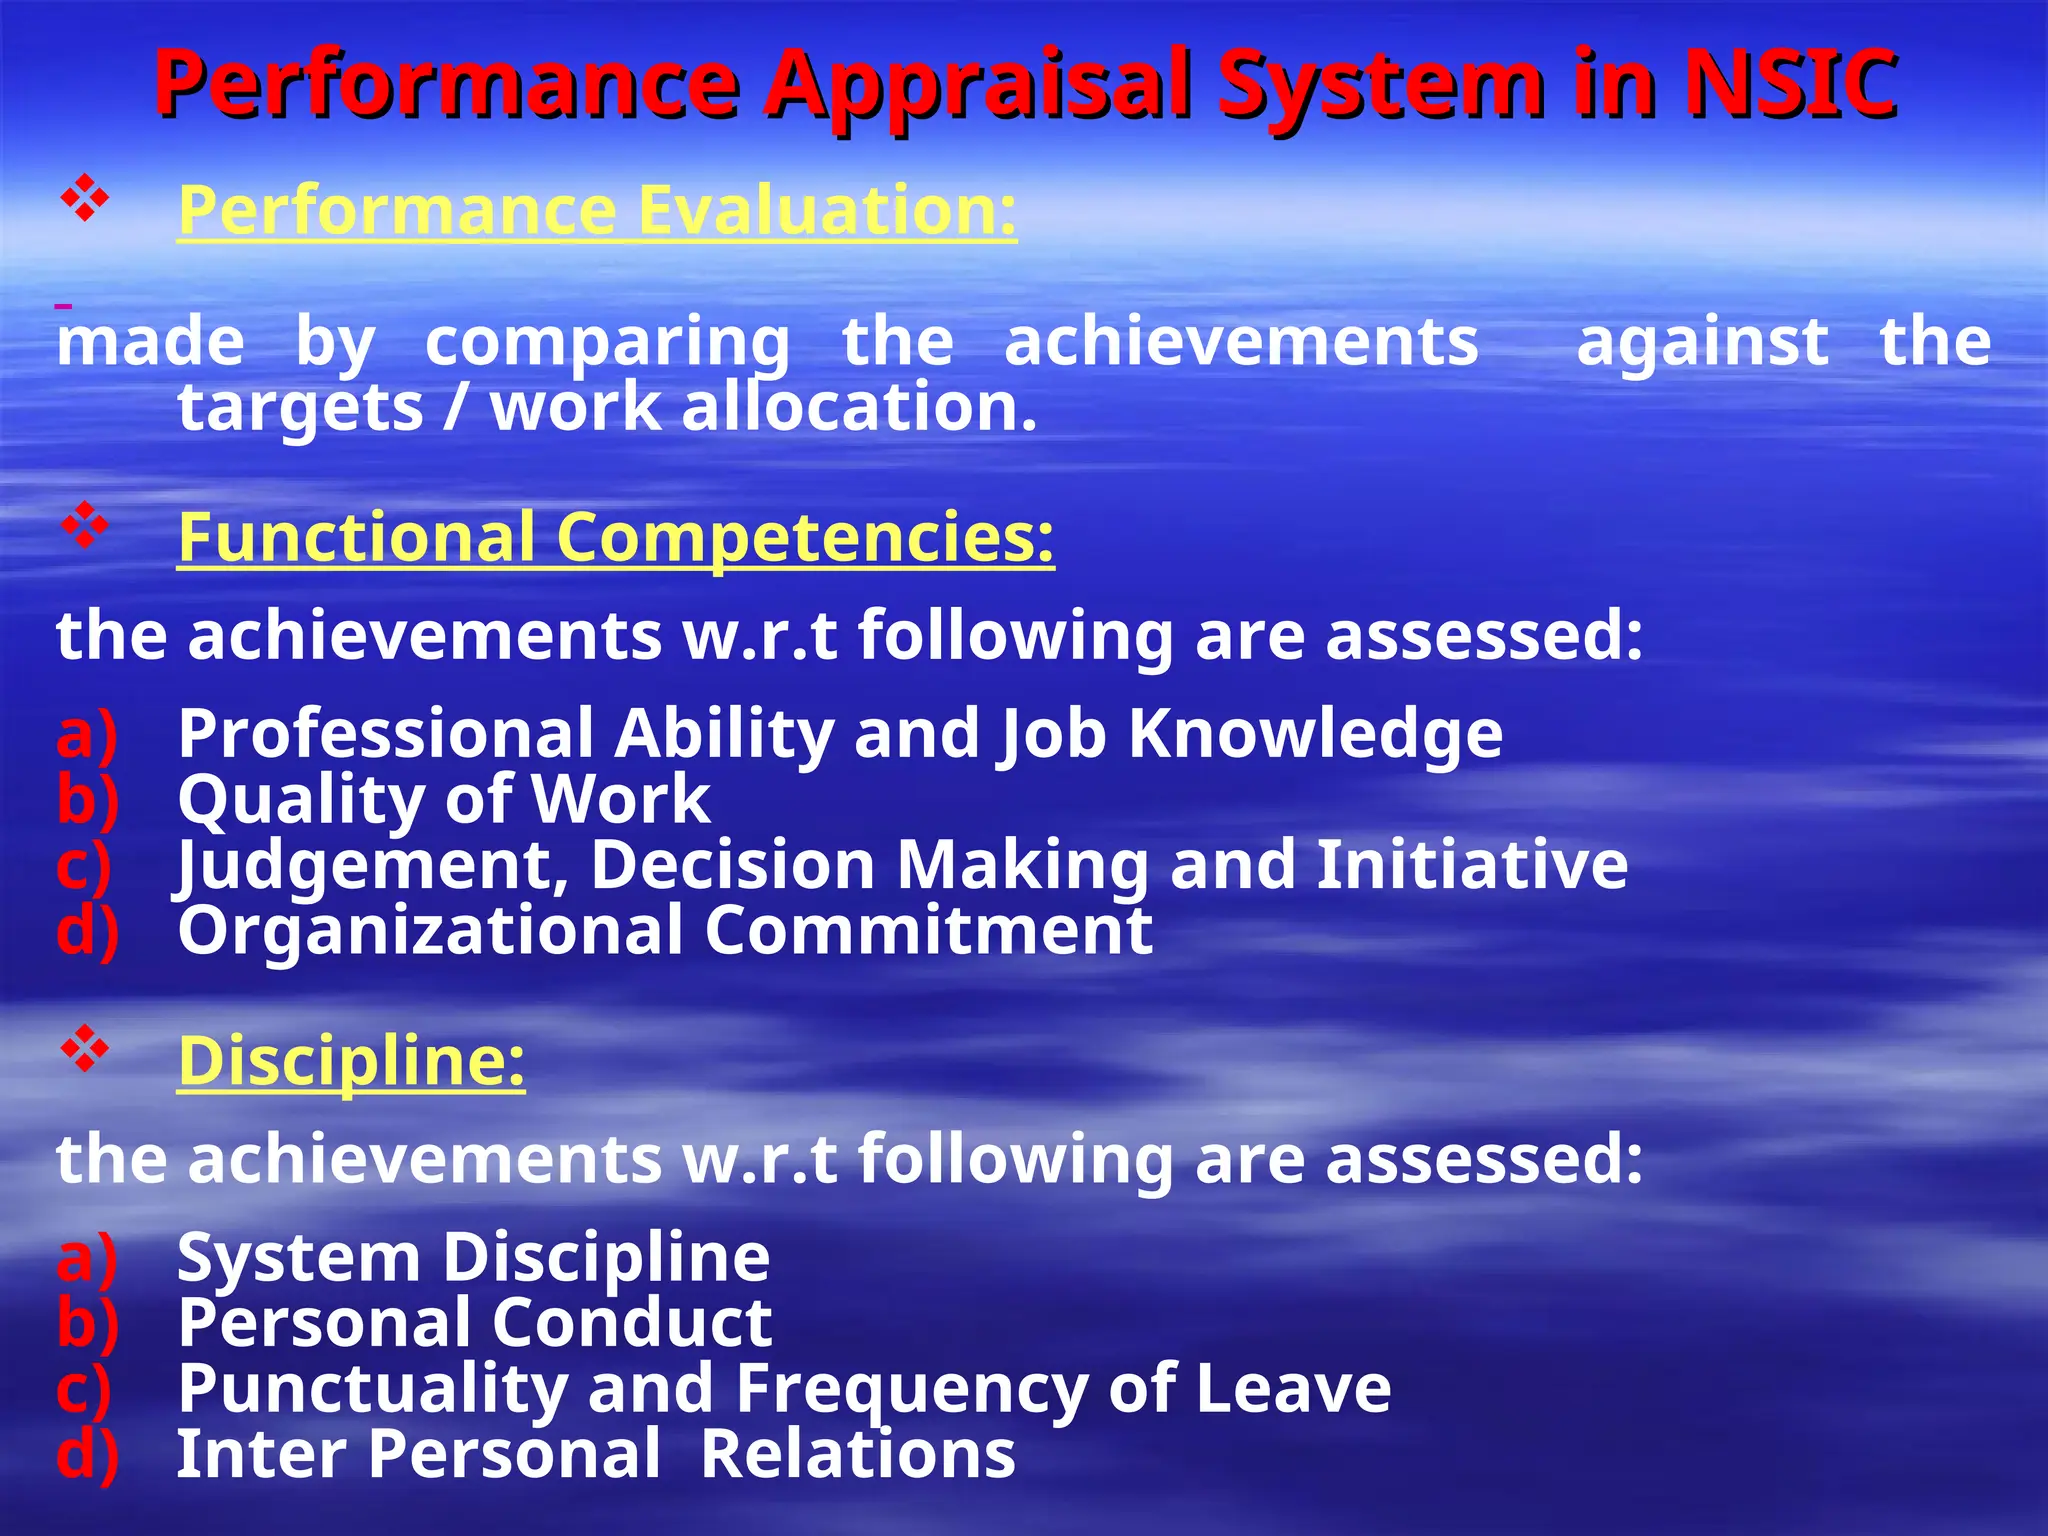
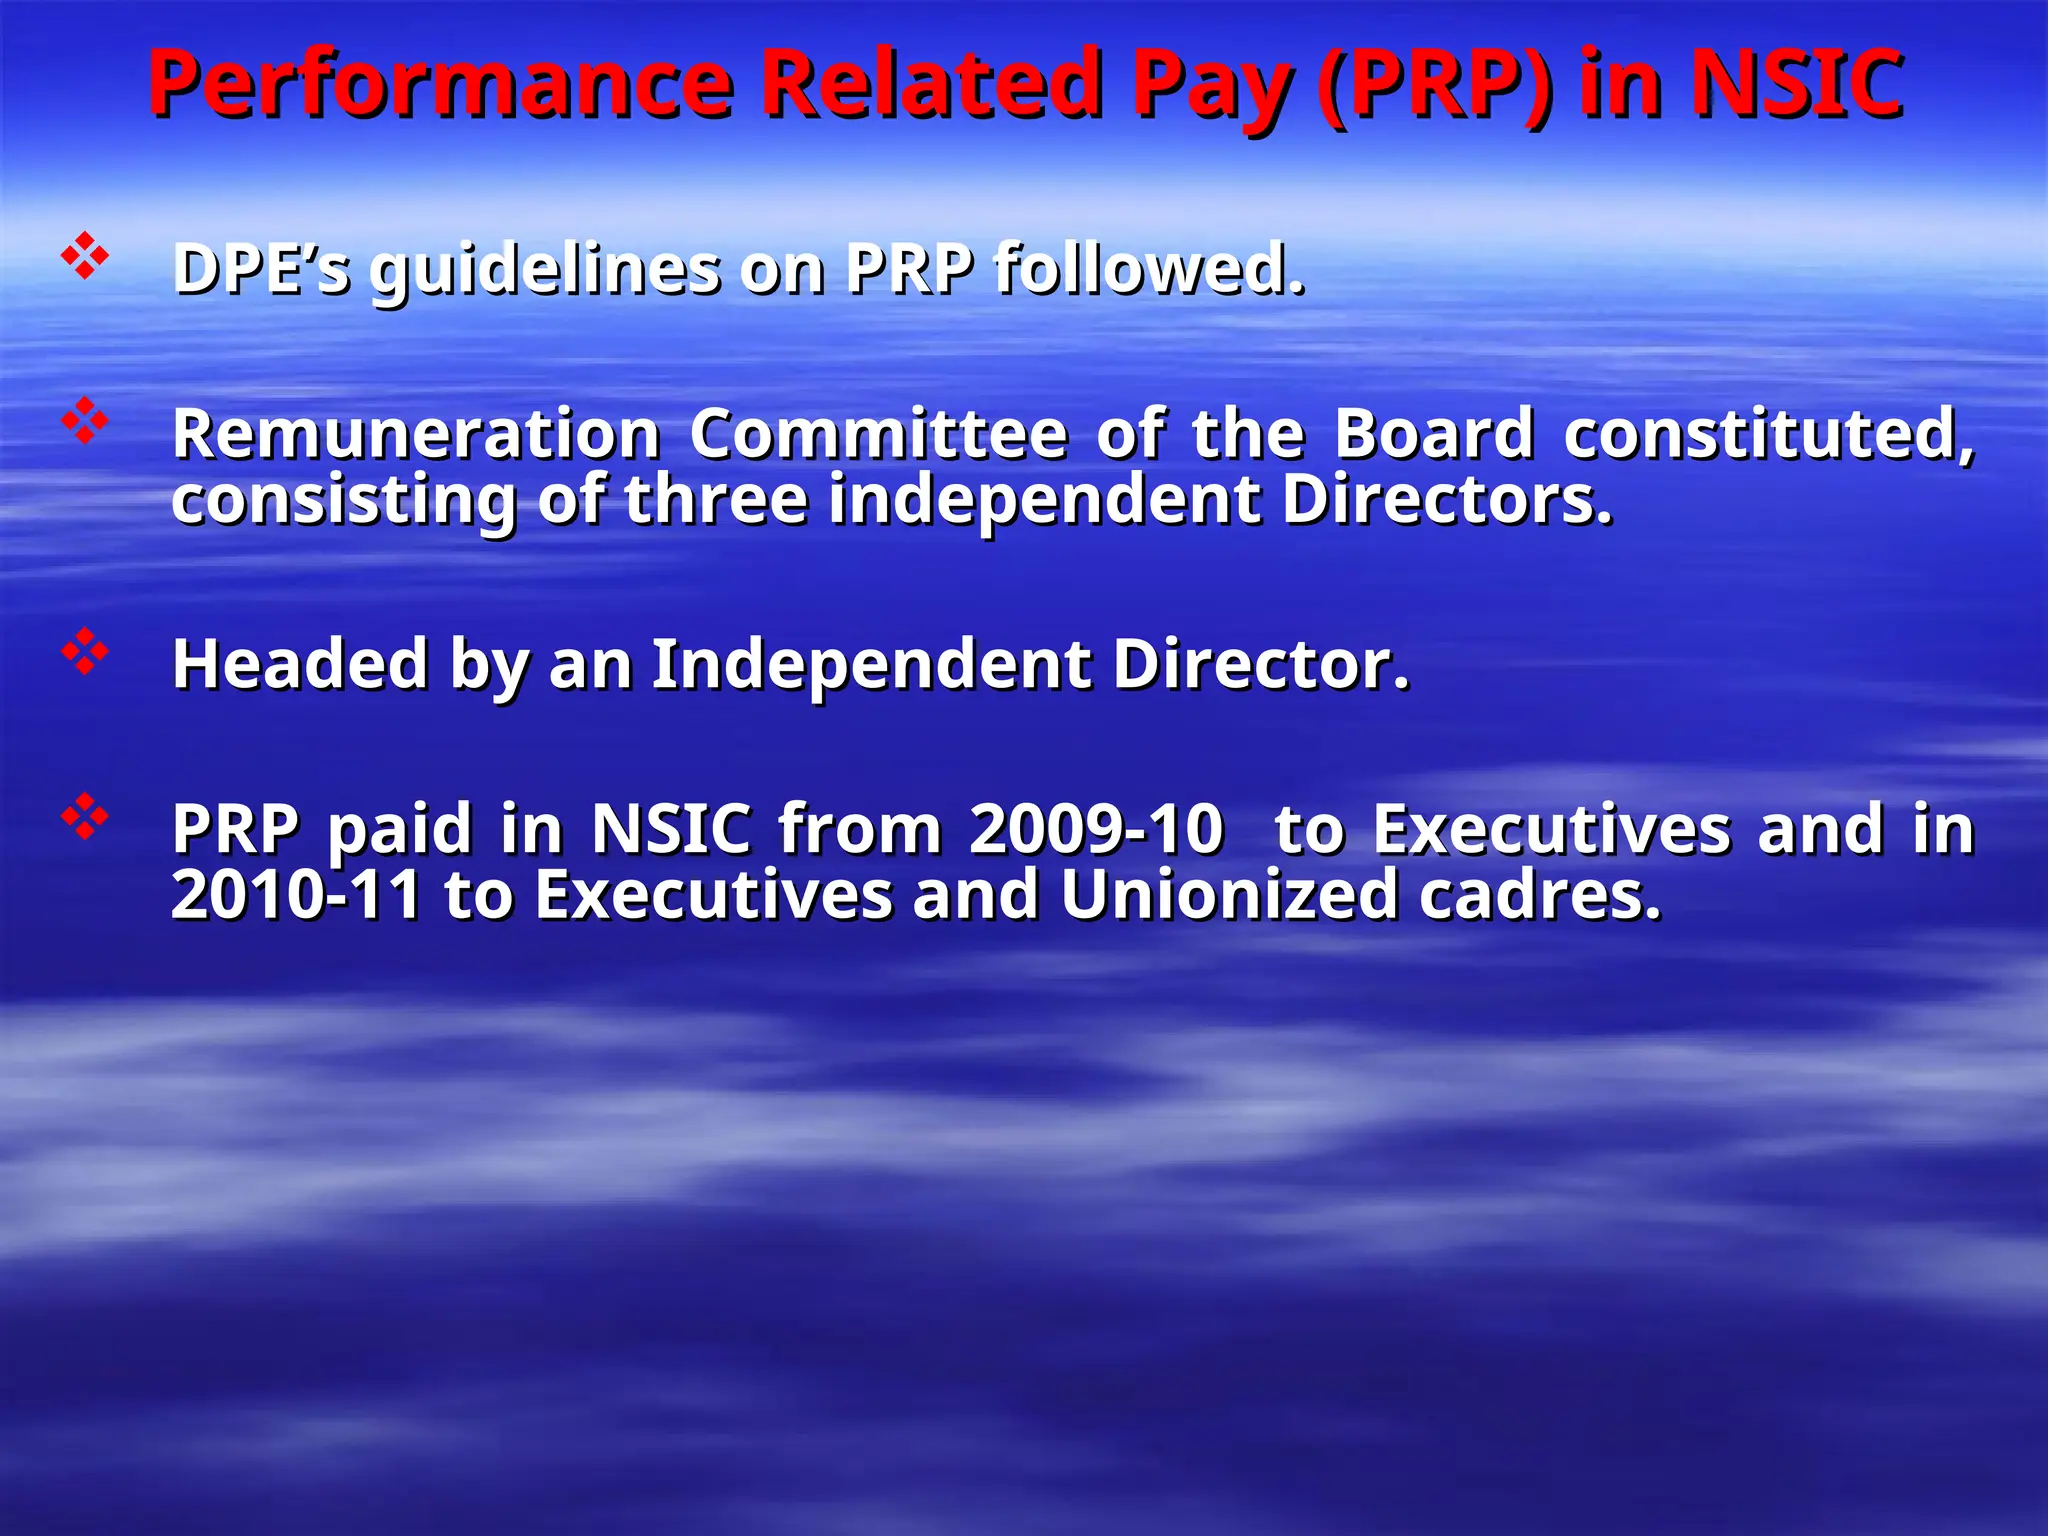
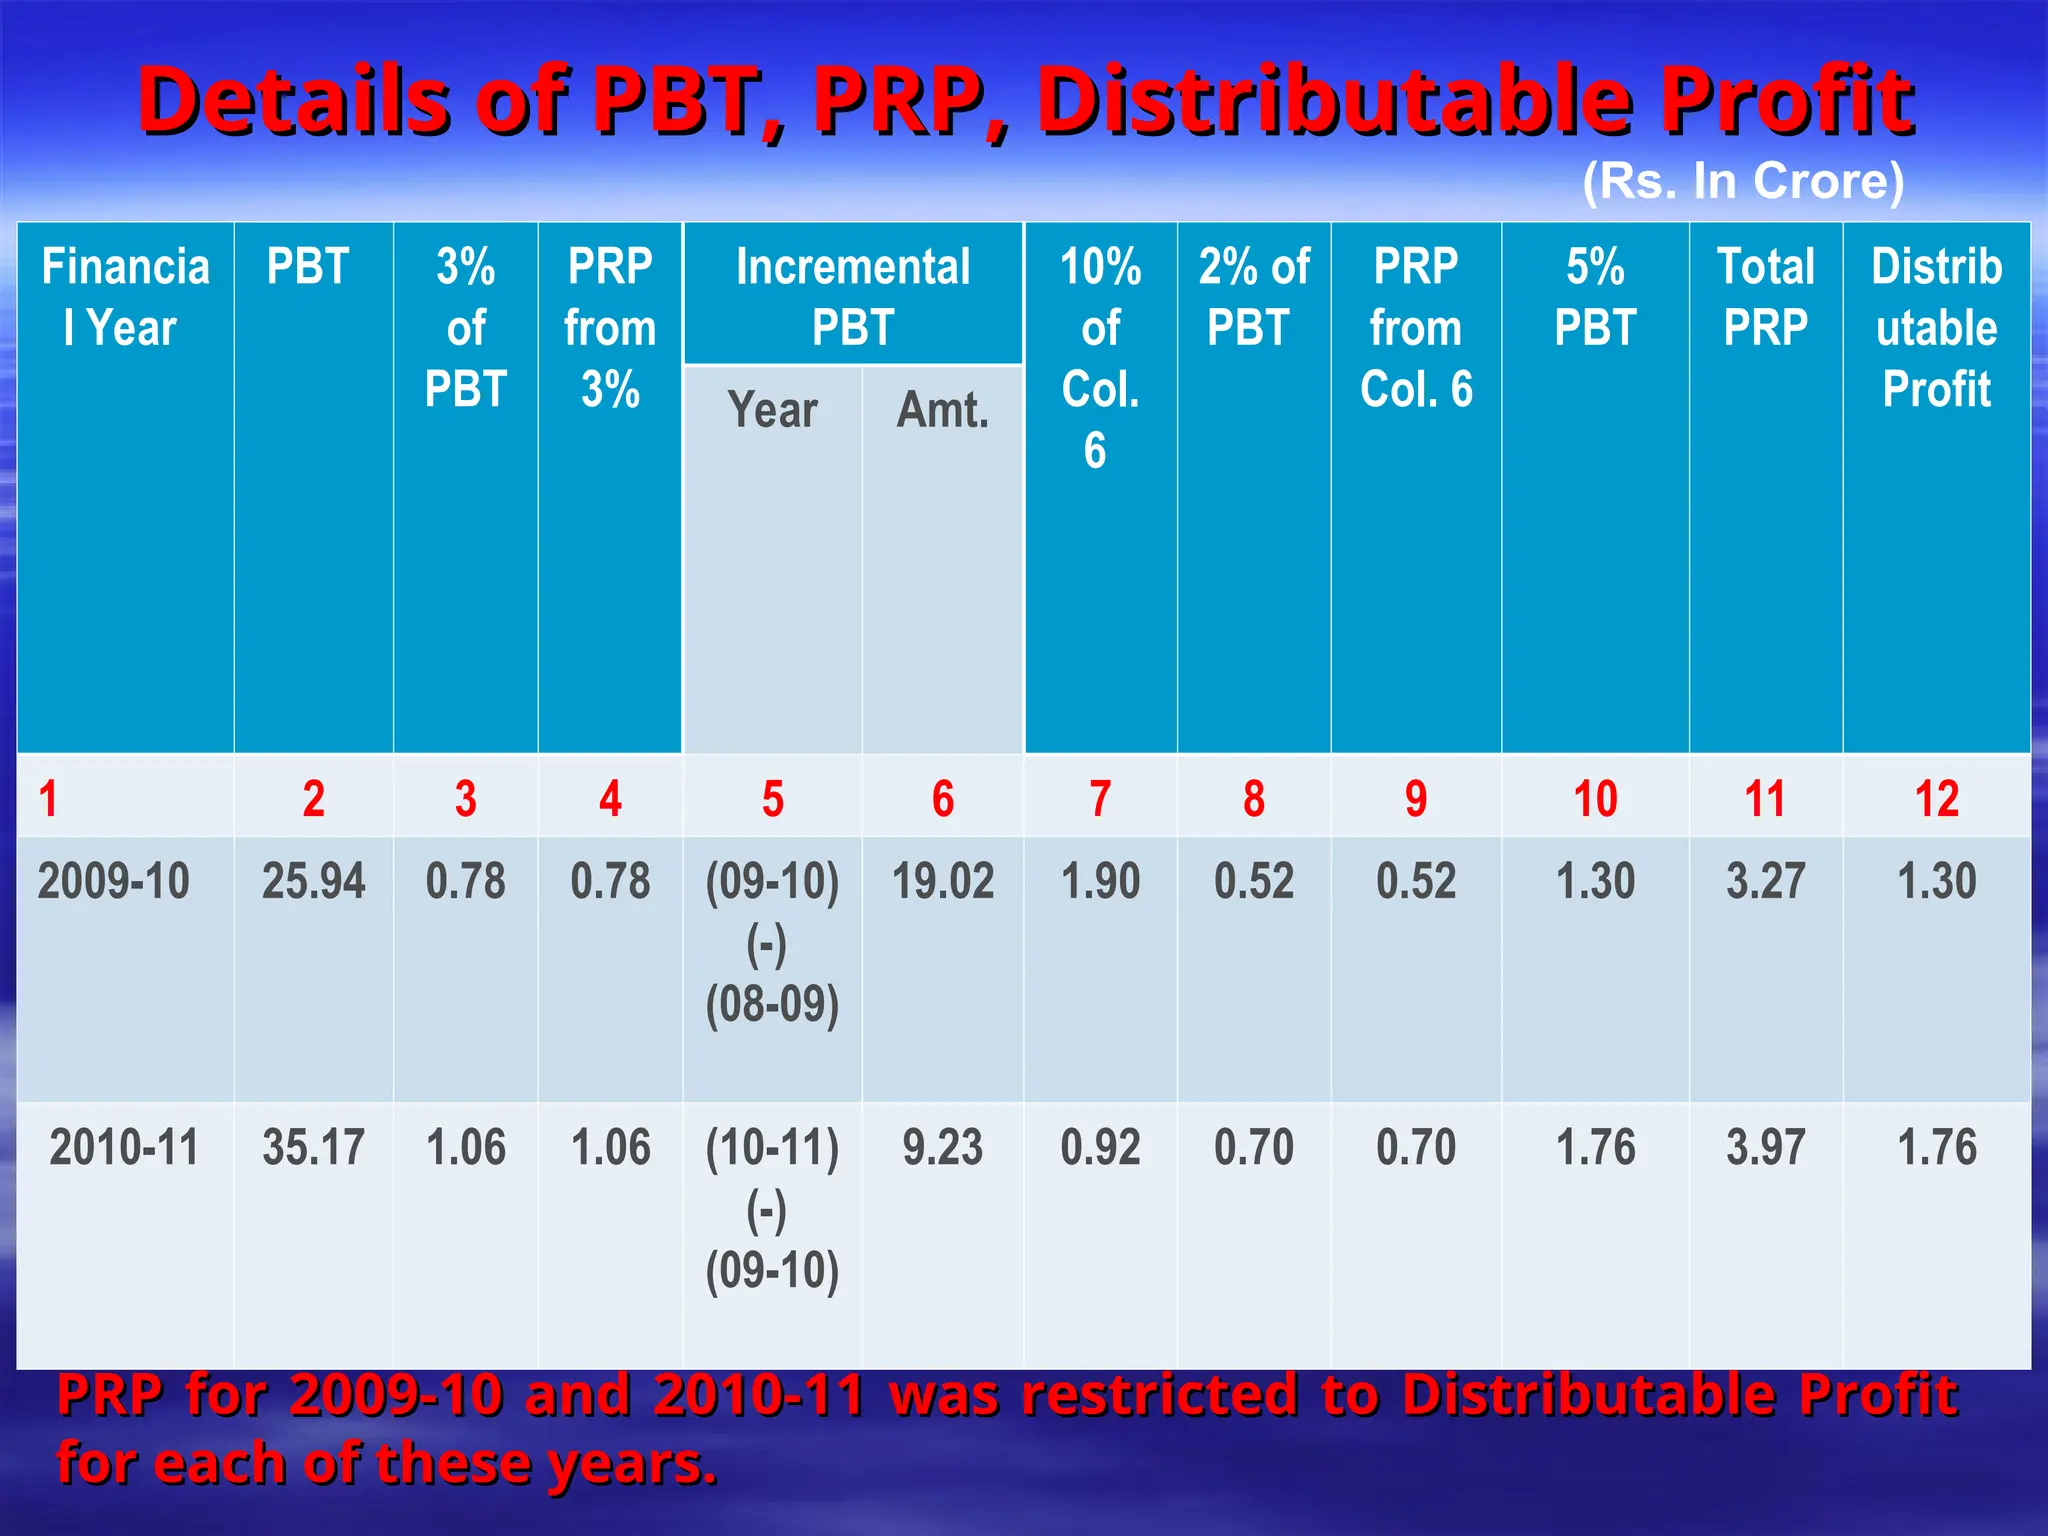


The document outlines the performance management system and performance-related pay (PRP) established by the National Small Industries Corporation (NSIC) to support MSMEs in India. It details the organization's self-sustaining operations, impressive growth in business and profit margins over the years, and the structured performance appraisal system for employees. The PRP system involves an independent remuneration committee and follows the bell curve approach established by DPE guidelines.