SlideShare a Scribd company logo
International Journal of Scientific and Research Publications, Volume 9, Issue 4, April 2019 303
ISSN 2250-3153
http://dx.doi.org/10.29322/IJSRP.9.04.2019.p8843 www.ijsrp.org
A Study on Comparative Analysis of Non-Performing
Assets in Selected Private Sector Bankst
Numer P, Devika P
Department of Business Administration with Computer Application, Sri Krishna Arts and Science College, Coimbatore.
DOI: 10.29322/IJSRP.9.04.2019.p8843
http://dx.doi.org/10.29322/IJSRP.9.04.2019.p8843
Abstract- Banking is the fastest growing economy in India. A
major consequence faced by banks nowadays is Non – Performing
Assets. A high level of NPA in banks will increase the credit
values and affects the profit of banks. Thus, the banks will lose
their investment for the long turn. The main objective of the study
is to highlight the NPA trend growth of each banks and the
Correlation Analysis of Net Profit and Net NPAs of each bank.
The study is descriptive in nature and secondary data are collected
and analyzed using Trend Ratio, Current Ratio, Assets on Equity
Ratio and Pearson Correlation Co-efficient Analysis to examining
NPAs, Net Profit and Assets quality of banks. The study is
observed for the financial years from 2013-14 to 2017-18, Annual
Reports of Selected Private Sector Banks such as Axis Bank,
Federal Bank, IndusInd Bank. The trend analysis is used to
understand the increasing profitability and bad loans structures in
the banks and Correlation Analysis is used to compare the Net
NPA and Net Profit. Through the study, it was concluded that
IndusInd Bank is having positive growth in Net Profit as well as
growth in NPAs which is not affecting the banking performance
when comparing with other two banks.
Index Terms- NPA, Trend Ratio, Current Ratio, Correlation Co-
efficient, Net Profit, Performance
I. INTRODUCTION
1.1.Overview of the Study
on-Performing Assets
Non-Performing Assets are meant by the uncovered funds
which is lender by the banks to individuals or a companies. The
amount which is lender to individual or companies have to be
written by 90 days or recover within 90 days of the cash received.
In case, the amount which is not recovered within 90 days it is
termed as Non-Performing Assets (NPA). The NPAs are sources
in credit risk and the cas to be received are mentioned as “out of
order” account.
The Non-Performing Assets are variously classified by
doubtful assets, substandard assets. The doubtful assets are to
recovered within 12 months and the substandard assets are amount
considered as the doubtful assets which are not received by the
bank.
Why Private Sector banks?
The role of private sector banks is increasing nowadays as
many individuals and companies are interested in getting loans for
their needs. Private Sector Banks are considering as fastest
provider in India Banking Sectors. While the public sector banks
are facing major NPAs and it is easy to find a solution to NPA
effects and their nature of affecting the banks’ performance. In
Private Sector Banks, Axis Bank, Federal Bank, IndusInd Bank is
selected for analysis as per the sales value in profit & loss account
and goodwill among the customers.
1.2 Industry Profile
 The Indian banking system consists of 27 public sector
banks, 21 private sector banks, 49 foreign banks, 56
regional rural banks, 1,562 urban cooperative banks and
94,384 rural cooperative banks, in addition to
cooperative credit institutions.
 As of Q2 FY2019, total credit extended by commercial
banks surged to ₹90,579.89 billion and deposits grew to
₹118,501.82 billion.
 Indian banks are increasingly focusing on adopting
integrated approach to risk management. Banks have
already embraced the international banking supervision
accord of Basel II, and majority of the banks already meet
capital requirements of Basel III, which has a deadline of
March 31, 2019.
 Reserve Bank of India (RBI) has decided to set up Public
Credit Registry (PCR) an extensive database of credit
information which is accessible to all stakeholders. The
Insolvency and Bankruptcy Code (Amendment)
Ordinance, 2017 Bill has been passed and is expected to
strengthen the banking sector.
 Deposits under Pradhan Mantri Jan Dhan Yojana
(PMJDY) increased to ₹863.21 billion were deposited
and 336.6 million accounts were opened in India. In May
2018, the Government of India provided ₹6 trillion loans
to 120 million beneficiaries under Mudra scheme. In May
2018, the total number of subscribers was 11 million,
under Atal Pension Yojna.
 Rising incomes are expected to enhance the need for
banking services in rural areas and therefore drive the
growth of the sector. As of September 2018, Department
of Financial Services (DFS), Ministry of Finance and
National Informatics Centre (NIC) launched Jan Dhan
Darshak as a part of financial inclusion initiative. It is a
mobile app to help people locate financial services in
India.
N
International Journal of Scientific and Research Publications, Volume 9, Issue 4, April 2019 304
ISSN 2250-3153
http://dx.doi.org/10.29322/IJSRP.9.04.2019.p8843 www.ijsrp.org
 The digital payments revolution will trigger massive
changes in the way credit is disbursed in India. Debit
cards have radically replaced credit cards as the preferred
payment mode in India, after demonetization. Debit cards
garnered a share of 87.14 per cent of the total card
spending.
List of Public Sector Banks and Private Sector Banks in India
Public Sector Banks Private Sector Banks
1. Allahabad Bank
2. Andhra Bank
3. Bank of Baroda
4. Bank of India
5. Bank of Maharashtra
6. Canara Bank
7. Central Bank of India
8. Corporation Bank
9. Dena Bank
10. Indian Bank
11. Indian Overseas Bank
12. Oriental Bank of Commerce
13. Punjab National Bank
14. Punjab & Sind Bank
15. State Bank of India
16. Syndicate Bank
17. UCO Bank
18. Union Bank of India
19. United Bank of India
20. Vijaya Bank
21. IDBI Bank Ltd
22. Bharatiya Mahila Bank
1. Catholic Syrian Bank
2. City Union Bank
3. Dhanlaxmi Bank
4. Federal Bank
5. Jammu and Kashmir Bank
6. Karnataka Bank
7. Karur Vysya Bank
8. Lakshmi Vilas Bank
9. Nainital Bank
10. Ratnakar Bank
11. South Indian Bank
12. Tamilnad Mercantile Bank
13. Axis Bank
14. Development Credit Bank
15. HDFC Bank
16. ICICI Bank
17. IndusInd Bank
18. Kotak Mahindra Bank
19. Yes Bank
20. IDFC
21. Bandhan Bank
For the study, Three Banks from Private Sector is selected namely Axis Bank, Federal Bank and IndusInd Bank.
International Journal of Scientific and Research Publications, Volume 9, Issue 4, April 2019 305
ISSN 2250-3153
http://dx.doi.org/10.29322/IJSRP.9.04.2019.p8843 www.ijsrp.org
1.3 Company Profile
1.3.1 Axis Bank
It is India’s third largest private sector bank, which is
offering the sources and funs to the business operations in various
sectors of the industrial units and the publics. The Bank has 59,600
employees with its 3,882 domestic branches and 12,660 ATMs
across the country. The network of Axis Bank spreads across
2,211 cities and towns, enabling the Bank to reach out to a large
cross-section of customers with an array of products and services.
Vision
To be the preferred financial solutions provider excelling in
customer delivery through insight, empowered employees and
smart use of technology.
Values
Company’s Core Values,
 Customer Centricity
 Ethics
 Transparency
 Teamwork
 Ownership
Chief Executive Officer
Amitabh Chaudhry
Industry Type : Private Limited Bank
Operating Profit : ₹15,594 Crores
Net Profit : ₹ 276 Crores
Gross NPA% : 6.77%
Net NPA% : 3.40%
Corporate Social Responsibility
Amount of Corporate Social Responsibility expenses spent
during the year - 126.50 crores
 Infrastructure Development
 Environmental
 Healthcare
 Education
1.3.2 Federal Bank
The ancient development of federal bank is brought by the
year 1931 and avil the first facility of banking resources for the
people in pre-independence era. The founder and the visionary of
federal bank, Late K.P Hormis is the main coin for the bank to be
developed in this particular modern times of India. Federal Bank
is orginated from its ancient name as Nationwide Institutions. Now
the bank is developed and placed its leg in 25 states and makes its
best part of BSE and NSE stock prices.
Vision
 To be the ‘Most Admired Bank’ which is digitally
enabled with a sharp focus on Micro, Medium and
Middle market enterprises.
International Journal of Scientific and Research Publications, Volume 9, Issue 4, April 2019 306
ISSN 2250-3153
http://dx.doi.org/10.29322/IJSRP.9.04.2019.p8843 www.ijsrp.org
Mission
 Achieve a consistent annual post-tax return of 18% per
month.
 Develop in every employee a high degree of pride and
loyalty in serving the bank.
Chief Executive Officer
Shyam Srinivasan
Industry Type : Private Limited Bank
Operating Profit : ₹ 5,692 Crores
Net Profit : ₹ 2,297 Crores
Gross NPA% : 3%
Net NPA% : 1.69%
Corporate Social Responsibility
The bank has spent 14.43 crores on various social and
environment activities, in the areas follow as,
 Education and Skill
 Healthcare & Safety
 Rural Development
 Welfare & Poverty


1.3.3 IndusInd Bank
IndusInd Bank Limited is a Mumbai based Indian new
generation bank, established in 1994. IndusInd Bank was
inaugurated in April 1994 by then Union Finance
Minister Manmohan Singh. IndusInd Bank is the first among the
new-generation private banks in India. As on June 30, 2016,
IndusInd Bank has 1,004 branches, and 1885 ATMs spread across
625 geographical locations of the country. Mumbai has the
maximum number of bank branches followed by New
Delhi and Chennai. The bank has also proposed to double the
branches count to 1200 by March 2019.
Vision
IndusInd Bank will be,
 A relevant business and banking partner to its clients.
 Customer Responsive, striving at all times to collaborate
with clients in providing solutions for their banking needs.
 A forerunner in the marketplace in terms of profitability,
productivity and efficiency.
 Engaged with all our stakeholders and will deliver
sustainable and compliant returns.
Mission
 They will consistently add value to all our stakeholders and
emerge as India’s most convenient Bank with Best-in-
Banking financial parameters together with the doubling
of loan book, clients and profits within the next 3 years.

Chief Executive Officer
Romesh Sobti
International Journal of Scientific and Research Publications, Volume 9, Issue 4, April 2019 307
ISSN 2250-3153
http://dx.doi.org/10.29322/IJSRP.9.04.2019.p8843 www.ijsrp.org
Type Of Industry : Private Bank Limited
Operating Profit : ₹ 6,656 Crores
Net Profit : ₹ 3,606 Crores
Gross NPA% : 1.34%
Net NPA% : 0.54%
Corporate Social Responsibility
The Bank has spent 20.47 crores on various social and
environmental activities, in the areas follows as,
 Rural Development & Inclusiveness
 Environmental
 Sustainability
 Preventive
 Healthcare
 Education & Sports
1.4 Need for the Study
Banking is the fastest growing economy in India. A major
consequence faced by banks now a days is Non – Performing
Assets. A high level of NPA in banks will increase the credit
values and affects the profit of banks. Thus, the banks will lose
their investment for long turn. The article titled “Banks NPAs
touch 12.2% by March 2019” is showing the current NPAs rising
from 11.6% to 12.2% by March 2019. This shows that Banks and
its sector are having more capitalization in investing money and
affects the entire economy of the country. It is necessary to trim
the NPAs to protect the country’s economy and to increase Bank’s
efficiency.
1.5 Objectives of the Study
Primary Objective
 To Study on comparative analysis of Non –
Performing Assets in Selected Private Sector
Banks in India.
Secondary Objectives
 To study the trend of Gross NPA and Net NPA
of Selected Private Sector Banks in India.
 To measure the effect of NPA in Selected
Private Sector Banks Performance.
1.6 Scope of the Study
The scope of the study is to understand the comparative
analysis of Non-Performing Assets based on secondary collected
from Annual Reports of the Banks. The empirical research is used
to analyse the data and variables. The Pearson Correlation Co-
Efficient tool is used to find the relationship between two variables
and analyse the trend factors in GNPA and NNPA. The process of
disbursement is used to evaluate the loans disbursement in various
sectors and analysing the NPAs in the Geographical distributions.
1.7 Limitations of the Study
 The study is observed from the financial year FY2013-
FY2014 to FY2017-FY2018.
 The data is only based on the secondary data set and
focused only on the limited financial statement.
 The study is focused only on three banks such as Axis
Bank, Federal Bank, IndusInd Bank only.
II. LITERATURE REVIEW
2.1 Theoretical Concepts
Comparative analysis is used to compare two or more
factors to find the positive relationship in each category of the
financial statements or business reports of an individual or
company based on its market share value, sales report, financial
strategy and net operating revenue. The Bank performance is
maintained by the Net Profit and Net Sales acquired through the
financial years. In this case, Loans are marking up the important
structures in creating the performance of banks as low or high in
market structure. The loans paying to customer or an individual is
to repay or recover by bank from the customer within 90 days and
should be considered as interest amount collected on the basis of
principal amount provided. When the loans provided to the
customer or an individual is become non recoverable funds in
future (after 90 days) is considered as Non-Performing Loans or
Bad Loans. The Non-Performing Loans are playing major role in
bank performance for creating the net profit and analyse the
growth of the company for each year. The non-recovered funds are
disbursed among various sectors and the NPAs in top five sectors
is increasing each financial years. The study is Analytical in nature
and analyse the secondary data using various tools like Trend
Analysis and Pearson Correlation Co-efficient Ratio in each
sectors. Trend Analysis is used to understand the growth of each
year and used to analyse to collected data as positive and negative
trend growth. Trend analysis can be allowed to each bank and
promotes the future trending values in the Profit of Banks.
International Journal of Scientific and Research Publications, Volume 9, Issue 4, April 2019 308
ISSN 2250-3153
http://dx.doi.org/10.29322/IJSRP.9.04.2019.p8843 www.ijsrp.org
2.2 Review of Literature
1. Kanika Goyal (2010), an article on “Empirical Study
on Non-Performing Assets and Management of
Indian Public Sector Banks”. The analysis is based on
trend ratio of GNPAs, NNPAs and Assets quality. The
data is analyzed using Percentage analysis and statistical
tools approaching tools like regression analysis, and co-
efficient approach on ANOVA test and Post Low-Key
HSD Procedures.
2. Bhawna Sethi (2013) had studied “The Comparative
Analysis of NPAs in Punjab National Bank and State
Bank of India”. The methodology is based on
conceptual framework, population and sample selection,
collection of data, analysis of data. Tools use for the
analysis is based on Mean, Standard Deviation, Standard
Error, T-Test, ANOVA Test.
3. Samir (June 2013) had studied a “Comparative
Analysis of Non-Performing Assets of Selected
Commercial Banks in India. Its objective is to prevent
or delays recycling of funds and erodes profit by way of
provisions. The methodology is analytical in nature to
understand the trend in Gross NPA and Net NPAs as
percentage of total Assets respectively. This Paper is
based on trend analysis of NPA and evaluates the
financial health of banks.
4. Krishna Murari (Aug 2014) had studied
“Comparative Analysis of Non-Performing Assets of
Indian Banks: A Study of Public and Private Sector
Banks”. The Data is analyzed using Percentage and ratio
method of trend projection and one-way ANOVA. The
main objective of banking reforms was to improve
efficiency, productivity and profitability of banks.
5. Ankur Bhushan (Dec. 2016) had studied “The
comparative study on NPA in HDFC Bank and OBC
Bank” and screens in the nature of bank’s credit
portfolio. The Objective on study is impact on NPA. The
methodology is based on Auxiliary data and wellsprings
of Data. The ratio analysis of NPA is based on limited
resources of NPAs.
6. Ayub Ahamed KS (Dec.2016) had studied a
“Comparative Study of Non-Performing Assets in
Private Sectors Banks and Public Sector Banks in
India”. The objectives are to study NPA trend in last 5
years of Private and private sector banks to measure and
suggest the proper management of NPA in Banks.
Research Methodology used to carry out is descriptive in
nature and describing samples on IDBI Bank, Canara
Bank, Central Bank, Axis Bank, ICICI Bank, Kotak
Mahindra Bank.
7. Nithin Gupta (2016) had studied on “Non-Performing
Assets of Public and Private Sector Banks in India”.
The data is based on secondary data and analyzed using
ratio analysis. The objective on sector wise distribution
of NPAs in Public Sector Banks and Private Sector
Banks. The ratio helps in finding out the decision on
capital funds and the replacement opportunities in the
Loans providing Sectors.
8. Payel Roy (2016) had studied “The Analysis of Non-
Performing Assets in Public Sector Banks of India”.
The banks advancing loans should be cautious enough to
consider the backgrounds of loan receiver. The secondary
data are used on study and analyzed using the secondary
data to find the loans distributions and tools used like
ANOVA, Regression Analysis for the secondary
objectives of the study.
9. Vivek Rajbahadur Singh (2016) had studied “The
Non-Performing Assets of Commercial Banks and its
recovery in India”. The objectives are based on avoid
future distractions in NPAs. The methodology based on
secondary Data. Highlights the trend analysis and status
in impacts in NPA. The NPAs are based on the
commercial uses in the recovering process.
10. Dr. Biswanath Sukul (Jan. 2017) had studied on
“Non-Performing Assets: A comparative analysis of
selected private sector banks”. The objectives is to find
the comparative analysis on NPA in HDFC Bank, Axis
Bank, ICICI Bank. The methodology based on analytical
nature and finding the trend ratio in NPAs. The Pearson
Correlation Co-Efficient is used to explore the
relationship between Net Profit and NPAs.
11. Rajkumar Mittal (July 2017) had studied “The
problem of raising Non-Performing Assets in
Banking Sector in India: Comparative Analysis of
Public Sector Banks and Private Sector Banks”. The
objectives are used to find the quantum of NPAs in Public
Sector Banks and Private Sector Banks in India. The
study is primarily analytical and descriptive based on
secondary data collected from RBI Publications,
Journals, Reports, and website annual report of the Public
and Private Sector Banks. Compound Annual Growth is
Loan Borrowed by
an Individual
Have to Repay
within 90 days
Interest Amount
calucalted on basis
from Principal
Amount
Loan Borrowed by
an Individual
Not recovered after
90 days
Non-Performing
Assets
International Journal of Scientific and Research Publications, Volume 9, Issue 4, April 2019 309
ISSN 2250-3153
http://dx.doi.org/10.29322/IJSRP.9.04.2019.p8843 www.ijsrp.org
calculated to identify the percentage increase in NPAs
over the selected period.
III. RESEARCH METHODOLOGY
3.1 Research Design
Analytical Research Design is used for the study. The
research is based on secondary data source available and collected
from various external sources like annual reports, articles, journals
and internet. The Secondary Data are analysed by using various
statistical tools and find the solutions to understand the hypothesis
in each concept of the values.
Analytical Research Design is mainly involves in facts,
figures and variables which can be interpreted and results can be
shown in graphs and diagrams for the future purpose of the
institutions.
3.2 Sources of Data
Data can be defined as the quantitative or qualitative values
of a variable. Data is plural of datum which literally means to give
or something given. Data is thought to be the lowest unit of
information from which other measurements and analysis can be
done. Data can be numbers, images, words, figures, facts or ideas.
Data in itself cannot be understood and to get information from the
data one must interpret it into meaningful information.
There are two types of Data one is Primary data which is
fetched directly from the respondents, collected specially for the
purpose of the study, and also is the original source and is first
handed information. And the other type is Secondary Data are
those data collected by someone else other than the user of those
data, common sources of secondary data for social science include
censuses information collected and published by the government
of India departments, organisational records and data that was
originally collected for other research purposes.
In this study the data is fetched from secondary sources for
the study. Such as the published annual reports, journals, web
portals of the Axis Bank, Federal Bank, IndusInd Bank is used for
the study.
3.3 Tools for Analysis
3.3.1 Trend Analysis
A trend analysis is an aspect of technical analysis that tries
to predict the future movement of a stock based on past data. Trend
analysis is based on the idea that what has happened in the past
gives traders an idea of what will happen in the future. There are
three main types of trends: short-, intermediate- and long-term.
𝑻𝑻𝑻𝑻𝑻𝑻𝑻𝑻𝑻𝑻 𝑨𝑨𝑨𝑨𝑨𝑨𝑨𝑨𝑨𝑨𝑨𝑨𝑨𝑨𝑨𝑨 𝑹𝑹𝑹𝑹𝑹𝑹𝑹𝑹𝑹𝑹 = �
𝑪𝑪𝑪𝑪𝑪𝑪𝑪𝑪𝑪𝑪𝑪𝑪𝑪𝑪𝑪𝑪 𝑽𝑽𝑽𝑽𝑽𝑽𝑽𝑽𝑽𝑽
𝑩𝑩𝑩𝑩𝑩𝑩𝑩𝑩 𝑽𝑽𝑽𝑽𝑽𝑽𝑽𝑽𝑽𝑽
� ∗ 𝟏𝟏𝟏𝟏𝟏𝟏
In Trend Analysis, base value is starts from 100.00% and have to
calculated with Compared Value.
3.3.2 Current Ratio
The current ratio is a liquidity ratio that measures a
company's ability to pay short-term obligations or those due within
one year. It tells investors and analysts how a company can
maximize the current assets on its balance sheet to satisfy its
current debt and other payables.
𝑪𝑪𝑪𝑪𝑪𝑪𝑪𝑪𝑪𝑪𝑪𝑪𝑪𝑪 𝑹𝑹𝑹𝑹𝑹𝑹𝑹𝑹𝑹𝑹 = �
𝑪𝑪𝑪𝑪𝑪𝑪𝑪𝑪𝑪𝑪𝑪𝑪𝑪𝑪 𝑨𝑨𝑨𝑨𝑨𝑨𝑨𝑨𝑨𝑨𝑨𝑨
𝑪𝑪𝑪𝑪𝑪𝑪𝑪𝑪𝑪𝑪𝑪𝑪𝑪𝑪 𝑳𝑳𝑳𝑳𝑳𝑳𝑳𝑳𝑳𝑳𝑳𝑳𝑳𝑳𝑳𝑳𝑳𝑳𝑳𝑳𝑳𝑳
�
A ratio under 1 indicates that the company’s debts due in a year or
less are greater than its assets.
3.3.3 Return on Assets
Return on assets (ROA) is the measure of efficiency and the
profitable a company is relative to its total assets. The Return on
Assets will be used to the financial managers to account the next
year.
𝑹𝑹𝑹𝑹𝑹𝑹𝑹𝑹𝑹𝑹𝑹𝑹 𝑶𝑶𝑶𝑶 𝑨𝑨𝑨𝑨𝑨𝑨𝑨𝑨𝑨𝑨𝑨𝑨 = �
𝑵𝑵𝑵𝑵𝑵𝑵 𝑰𝑰𝑰𝑰𝑰𝑰𝑰𝑰𝑰𝑰𝑰𝑰
𝑻𝑻𝑻𝑻𝑻𝑻𝑻𝑻𝑻𝑻 𝑨𝑨𝑨𝑨𝑨𝑨𝑨𝑨𝑨𝑨𝑨𝑨
� ∗ 𝟏𝟏𝟏𝟏𝟏𝟏
3.3.4 Pearson Correlation Co-Efficient Ratio
Pearson Correlation Co-efficient is used to study the
relationship between Net Profit and Net NPA to understand the
positive growth among the three selected banks. Co-efficient
Values are used to predict the present values and future value
based on two variables. The variables are based on dependent in
one condition and independent in another condition of the
financial years.
𝒓𝒓 =
𝑵𝑵∑𝐱𝐱𝐱𝐱 − (∑𝒙𝒙)(∑𝒚𝒚)
��𝑵𝑵∑𝒙𝒙𝟐𝟐 − (∑𝒙𝒙𝟐𝟐)��𝑵𝑵∑𝒚𝒚𝟐𝟐 − (∑𝒚𝒚𝟐𝟐)�
N – Number of values
∑𝒙𝒙𝒙𝒙 – Sum of two multiplied variables
∑𝒙𝒙 – Sum of total x variable
∑𝒚𝒚 – Sum of total y variable
∑𝒙𝒙𝟐𝟐
- Sum of total squared x variable
∑𝒚𝒚𝟐𝟐
- Sum of total squared y variable
Pearson Correlation Co-efficient is a statistical tool that
calculates the strength of the relationship between the relative
movements of the two variables. The range of values for the
correlation coefficient bounded by 1.0 on an absolute value basis
or between -1.0 to 1.0. If the correlation coefficient is greater than
1.0 or less than -1.0, the correlation measurement is incorrect. A
correlation of -1.0 shows a perfect negative correlation, while a
correlation of 1.0 shows a perfect positive correlation. A
correlation of 0.0 shows zero or no relationship between the
movement of the two variables.
IV. ANALYSIS AND DISCUSSION
4.1 Trend Analysis
4.1.1 To Study the trend of Gross NPA and Net NPA
International Journal of Scientific and Research Publications, Volume 9, Issue 4, April 2019 310
ISSN 2250-3153
http://dx.doi.org/10.29322/IJSRP.9.04.2019.p8843 www.ijsrp.org
Table 4.1.1 Bank wise GNPA
Bank
Name
2013-
14
₹
Crore
2014-
15
₹
Crore
2015-
16
₹
Crore
2016-17
₹ Crore
2018-17
₹ Crore
Axis
Bank
3,146.
41
4,110.
19
6,087.5
1
21,280.
48
34,248.
64
IndusInd
Bank
620.79 562.92 776.82
1,054.8
7
1,704.9
1
Federal
Bank
1,087.
41
1,057.
73
1,667.7
7
1,727.0
5
2,975.6
2
Interpretation
 The value of GNPA is increasing continuously in each
financial year and the GNPA is used to predict the Net
Profit in future values.
Table 4.1.2 Trend GNPA% (in Percentage)
Bank
Name
2013-
14
2014-
15
2015-16 2016-17 2017-18
Axis
Bank
100 130.63 193.47 676.34 1088.49
IndusInd
Bank
100 90.67 125.13 169.92 274.63
Federal
Bank
100 97.27 153.37 158.82 257.08
Interpretation
 Trend Analysis of GNPA in IndusInd Bank and Federal
Bank is showing that the banks are facing trouble on
FY2014-FY2015 is decreased 10% form base year value
and promoting the factors for decrease in Net Profit in
IndusInd Bank and Federal Bank is decreased by 3%
from base year.
 On 2015-16, GNPA values are increased by 25% and
40% in IndusInd Bank and Federal Bank respectively. It
shows that the banks are facing higher Profitability and
less risk return in credit wise transactions.
 In five years, Axis Bank is having more GNPA% of
1088.4% and shows the higher risk in crediting the future
money. And comparing 2017-18 with base year, the ratio
is trending towards 100% increase and having less
profitability.
Chart 4.1.1 Trend GNPA%
Interpretation
 The base year trend analysis percentage is always
100.00%. If the percentage is decreased below 100.00%
it shows that the company is indeed in higher net profit
of that particular year. If it is above 100.00%, then the
company is positively growing in generating net profit.
0
200
400
600
800
1000
1200
2013-14 2014-15 2015-16 2016-17 2017-18
GNPA%
AXIS BANK INDUSIND BANK FEDERAL BANK
International Journal of Scientific and Research Publications, Volume 9, Issue 4, April 2019 311
ISSN 2250-3153
http://dx.doi.org/10.29322/IJSRP.9.04.2019.p8843 www.ijsrp.org
Table 4.1.3 Bank wise Net NPA
Bank
Name
2013-
14
₹
Crore
2014-
15
₹ Crore
2015-
16
₹ Crore
2016-
17
₹ Crore
2018-
17
₹ Crore
Axis
Bank
1,024.
62
1,316.7
1
2,522.1
4
8,626.6
0
16,592.
00
IndusInd
Bank
184.5 210.48 321.75 438.90 745.67
Federal
Bank
321.56 373.27 950.01 941.20
1,551.9
6
Interpretation
 In Federal Bank, the FY2016-FY2017 is showing the Net
NPA ₹941.20 Crores is decreased from the previous year
FY2015-FY2016. It shows that the company is relaxed at
the financial year and decreased their risk of returns to
promotes more profitability.
Table 4.1.4 Trend NNPA%
Bank
2013-
14
2014-
15
2015-
16
2016-
17
2017-
18
Axis
Bank
100 128.50 246.15 841.93
1619.3
3
IndusInd
Bank
100 114.36 174.81 238.46 405.14
Federal
Bank
100 116.08 295.43 292.69 482.63
Interpretation
 FY2016-FY2017 is analyzed as 3% decrease from
FY2015-FY2016 and shows the value ₹9 crores
approximately decreased from ₹950 crores and having
more profitability in the current year.
 In FY2017-FY2018 shows that Axis Bank is having more
Net NPA has highest value ₹16,592 Crores and with
trend ratio of 1619.33% and shows the tremendous
growth when compared to previous year and in higher
risks factors.
 Among three banks, IndusInd Bank is rapidly growing in
NNPA% by 14%, 60%, 60%, 200% from the base
financial year. The 200% growth in NNPA ratio is shows
the NPA values are dominating the current Net Profit
Value of the Bank.
Chart 4.1.2 Trend of NNPA%
0
200
400
600
800
1000
1200
1400
1600
1800
2013-14 2014-15 2015-16 2016-17 2017-18
NNPA%
AXIS BANK INDUSIND BANK FEDERAL BANK
International Journal of Scientific and Research Publications, Volume 9, Issue 4, April 2019 312
ISSN 2250-3153
http://dx.doi.org/10.29322/IJSRP.9.04.2019.p8843 www.ijsrp.org
Interpretation
 On comparing three banks Trend Ratio of FY2017-
FY2018 is shows that IndusInd Bank is having lesser
ratio 405.1% and next to Federal Bank, 482.6% and Axis
Bank is placing more trend ratio value of 1619.3% and
having more NPA values in five years.
4.1.2 Current Ratio
Table 4.1.5 Current Ratio
Bank Name
2013-14
₹ Crore
2014-15
₹ Crore
2015-16
₹ Crore
2016-17
₹ Crore
2017-18
₹ Crore
Axis Bank 6.82 6.29 7.68 10.34 9.21
IndusInd Bank 0.43 0.26 0.21 0.36 0.53
Federal Bank 6.61 4.88 6.84 6.24 6.23
Interpretation
 In Five Financial years, IndusInd Bank is facing the
major issues in distributing the current assets in each year
and the bank is incapable in organizing the assets when
to compared to other provisions. The ratio rate below 1 is
considered for the major disturbance in the financial
years.
 The negative balance in the current ratio is showing that
IndusInd Bank have to prepared for less liability in all
consecutive years.
 Axis Bank, shows the ratio of 10.34 in 2016-17 as a
positive one and company is good in maintaining the
assets and other provisions in all years Axis Bank is
stable in current ratio as the company is strengthened in
five financial years and the ratio rates are higher than 6.
 Federal Bank is also good in maintaining the current ratio
of each five consecutive years. The ratio resembles on
Axis Bank and Federal Bank is good for the organization
and may provide the internal funds to the organization.
Chart 4.1.3 Current Ratio
0
2
4
6
8
10
12
2013-14
Rs. Crore
2014-15
Rs. Crore
2015-16
Rs. Crore
2016-17
Rs. Crore
2017-18
Rs. Crore
Current Ratio
Axis Bank Federal Bank IndusInd Bank
Linear (Axis Bank) Linear (Federal Bank) Linear (IndusInd Bank)
International Journal of Scientific and Research Publications, Volume 9, Issue 4, April 2019 313
ISSN 2250-3153
http://dx.doi.org/10.29322/IJSRP.9.04.2019.p8843 www.ijsrp.org
Interpretation
 Linear Trend is used in the current ratio to describe the
bank’s short-term obligations in meeting their needs in
each consecutive financial year.
 Trend Line of Axis Bank is showing the continuous
increase in associating the company assets and their
short-term debt paying in year ended. Axis Bank is over
the trend line in 2016-17 and their assets value is highly
increased, and liabilities of that year is decreased and can
increase internal provisions for the next working capital
2017-18.
 Trend Line of IndusInd Bank is straight in organizing the
assets and liabilities without any increased in the current
ratio and the bank can do the moderate changes in the
financial years.
 Federal Bank is also associating the same trend line in
current ratio and the bank is stable in solvent among the
assets and liabilities in each year.
4.1.3 Return on Assets
Table 4.1.6 Return On Assets (ROA) %
Bank Name 2013-14 2014-15 2015-16 2016-17 2017-18
Axis Bank 1.62 1.59 1.56 0.61 0.03
IndusInd Bank 1.61 1.64 1.63 1.6 1.62
Federal Bank 1.12 1.21 0.52 0.72 0.63
Interpretation
 ROA of Axis Bank
is decreasing in all
five years And
IndusInd Bank is
following the same
ROA in all financial
years. Axis Bank’s
Performance is
decreasing in each
year and reaches
0.03% in 2017-18,
shows that the bank
is suitable for
investor and
shareholders to
invest the shares.
 IndusInd Bank’s
Performance is
moderate and the
percentage in each
year is 1.6% and
shows the bank is
good in investing the
shares and
shareholders to
promote new shares
in the industry when
compared to Federal
Bank and Axis
Bank.
 In 2017-18, Axis
Bank is performing
the lowest ROA
among banks as it
holds 0.03% and
next to Axis Bank,
Federal Bank is
having 0.63% and
IndusInd Bank holds
1.62% and showing
IndusInd Bank is
having essential Net
Income and have
stable investors.
 In 2013-14, Axis
Bank and IndusInd
Bank is having the
same percentage in
ROA and showing
the same investors
and shareholders on
that particular year.
It makes the two
banks become more
competitive in the
net profit and assets
equality.
International Journal of Scientific and Research Publications, Volume 9, Issue 4, April 2019 314
ISSN 2250-3153
http://dx.doi.org/10.29322/IJSRP.9.04.2019.p8843 www.ijsrp.org
Chart 4.1.4 Return On Assets (ROA) %
Interpretation
 Trend Line of Axis Bank and Federal Bank is decreasing
for the five financial years. Axis Bank is facing the major
issue in ROA and doesn’t maintains the shareholding
partners and investor to promote the shares for the next
consecutive years.
 Trend Line indicates that IndusInd Bank is good in
understand the shareholding pattern in achieving the
relations between investors in Profit and assets
equality.4.2 Pearson Correlation Co-efficient
4.2.1 To test the relationship between Net NPA and Net Profit
of Axis Bank.
Negative Hypothesis: There is negative relationship and
indicates the company is decreasing in one variable of the selected
variables for the values is below -1.
Null Hypothesis: The relationship between two variables
are same and the co-efficient ratios are equal to understand the
values are consistent when exactly 0.
Positive Hypothesis: There is positive relationship and
indicates that the values is increasing in one dependent variable of
the selected variable for the values is above +1.
Table 4.2.1 Comparing Net NPA and Net Profit of Axis Bank
Bank Particulars
2013-14
₹ Crores
2014-15
₹ Crores
2015-16
₹ Crores
2016-17
₹ Crores
2017-18
₹ Crores
Axis
Bank
NET NPA 1,024.62 1,316.71 2,522.14 8,626.60 16,592.0
NET PROFIT 6217.67 7357.82 8223.66 3,679.28 275.68
Interpretation
 Net profit of Axis Bank is continuously decreasing from
financial year 2015-16 to 2017-18 and marked up with
lowest Net Profit as ₹257.68 Crores and reflects more
NPAs in the five years. This condition may bring heavy
losses to the bank and may decrease net profit for future
years also.
 Net NPA of Axis Bank is increasing for all five years and
reaches the value of ₹16,592 Crores in 2017-18. The Net
NPA of Axis Bank is stable in increase and bank have to
take remedial measures on clearing those funds.
0
0.5
1
1.5
2
2.5
2013-14 2014-15 2015-16 2016-17 2017-18
Return On Assets (ROA) %
Axis Bank Federal Bank IndusInd Bank
Linear (Axis Bank) Linear (Federal Bank) Linear (IndusInd Bank)
International Journal of Scientific and Research Publications, Volume 9, Issue 4, April 2019 315
ISSN 2250-3153
http://dx.doi.org/10.29322/IJSRP.9.04.2019.p8843 www.ijsrp.org
Table 4.2.2 Pearson Correlation Co-efficient of Axis Bank
Bank Particulars
2013-14
₹ Crores
2014-15
₹ Crores
2015-16
₹ Crores
2016-17
₹ Crores
2017-18
₹
Crores
Ratio
Axis
Bank
NET NPA 1,024.6 1,316.7 2,522.1 8,626.6 16,592.0
-0.95
NET PROFIT 6217.67 7357.82 8223.66 3,679.2 275.68
Interpretation
 As Axis Bank is facing major issues in Net NPA
increasing for the five financial years, the bank’s
correlated ratio is -0.95 and the ratio is negative in
relationships and shows that Net NPA and Net Profit is
not related as Net NPA is increasing constantly and Net
Profit is less when compared with Net NPA.
 In financial years 2013-14, 2014-15, 2015-16 shows that
Axis Bank is maintaining the Net Profit as it requires to
performing the Bank assets and other internal provisions
while the Net Profit is also increasing in other side.
 In financial years, 2017-18 Axis Bank faces its
dramatical change in Net Profit and Net NPA is increased
by ₹ 8,626.6 Crores and the NPAs is peeked in that year
and tends to increase by ₹ 16,592 Crores and Axis Bank
is in unexpected issues to control and monitor the funds.
Chart 4.2.1 Comparing Net NPA and Net Profit of Axis Bank
Interpretation
 In 2017-18, Axis Bank Net NPA is increased drastically
and making the bank to suffer in upcoming financial
years. Increase in Net NPA is not good for the Bank as it
decreases the profitability for the following years.
 The Ratio -0.95 is showing the negative relationship
between Net NPA and Net Profit for all five financial
years. The Line express the relations associated with the
Net NPA and Net Profit of Axis Bank.
 The Negative Relationship existing in Axis Bank leads to
decrease in stock investors, lesser profitability and can’t
exists the following financial years to promote the
budgets and the banking performance throughout the
financial years.
4.2.2 To test the relationship between Net NPA and Net Profit
of IndusInd Bank
Negative Hypothesis: There is negative relationship and
indicates the company is decreasing in one variable of the selected
variables for the values is below -1.
1,024.62
1,316.71
2,522.14
8,626.60
16,592.00
-0.953813262
6217.67
7357.82
8223.66
3,679.28
275.68
2013-14
₹ Crore
2014-15
₹ Crore
2015-16
₹ Crore
2016-17
₹ Crore
2017-18
₹ Crore
Ratio
Net NPA and Net Profit with Correlated Ratio
Axis Bank NET NPA Axis Bank NET PROFIT
International Journal of Scientific and Research Publications, Volume 9, Issue 4, April 2019 316
ISSN 2250-3153
http://dx.doi.org/10.29322/IJSRP.9.04.2019.p8843 www.ijsrp.org
Null Hypothesis: The relationship between two variables
are same and the co-efficient ratios are equal to understand the
values are consistent when exactly 0.
Positive Hypothesis: There is positive relationship and
indicates that the values is increasing in one dependent variable of
the selected variable for the values is above +1.
Table 4.2.3 Comparing Net NPA and Net Profit of IndusInd Bank
Bank Particulars
2013-14
₹ Crore
2014-15
₹ Crore
2015-16
₹ Crore
2016-17
₹ Crore
2017-18
₹ Crore
IndusInd
Bank
NET NPA 184.05 210.48 321.75 438.9 745.67
NET PROFIT 1,408.02 1,793.72 2,286.45 2,867.89 2,978.89
Interpretation
 On interpreting IndusInd Bank Net NPA and Net Profit
the bank is having Increasing factors for both the cases.
Increased Net Profit and Increasing Net Profit is
maintaining the Bank performance consistent and
achieve their internal operations.
 While increase in Net Profit is a good sign for the Bank
and can increase more shareholders and investors in their
shares. On the same while, Net NPA is increasing in each
year is also acting as a barrier for the bank’s growth in
each year.
 The Net Profit which is earned by the bank is fully in
depositing against the Bad Loans acquired by the Bank
and it is highest NPA of ₹ 745.67 Crores and the Net
Profit is ₹ 2,978.89 Crores which takes the bank to stable
and constant in acquiring the good position in Banking
Industry.
Table 4.2.4 Pearson Correlation Co-Efficient of
IndusInd Bank
Ba
nk
Partic
ulars
2013
-14
₹
Cror
es
2014
-15
₹
Cror
es
2015-
16
₹
Cror
es
2016
-17
₹
Cror
es
2017
-18
₹
Cror
es
Ra
tio
Ind
us
-Ind
Ban
k
NET
NPA
184.0
5
210.
48
321.7
5
438.
9
745.6
7
0.8
8
NET
PROFI
T
1,408
.0
1,79
3.7
2,286
.4
2,86
7.8
2,978
.8
Interpretation
 The correlation ratio of IndusInd Bank is 0.88 and it
shows the positive relationship between Net NPA and
Net Profit for the all consecutive financial years. The
Positive Relationship for the banks is reflecting the
strong management and the organization of funds in each
sector wise distribution of loans.
 IndusInd Bank performance is measured with its positive
relationship among Net NPA and Net Profit. In this case,
the Net NPA values is also increasing the factors and
raising the bank to regulate the movement of NPAs
among different sectors and their sources of funds.
 While considering the Net Profit of 2015-16 and 2016-17
is slightly increased and the bank is facing with higher
NPA of ₹ 438.9 Crores which shows that the bank is lite
unstable conditions but however the bank is organized by
the essential funds on that particular year.
International Journal of Scientific and Research Publications, Volume 9, Issue 4, April 2019 317
ISSN 2250-3153
http://dx.doi.org/10.29322/IJSRP.9.04.2019.p8843 www.ijsrp.org
Chart 4.2.2 Comparing Net NPA and Net Profit of IndusInd Bank
Interpretation
 On interpreting the IndusInd Bank is facing more Net
Profit when compared to Net NPAs and this is the major
factor for IndusInd Bank is to maintain the greater
management and the sources of funds among the
industrial sectors.
 Positive relationship is acquired with 0.88 as Net NPA is
lower when compared to Net Profit acquired by the banks
each year.
 Higher Profitability shows that the bank is leading in
acquiring new customers and other benefits in new
customer avail facility for the branches in urban and rural
areas. This Profitability can increase the goodwill among
the investors and shareholders to place a god shares in the
market place and can increase the sales of the bank.
2.3 To test the relationship between Net NPA and Net Profit of
Federal Bank
Negative Hypothesis: There is negative relationship and
indicates the company is decreasing in one variable of the selected
variables for the values is below -1.
Null Hypothesis: The relationship between two variables
are same and the co-efficient ratios are equal to understand the
values are consistent when exactly 0.
Positive Hypothesis: There is positive relationship and
indicates that the values is increasing in one dependent variable of
the selected variable for the values is above +1.
Table 4.2.5 Comparing Net NPA and Net Profit of Federal Bank
Bank Particulars
2013-14
₹ Crore
2014-15
₹ Crore
2015-16
₹ Crore
2016-17
₹ Crore
2017-18
₹ Crore
Federal
Bank
NET NPA 321.56 373.27 950.01 941.2 1551.96
NET PROFIT 838.89 1,005.75 475.65 830.79 878.85
Interpretation
 Federal Bank is facing the major issues in the financial
year 2017-18 as Net NPA value is higher than Net Profit
Value and seeks the highest NPA of ₹ 1551.96 Crores
which is higher in the five financial years and NPA is
continuously increasing from the base year 2013-14.
 On interpreting the Net Profit of Federal Bank, the bank
is facing again problem with constant increase and
decrease in the profitability of banks. In financial year
2015-16 the bank is reached its lowest profit of ₹ 475.65
crores when compared with other financial years.
184.05
210.48
321.75
438.9
745.67
0.880918223
1,408.02
1,793.72
2,286.45
2,867.89
2,978.89
2013-14
₹ Crore
2014-15
₹ Crore
2015-16
₹ Crore
2016-17
₹ Crore
2017-18
₹ Crore
Ratio
Net NPA and Net Profit with Correlated Ratio
IndusInd Bank NET NPA IndusInd Bank NET PROFIT
International Journal of Scientific and Research Publications, Volume 9, Issue 4, April 2019 318
ISSN 2250-3153
http://dx.doi.org/10.29322/IJSRP.9.04.2019.p8843 www.ijsrp.org
 In financial year 2015-16, the bank faces major issues by
increased in NPA and decrease in Net Profit and makes
the banks more unstable and the performance is again
measured to be low in handling the bad loans to the
vendors and borrowers.
Table 4.2.6 Pearson Correlation Co-efficient of Federal
Bank
Bank Particular
2013-14
₹ Crore
2014-15
₹ Crore
2015-16
₹ Crore
2016-17
₹ Crore
2017-18
₹ Crore
Ratio
Federal
Bank
NET
NPA
321.5 373.27 950.0 941.2 1551.9 -0.23
NET
PROFIT
838.8 1,005.7 475.6 830.7
Interpretation
 Federal Bank’s correlated ratio of Net NPA and Net
Profit is -0.23, which reflects the bank is negative
relationship in NPA and Profit. The negative relationship
is unstable and the bank efficiency in providing the funds
and money to other transfer is impossible in accessing the
Bad loans.
 Net NPA and Net Profit is resembling the major part of a
bank, in Federal Bank both factors are below in ratio to
its lesser profitability and the bank is to take remedial
measures in control the unorganized funds and loans to
the borrowers.
 On Interpreting Federal Bank is facing the decreasing
values in both Net NPA and Net Profit. The Bank is
weaker in assets and other provisions on looking the
relationship is lower in each financial year.
Chart 4.2.3 Comparing Net NPA and Net Profit of Federal Bank
Interpretation
 On interpreting the Federal Bank with Net NPA and
Net NPA for the correlation is taken with the
negative relationship of -0.23 and lesser profitability
in each sector for the bad loans.
 In financial year 2013-14 and 2014-15, the Bank is
good in maintaining the profit and Net NPA with less
credit wise exposures and more profitability in that
financial years for the bank performance is good but
the bank is aided in at the financial years 2016-17
and 2017-18 as Net NPA values are dominating Net
Profit.
 Federal Bank is unstable and the operating expenses
is also done in the lesser providence of the profit and
the major issues are not maintain the organization to
plan on next financial year structure to earn profit
and to dominate the NPAs from borrowers and to
increase shareholders.
321.56
373.27
950.01
941.2
1551.96
-0.231792149
838.89
1,005.75
475.65
830.79
878.85
2013-14
₹ Crore
2014-15
₹ Crore
2015-16
₹ Crore
2016-17
₹ Crore
2017-18
₹ Crore
Ratio
Net NPA and Net Profit with Correlated Ratio
Federal Bank NET NPA Federal Bank NET PROFIT
International Journal of Scientific and Research Publications, Volume 9, Issue 4, April 2019 319
ISSN 2250-3153
http://dx.doi.org/10.29322/IJSRP.9.04.2019.p8843 www.ijsrp.org
4.2.4 To measure the effect of NPA in Selected Private Sector Banks Performance
Table 4.2.7 Pearson Correlation Coefficient Ratio
Bank Name Correlation Coefficient Ratio
Axis Bank -0.95
IndusInd Bank 0.88
Federal Bank -0.23
Interpretation
 Correlation ratio of IndusInd Bank is showing the
positive relationship among the NPA and Profitability of
bank. The Positive ratio finalize that IndusInd bank is
more stable in acquiring profit and funds in each sectors
of the loan distributions.
 Federal Bank is next to IndusInd Bank in correlation
ratio, but it is negative relationship of -0.23 and bank
have to be stable and to acquire more profit in associates
the funds in each sector and the funding positions of the
bank.
 Axis Bank is the least negative ratio of -0.95 and facing
the major issues in the profit and bank is in condition of
loss in each year. The Bank have to take immediate
measure in each sectoral sourcing funds and have to take
decisions in expenditure to be followed in the
organizational functions.
Chart 4.2.4 Pearson Correlation Co-efficient Ratio
Interpretation
 IndusInd Bank is getting Positive Ratio in Correlation
Co-efficient and shows the consistent growth in
generating net profit and maintain the NPAs values. Next
to IndusInd Bank, Federal Bank and Axis Bank is getting
negative values in NPA.
 IndusInd Bank is showing the positive Hypothesis as it
shows the value above 0. The bank is ready to accept the
net profit and net gains in understanding the values and
functions for increasing the net profits for next year.
 The Negative Hypothesis is again hit the Federal Bank
by showing value of -0.23. The negative values indicate
slight difference to make the positive hypothesis. The
Bank has to work on Net Profit and to recover NPA to
achieve again success in the future financial years.
-0.95
0.88
-0.23
-1.5
-1
-0.5
0
0.5
1
Axis Bank IndusInd Bank Federal Bank
Pearson Correlation Co-Efficient
International Journal of Scientific and Research Publications, Volume 9, Issue 4, April 2019 320
ISSN 2250-3153
http://dx.doi.org/10.29322/IJSRP.9.04.2019.p8843 www.ijsrp.org
V. FINDINGS AND SOLUTIONS
5.1 Findings of the Study
 Non-Performing Assets (NPA) is the major causes
of each bank and every financial institution. In
selected private sector banks, Axis Bank, Federal
Bank, IndusInd Bank is having their Net NPA values
of ₹30,082.07 crores, ₹4138 crores, ₹1900.85 crores
respectively.
 The total NPA of three banks is evaluated as
₹36,20.92 crores. The NPA of these three banks is
occupying the major NPA values of the private
sector banks as market sales and recovery of funds.
 The Net Profit and Net NPA is compared in
correlation co-efficient ratio to find the comparison
among the three selected banks. The ratio is provided
with Null Hypothesis and Positive Hypothesis in the
three banks.
 The expected positive results are changed, by Axis
Bank is having the negative hypothesis of -0.9538%.
These co-efficient ratio shows that Axis Bank is
indeed of getting decreased Net Profit and it
reflected as Net Profit of ₹275.68 Crores in 2017-18
with Net NPA of ₹16,592 crores which is doubled of
Net Profit.
 IndusInd Bank is showing the consistent growth in
all five years and the growth is indicating the
positive hypothesis of 0.8502%. The bank receives
the increasing Net Profit as it indicates in Annual
Reports.
 This shows that the bank stable in organizing the
funds to organizational sectors. In other hand the Net
NPA is also increasing for the five years, ₹184.05
crores in 2013-14, ₹214.08 crores in 2014-15,
₹321.75 crores in 2015-16, ₹438.9 crores in 2016-17
and ₹745.67 in 2017-18. This increasing factor of
Net NPA will decrease the increasing Net Profit of
Banks and may leads to loss in future.
 Federal Bank is funded with Negative Hypothesis of
-0.2317. The Net NPA and Net Profit of this bank is
fluctuating in all consecutive five years. This shows
that the bank is unstable and should be positioned in
the upcoming financial years.
5.2 Suggestions
The management of NPAs is a very challenging task. It
requires Preventive measures as well as Curative measures i.e.
banks should not only take steps to reduce the present NPAs but
also take precaution to avoid future NPAs. Preventive measures
include,
 Inculcating ethics in borrowers regarding the
importance of timely repayment of credit.
 Adherence of proper credit appraisal techniques.
 Proper evaluation of projects.
 Timely sanction and disbursement of credit.
 Proper credit monitoring to restrict any misuse and
diversion of fund.
 assisting borrowers in developing entrepreneurial
skill.
 Follow up of SLP (security, liquidity and
profitability) principle
VI. CONCLUSION
On concluding three private sector banks for the
comparative is based on the sales report and their market values in
the banking sectors. The Trend Analysis is used to analysed the
GNPA and NNPA factors that are affecting the banking natures.
The Correlation effect is compared between three banks and the
hypothesis funded with IndusInd Bank is good in recovering the
NPA and maintains their Net Profit and can move with the positive
outgrowth for next financial years. NPA is the main artery vein of
banking sector and other financial institutions to maintain the
economy as a growing factors and to increase the country’s
profitability.
REFERENCES
Books
[1] An Introduction to Statistical Learning by Gareth James.
[2] Statistics and Data Analysis for Financial Engineering: With R Examples by
David Ruppert and David S. Matteson.
Websites
[3] http://campaign.axisbank.com/2018/june/index.html
[4] https://www.federalbank.co.in/documents/10180/12548116/Annual+Report
+2017-18/582f8313-08ff-4931-b0b3-1e72b045b16c
[5] https://www.indusind.com/content/dam/indusind/AnnualReports/2017-
18/2017-18/Indusind-AR2018_R1
AUTHORS
First Author – Numer P, III - BBA(CA), Sri Krishna Arts and
Science College, Coimbatore, numer1301@gmail.com
Second Author – Devika P, Assistant Professor, Sri Krishna
Arts and Science College, Coimbatore,
pdevikasabari@gmail.com
Correspondence Author – Numer P, numer1301@gmail.com,
numerp16bba229@skasc.ac.in, +91 93856 55606

More Related Content

What's hot

Summer training project report r
Summer training project report rSummer training project report r
Summer training project report r
Dhanlal
 
AN OVERVIEW OF CSR ACTIVITIES BEING PEROFRMED BY FEDERAL BANK LIMITED
AN OVERVIEW OF CSR ACTIVITIES BEING PEROFRMED BY FEDERAL BANK LIMITED AN OVERVIEW OF CSR ACTIVITIES BEING PEROFRMED BY FEDERAL BANK LIMITED
AN OVERVIEW OF CSR ACTIVITIES BEING PEROFRMED BY FEDERAL BANK LIMITED
VARUN KESAVAN
 
Summer internship report submitted to State Bank of India on the topic - “Yo...
Summer internship report submitted to State Bank of India on the topic -  “Yo...Summer internship report submitted to State Bank of India on the topic -  “Yo...
Summer internship report submitted to State Bank of India on the topic - “Yo...
Deepanjan Das
 
Banking Project
Banking ProjectBanking Project
Banking Project
touseefbhat87
 
Summer Internship Report 2019 ppt
Summer Internship Report 2019 pptSummer Internship Report 2019 ppt
Summer Internship Report 2019 ppt
mayank mulchandani
 
Mba project report_on_hdfc_bank
Mba project report_on_hdfc_bankMba project report_on_hdfc_bank
Mba project report_on_hdfc_bank
Sourab Kesar
 
A project report on SBI bank
A project report on SBI bankA project report on SBI bank
A project report on SBI bank
Bhavik Parmar
 
Internship report @ dhanlaxmi bank ltd
Internship report @ dhanlaxmi bank ltdInternship report @ dhanlaxmi bank ltd
Internship report @ dhanlaxmi bank ltd
Srikanth Balakrishnan
 
Axis bank retail banking
Axis bank retail bankingAxis bank retail banking
Axis bank retail banking
Ketan Gyanchandani
 
Union Bank Of India , its Mergers and NPA
Union Bank Of India , its Mergers and NPA Union Bank Of India , its Mergers and NPA
Union Bank Of India , its Mergers and NPA
DEVASHISH KASHYAP
 
A Final Project Report on SBI Strategic Perfomance"
A Final Project Report on SBI Strategic Perfomance"A Final Project Report on SBI Strategic Perfomance"
A Final Project Report on SBI Strategic Perfomance"
Jawid Joya
 
Comparative Analysis of saving Accounts of different Banks
Comparative Analysis of saving Accounts of different BanksComparative Analysis of saving Accounts of different Banks
Comparative Analysis of saving Accounts of different Banks
Manoj1947
 
Comparative Study of SBI and PNB Bank
Comparative Study of SBI  and PNB BankComparative Study of SBI  and PNB Bank
Comparative Study of SBI and PNB Bank
Sany Ambilwade
 
Vedansh Project
Vedansh ProjectVedansh Project
Vedansh Project
vedansh
 
Job satisfaction @ sbi project report mba hr
Job satisfaction @ sbi project report mba hrJob satisfaction @ sbi project report mba hr
Job satisfaction @ sbi project report mba hr
Babasab Patil
 
state Bank of India
state Bank of Indiastate Bank of India
state Bank of India
karan patel
 
Project on SBI
Project on SBIProject on SBI
Project on SBI
Deepak Soni
 
SBI COMPANY ANALYSIS REPORT
SBI COMPANY ANALYSIS REPORTSBI COMPANY ANALYSIS REPORT
SBI COMPANY ANALYSIS REPORT
ailapuramanil
 
Sbi banking
Sbi bankingSbi banking
Sbi banking
Rajan Nath
 
Gp consumer behaviour for third party at private banks
Gp   consumer behaviour for third party at private banksGp   consumer behaviour for third party at private banks
Gp consumer behaviour for third party at private banks
jitharadharmesh
 

What's hot (20)

Summer training project report r
Summer training project report rSummer training project report r
Summer training project report r
 
AN OVERVIEW OF CSR ACTIVITIES BEING PEROFRMED BY FEDERAL BANK LIMITED
AN OVERVIEW OF CSR ACTIVITIES BEING PEROFRMED BY FEDERAL BANK LIMITED AN OVERVIEW OF CSR ACTIVITIES BEING PEROFRMED BY FEDERAL BANK LIMITED
AN OVERVIEW OF CSR ACTIVITIES BEING PEROFRMED BY FEDERAL BANK LIMITED
 
Summer internship report submitted to State Bank of India on the topic - “Yo...
Summer internship report submitted to State Bank of India on the topic -  “Yo...Summer internship report submitted to State Bank of India on the topic -  “Yo...
Summer internship report submitted to State Bank of India on the topic - “Yo...
 
Banking Project
Banking ProjectBanking Project
Banking Project
 
Summer Internship Report 2019 ppt
Summer Internship Report 2019 pptSummer Internship Report 2019 ppt
Summer Internship Report 2019 ppt
 
Mba project report_on_hdfc_bank
Mba project report_on_hdfc_bankMba project report_on_hdfc_bank
Mba project report_on_hdfc_bank
 
A project report on SBI bank
A project report on SBI bankA project report on SBI bank
A project report on SBI bank
 
Internship report @ dhanlaxmi bank ltd
Internship report @ dhanlaxmi bank ltdInternship report @ dhanlaxmi bank ltd
Internship report @ dhanlaxmi bank ltd
 
Axis bank retail banking
Axis bank retail bankingAxis bank retail banking
Axis bank retail banking
 
Union Bank Of India , its Mergers and NPA
Union Bank Of India , its Mergers and NPA Union Bank Of India , its Mergers and NPA
Union Bank Of India , its Mergers and NPA
 
A Final Project Report on SBI Strategic Perfomance"
A Final Project Report on SBI Strategic Perfomance"A Final Project Report on SBI Strategic Perfomance"
A Final Project Report on SBI Strategic Perfomance"
 
Comparative Analysis of saving Accounts of different Banks
Comparative Analysis of saving Accounts of different BanksComparative Analysis of saving Accounts of different Banks
Comparative Analysis of saving Accounts of different Banks
 
Comparative Study of SBI and PNB Bank
Comparative Study of SBI  and PNB BankComparative Study of SBI  and PNB Bank
Comparative Study of SBI and PNB Bank
 
Vedansh Project
Vedansh ProjectVedansh Project
Vedansh Project
 
Job satisfaction @ sbi project report mba hr
Job satisfaction @ sbi project report mba hrJob satisfaction @ sbi project report mba hr
Job satisfaction @ sbi project report mba hr
 
state Bank of India
state Bank of Indiastate Bank of India
state Bank of India
 
Project on SBI
Project on SBIProject on SBI
Project on SBI
 
SBI COMPANY ANALYSIS REPORT
SBI COMPANY ANALYSIS REPORTSBI COMPANY ANALYSIS REPORT
SBI COMPANY ANALYSIS REPORT
 
Sbi banking
Sbi bankingSbi banking
Sbi banking
 
Gp consumer behaviour for third party at private banks
Gp   consumer behaviour for third party at private banksGp   consumer behaviour for third party at private banks
Gp consumer behaviour for third party at private banks
 

Similar to Npa

The financial failure of PMC Bank
 The financial failure of PMC Bank The financial failure of PMC Bank
The financial failure of PMC Bank
sargunpreetkaur3
 
Credit Risk Management- SBI
Credit Risk Management- SBICredit Risk Management- SBI
Credit Risk Management- SBI
Pavithra Puthumathiyan
 
Project synopsis dena bank
Project synopsis dena bankProject synopsis dena bank
Project synopsis dena bank
Mrinal Kalita
 
J&K Bank
J&K BankJ&K Bank
J&K Bank
iqbalwani2
 
Current & Future challenges of banking sector in bd(DBBL)
Current & Future challenges of banking sector in bd(DBBL)Current & Future challenges of banking sector in bd(DBBL)
Current & Future challenges of banking sector in bd(DBBL)
University of Dhaka
 
Summer Internship Report 2019
Summer Internship Report 2019Summer Internship Report 2019
Summer Internship Report 2019
mayank mulchandani
 
A STUDY OF VARIOUS TYPES OF LOANS OF SELECTED PUBLIC AND PRIVATE SECTOR BANKS...
A STUDY OF VARIOUS TYPES OF LOANS OF SELECTED PUBLIC AND PRIVATE SECTOR BANKS...A STUDY OF VARIOUS TYPES OF LOANS OF SELECTED PUBLIC AND PRIVATE SECTOR BANKS...
A STUDY OF VARIOUS TYPES OF LOANS OF SELECTED PUBLIC AND PRIVATE SECTOR BANKS...
IAEME Publication
 
Study on banking sector
Study on banking sectorStudy on banking sector
Study on banking sector
nidhislides2213
 
Current and future challenges of banking sector- report on DBBL
Current and future challenges of banking sector- report on DBBLCurrent and future challenges of banking sector- report on DBBL
Current and future challenges of banking sector- report on DBBL
University of Dhaka
 
Comparative Analysis of Saving accounts of different Banks
Comparative Analysis of Saving accounts of different BanksComparative Analysis of Saving accounts of different Banks
Comparative Analysis of Saving accounts of different Banks
Manoj1947
 
Credit Risk Management on Bank of Baroda.docx
Credit Risk Management on Bank of Baroda.docxCredit Risk Management on Bank of Baroda.docx
Credit Risk Management on Bank of Baroda.docx
Vishal Doke
 
Project+on+hdfc
Project+on+hdfcProject+on+hdfc
Project+on+hdfc
sahitisrija
 
A project report on credit risk @ sbi project report mba finance By Babasab ...
A project report on credit risk  @ sbi project report mba finance By Babasab ...A project report on credit risk  @ sbi project report mba finance By Babasab ...
A project report on credit risk @ sbi project report mba finance By Babasab ...
Babasab Patil
 
A STUDY ON LOANS AND ADVANCES PROVIDED BY THE INDIAN BANK ZONAL OFFICE, TRICHY
A STUDY ON LOANS AND ADVANCES PROVIDED BY THE INDIAN BANK ZONAL OFFICE, TRICHYA STUDY ON LOANS AND ADVANCES PROVIDED BY THE INDIAN BANK ZONAL OFFICE, TRICHY
A STUDY ON LOANS AND ADVANCES PROVIDED BY THE INDIAN BANK ZONAL OFFICE, TRICHY
IAEME Publication
 
Sm project gp6
Sm project gp6Sm project gp6
Sm project gp6
Aishwarya Alagh
 
1928100581_ BBA_ LAXMI VERMA.pdf
1928100581_ BBA_ LAXMI VERMA.pdf1928100581_ BBA_ LAXMI VERMA.pdf
1928100581_ BBA_ LAXMI VERMA.pdf
ManishRathore83
 
1928100581_ BBA_ LAXMI VERMA.pdf
1928100581_ BBA_ LAXMI VERMA.pdf1928100581_ BBA_ LAXMI VERMA.pdf
1928100581_ BBA_ LAXMI VERMA.pdf
ManishRathore83
 
Lokesh_BBA_Project_on_Axis_Bank_Pvt_ltd20200403-114304-w6vuuq.pdf
Lokesh_BBA_Project_on_Axis_Bank_Pvt_ltd20200403-114304-w6vuuq.pdfLokesh_BBA_Project_on_Axis_Bank_Pvt_ltd20200403-114304-w6vuuq.pdf
Lokesh_BBA_Project_on_Axis_Bank_Pvt_ltd20200403-114304-w6vuuq.pdf
tangadeH
 
A Comparative study of the Financial Performance of the Axis Bank Ltd & ICICI...
A Comparative study of the Financial Performance of the Axis Bank Ltd & ICICI...A Comparative study of the Financial Performance of the Axis Bank Ltd & ICICI...
A Comparative study of the Financial Performance of the Axis Bank Ltd & ICICI...
AsmitaMali3
 
Gp consumer behaviour for third party at private banks
Gp   consumer behaviour for third party at private banksGp   consumer behaviour for third party at private banks
Gp consumer behaviour for third party at private banks
Hardik Sorathiya
 

Similar to Npa (20)

The financial failure of PMC Bank
 The financial failure of PMC Bank The financial failure of PMC Bank
The financial failure of PMC Bank
 
Credit Risk Management- SBI
Credit Risk Management- SBICredit Risk Management- SBI
Credit Risk Management- SBI
 
Project synopsis dena bank
Project synopsis dena bankProject synopsis dena bank
Project synopsis dena bank
 
J&K Bank
J&K BankJ&K Bank
J&K Bank
 
Current & Future challenges of banking sector in bd(DBBL)
Current & Future challenges of banking sector in bd(DBBL)Current & Future challenges of banking sector in bd(DBBL)
Current & Future challenges of banking sector in bd(DBBL)
 
Summer Internship Report 2019
Summer Internship Report 2019Summer Internship Report 2019
Summer Internship Report 2019
 
A STUDY OF VARIOUS TYPES OF LOANS OF SELECTED PUBLIC AND PRIVATE SECTOR BANKS...
A STUDY OF VARIOUS TYPES OF LOANS OF SELECTED PUBLIC AND PRIVATE SECTOR BANKS...A STUDY OF VARIOUS TYPES OF LOANS OF SELECTED PUBLIC AND PRIVATE SECTOR BANKS...
A STUDY OF VARIOUS TYPES OF LOANS OF SELECTED PUBLIC AND PRIVATE SECTOR BANKS...
 
Study on banking sector
Study on banking sectorStudy on banking sector
Study on banking sector
 
Current and future challenges of banking sector- report on DBBL
Current and future challenges of banking sector- report on DBBLCurrent and future challenges of banking sector- report on DBBL
Current and future challenges of banking sector- report on DBBL
 
Comparative Analysis of Saving accounts of different Banks
Comparative Analysis of Saving accounts of different BanksComparative Analysis of Saving accounts of different Banks
Comparative Analysis of Saving accounts of different Banks
 
Credit Risk Management on Bank of Baroda.docx
Credit Risk Management on Bank of Baroda.docxCredit Risk Management on Bank of Baroda.docx
Credit Risk Management on Bank of Baroda.docx
 
Project+on+hdfc
Project+on+hdfcProject+on+hdfc
Project+on+hdfc
 
A project report on credit risk @ sbi project report mba finance By Babasab ...
A project report on credit risk  @ sbi project report mba finance By Babasab ...A project report on credit risk  @ sbi project report mba finance By Babasab ...
A project report on credit risk @ sbi project report mba finance By Babasab ...
 
A STUDY ON LOANS AND ADVANCES PROVIDED BY THE INDIAN BANK ZONAL OFFICE, TRICHY
A STUDY ON LOANS AND ADVANCES PROVIDED BY THE INDIAN BANK ZONAL OFFICE, TRICHYA STUDY ON LOANS AND ADVANCES PROVIDED BY THE INDIAN BANK ZONAL OFFICE, TRICHY
A STUDY ON LOANS AND ADVANCES PROVIDED BY THE INDIAN BANK ZONAL OFFICE, TRICHY
 
Sm project gp6
Sm project gp6Sm project gp6
Sm project gp6
 
1928100581_ BBA_ LAXMI VERMA.pdf
1928100581_ BBA_ LAXMI VERMA.pdf1928100581_ BBA_ LAXMI VERMA.pdf
1928100581_ BBA_ LAXMI VERMA.pdf
 
1928100581_ BBA_ LAXMI VERMA.pdf
1928100581_ BBA_ LAXMI VERMA.pdf1928100581_ BBA_ LAXMI VERMA.pdf
1928100581_ BBA_ LAXMI VERMA.pdf
 
Lokesh_BBA_Project_on_Axis_Bank_Pvt_ltd20200403-114304-w6vuuq.pdf
Lokesh_BBA_Project_on_Axis_Bank_Pvt_ltd20200403-114304-w6vuuq.pdfLokesh_BBA_Project_on_Axis_Bank_Pvt_ltd20200403-114304-w6vuuq.pdf
Lokesh_BBA_Project_on_Axis_Bank_Pvt_ltd20200403-114304-w6vuuq.pdf
 
A Comparative study of the Financial Performance of the Axis Bank Ltd & ICICI...
A Comparative study of the Financial Performance of the Axis Bank Ltd & ICICI...A Comparative study of the Financial Performance of the Axis Bank Ltd & ICICI...
A Comparative study of the Financial Performance of the Axis Bank Ltd & ICICI...
 
Gp consumer behaviour for third party at private banks
Gp   consumer behaviour for third party at private banksGp   consumer behaviour for third party at private banks
Gp consumer behaviour for third party at private banks
 

Recently uploaded

clinical examination of hip joint (1).pdf
clinical examination of hip joint (1).pdfclinical examination of hip joint (1).pdf
clinical examination of hip joint (1).pdf
Priyankaranawat4
 
writing about opinions about Australia the movie
writing about opinions about Australia the moviewriting about opinions about Australia the movie
writing about opinions about Australia the movie
Nicholas Montgomery
 
How to Add Chatter in the odoo 17 ERP Module
How to Add Chatter in the odoo 17 ERP ModuleHow to Add Chatter in the odoo 17 ERP Module
How to Add Chatter in the odoo 17 ERP Module
Celine George
 
ISO/IEC 27001, ISO/IEC 42001, and GDPR: Best Practices for Implementation and...
ISO/IEC 27001, ISO/IEC 42001, and GDPR: Best Practices for Implementation and...ISO/IEC 27001, ISO/IEC 42001, and GDPR: Best Practices for Implementation and...
ISO/IEC 27001, ISO/IEC 42001, and GDPR: Best Practices for Implementation and...
PECB
 
The History of Stoke Newington Street Names
The History of Stoke Newington Street NamesThe History of Stoke Newington Street Names
The History of Stoke Newington Street Names
History of Stoke Newington
 
Assessment and Planning in Educational technology.pptx
Assessment and Planning in Educational technology.pptxAssessment and Planning in Educational technology.pptx
Assessment and Planning in Educational technology.pptx
Kavitha Krishnan
 
Exploiting Artificial Intelligence for Empowering Researchers and Faculty, In...
Exploiting Artificial Intelligence for Empowering Researchers and Faculty, In...Exploiting Artificial Intelligence for Empowering Researchers and Faculty, In...
Exploiting Artificial Intelligence for Empowering Researchers and Faculty, In...
Dr. Vinod Kumar Kanvaria
 
Liberal Approach to the Study of Indian Politics.pdf
Liberal Approach to the Study of Indian Politics.pdfLiberal Approach to the Study of Indian Politics.pdf
Liberal Approach to the Study of Indian Politics.pdf
WaniBasim
 
Pride Month Slides 2024 David Douglas School District
Pride Month Slides 2024 David Douglas School DistrictPride Month Slides 2024 David Douglas School District
Pride Month Slides 2024 David Douglas School District
David Douglas School District
 
Pollock and Snow "DEIA in the Scholarly Landscape, Session One: Setting Expec...
Pollock and Snow "DEIA in the Scholarly Landscape, Session One: Setting Expec...Pollock and Snow "DEIA in the Scholarly Landscape, Session One: Setting Expec...
Pollock and Snow "DEIA in the Scholarly Landscape, Session One: Setting Expec...
National Information Standards Organization (NISO)
 
S1-Introduction-Biopesticides in ICM.pptx
S1-Introduction-Biopesticides in ICM.pptxS1-Introduction-Biopesticides in ICM.pptx
S1-Introduction-Biopesticides in ICM.pptx
tarandeep35
 
বাংলাদেশ অর্থনৈতিক সমীক্ষা (Economic Review) ২০২৪ UJS App.pdf
বাংলাদেশ অর্থনৈতিক সমীক্ষা (Economic Review) ২০২৪ UJS App.pdfবাংলাদেশ অর্থনৈতিক সমীক্ষা (Economic Review) ২০২৪ UJS App.pdf
বাংলাদেশ অর্থনৈতিক সমীক্ষা (Economic Review) ২০২৪ UJS App.pdf
eBook.com.bd (প্রয়োজনীয় বাংলা বই)
 
Top five deadliest dog breeds in America
Top five deadliest dog breeds in AmericaTop five deadliest dog breeds in America
Top five deadliest dog breeds in America
Bisnar Chase Personal Injury Attorneys
 
PCOS corelations and management through Ayurveda.
PCOS corelations and management through Ayurveda.PCOS corelations and management through Ayurveda.
PCOS corelations and management through Ayurveda.
Dr. Shivangi Singh Parihar
 
DRUGS AND ITS classification slide share
DRUGS AND ITS classification slide shareDRUGS AND ITS classification slide share
DRUGS AND ITS classification slide share
taiba qazi
 
A Survey of Techniques for Maximizing LLM Performance.pptx
A Survey of Techniques for Maximizing LLM Performance.pptxA Survey of Techniques for Maximizing LLM Performance.pptx
A Survey of Techniques for Maximizing LLM Performance.pptx
thanhdowork
 
How to Manage Your Lost Opportunities in Odoo 17 CRM
How to Manage Your Lost Opportunities in Odoo 17 CRMHow to Manage Your Lost Opportunities in Odoo 17 CRM
How to Manage Your Lost Opportunities in Odoo 17 CRM
Celine George
 
Your Skill Boost Masterclass: Strategies for Effective Upskilling
Your Skill Boost Masterclass: Strategies for Effective UpskillingYour Skill Boost Masterclass: Strategies for Effective Upskilling
Your Skill Boost Masterclass: Strategies for Effective Upskilling
Excellence Foundation for South Sudan
 
World environment day ppt For 5 June 2024
World environment day ppt For 5 June 2024World environment day ppt For 5 June 2024
World environment day ppt For 5 June 2024
ak6969907
 
The Diamonds of 2023-2024 in the IGRA collection
The Diamonds of 2023-2024 in the IGRA collectionThe Diamonds of 2023-2024 in the IGRA collection
The Diamonds of 2023-2024 in the IGRA collection
Israel Genealogy Research Association
 

Recently uploaded (20)

clinical examination of hip joint (1).pdf
clinical examination of hip joint (1).pdfclinical examination of hip joint (1).pdf
clinical examination of hip joint (1).pdf
 
writing about opinions about Australia the movie
writing about opinions about Australia the moviewriting about opinions about Australia the movie
writing about opinions about Australia the movie
 
How to Add Chatter in the odoo 17 ERP Module
How to Add Chatter in the odoo 17 ERP ModuleHow to Add Chatter in the odoo 17 ERP Module
How to Add Chatter in the odoo 17 ERP Module
 
ISO/IEC 27001, ISO/IEC 42001, and GDPR: Best Practices for Implementation and...
ISO/IEC 27001, ISO/IEC 42001, and GDPR: Best Practices for Implementation and...ISO/IEC 27001, ISO/IEC 42001, and GDPR: Best Practices for Implementation and...
ISO/IEC 27001, ISO/IEC 42001, and GDPR: Best Practices for Implementation and...
 
The History of Stoke Newington Street Names
The History of Stoke Newington Street NamesThe History of Stoke Newington Street Names
The History of Stoke Newington Street Names
 
Assessment and Planning in Educational technology.pptx
Assessment and Planning in Educational technology.pptxAssessment and Planning in Educational technology.pptx
Assessment and Planning in Educational technology.pptx
 
Exploiting Artificial Intelligence for Empowering Researchers and Faculty, In...
Exploiting Artificial Intelligence for Empowering Researchers and Faculty, In...Exploiting Artificial Intelligence for Empowering Researchers and Faculty, In...
Exploiting Artificial Intelligence for Empowering Researchers and Faculty, In...
 
Liberal Approach to the Study of Indian Politics.pdf
Liberal Approach to the Study of Indian Politics.pdfLiberal Approach to the Study of Indian Politics.pdf
Liberal Approach to the Study of Indian Politics.pdf
 
Pride Month Slides 2024 David Douglas School District
Pride Month Slides 2024 David Douglas School DistrictPride Month Slides 2024 David Douglas School District
Pride Month Slides 2024 David Douglas School District
 
Pollock and Snow "DEIA in the Scholarly Landscape, Session One: Setting Expec...
Pollock and Snow "DEIA in the Scholarly Landscape, Session One: Setting Expec...Pollock and Snow "DEIA in the Scholarly Landscape, Session One: Setting Expec...
Pollock and Snow "DEIA in the Scholarly Landscape, Session One: Setting Expec...
 
S1-Introduction-Biopesticides in ICM.pptx
S1-Introduction-Biopesticides in ICM.pptxS1-Introduction-Biopesticides in ICM.pptx
S1-Introduction-Biopesticides in ICM.pptx
 
বাংলাদেশ অর্থনৈতিক সমীক্ষা (Economic Review) ২০২৪ UJS App.pdf
বাংলাদেশ অর্থনৈতিক সমীক্ষা (Economic Review) ২০২৪ UJS App.pdfবাংলাদেশ অর্থনৈতিক সমীক্ষা (Economic Review) ২০২৪ UJS App.pdf
বাংলাদেশ অর্থনৈতিক সমীক্ষা (Economic Review) ২০২৪ UJS App.pdf
 
Top five deadliest dog breeds in America
Top five deadliest dog breeds in AmericaTop five deadliest dog breeds in America
Top five deadliest dog breeds in America
 
PCOS corelations and management through Ayurveda.
PCOS corelations and management through Ayurveda.PCOS corelations and management through Ayurveda.
PCOS corelations and management through Ayurveda.
 
DRUGS AND ITS classification slide share
DRUGS AND ITS classification slide shareDRUGS AND ITS classification slide share
DRUGS AND ITS classification slide share
 
A Survey of Techniques for Maximizing LLM Performance.pptx
A Survey of Techniques for Maximizing LLM Performance.pptxA Survey of Techniques for Maximizing LLM Performance.pptx
A Survey of Techniques for Maximizing LLM Performance.pptx
 
How to Manage Your Lost Opportunities in Odoo 17 CRM
How to Manage Your Lost Opportunities in Odoo 17 CRMHow to Manage Your Lost Opportunities in Odoo 17 CRM
How to Manage Your Lost Opportunities in Odoo 17 CRM
 
Your Skill Boost Masterclass: Strategies for Effective Upskilling
Your Skill Boost Masterclass: Strategies for Effective UpskillingYour Skill Boost Masterclass: Strategies for Effective Upskilling
Your Skill Boost Masterclass: Strategies for Effective Upskilling
 
World environment day ppt For 5 June 2024
World environment day ppt For 5 June 2024World environment day ppt For 5 June 2024
World environment day ppt For 5 June 2024
 
The Diamonds of 2023-2024 in the IGRA collection
The Diamonds of 2023-2024 in the IGRA collectionThe Diamonds of 2023-2024 in the IGRA collection
The Diamonds of 2023-2024 in the IGRA collection
 

Npa

  • 1. International Journal of Scientific and Research Publications, Volume 9, Issue 4, April 2019 303 ISSN 2250-3153 http://dx.doi.org/10.29322/IJSRP.9.04.2019.p8843 www.ijsrp.org A Study on Comparative Analysis of Non-Performing Assets in Selected Private Sector Bankst Numer P, Devika P Department of Business Administration with Computer Application, Sri Krishna Arts and Science College, Coimbatore. DOI: 10.29322/IJSRP.9.04.2019.p8843 http://dx.doi.org/10.29322/IJSRP.9.04.2019.p8843 Abstract- Banking is the fastest growing economy in India. A major consequence faced by banks nowadays is Non – Performing Assets. A high level of NPA in banks will increase the credit values and affects the profit of banks. Thus, the banks will lose their investment for the long turn. The main objective of the study is to highlight the NPA trend growth of each banks and the Correlation Analysis of Net Profit and Net NPAs of each bank. The study is descriptive in nature and secondary data are collected and analyzed using Trend Ratio, Current Ratio, Assets on Equity Ratio and Pearson Correlation Co-efficient Analysis to examining NPAs, Net Profit and Assets quality of banks. The study is observed for the financial years from 2013-14 to 2017-18, Annual Reports of Selected Private Sector Banks such as Axis Bank, Federal Bank, IndusInd Bank. The trend analysis is used to understand the increasing profitability and bad loans structures in the banks and Correlation Analysis is used to compare the Net NPA and Net Profit. Through the study, it was concluded that IndusInd Bank is having positive growth in Net Profit as well as growth in NPAs which is not affecting the banking performance when comparing with other two banks. Index Terms- NPA, Trend Ratio, Current Ratio, Correlation Co- efficient, Net Profit, Performance I. INTRODUCTION 1.1.Overview of the Study on-Performing Assets Non-Performing Assets are meant by the uncovered funds which is lender by the banks to individuals or a companies. The amount which is lender to individual or companies have to be written by 90 days or recover within 90 days of the cash received. In case, the amount which is not recovered within 90 days it is termed as Non-Performing Assets (NPA). The NPAs are sources in credit risk and the cas to be received are mentioned as “out of order” account. The Non-Performing Assets are variously classified by doubtful assets, substandard assets. The doubtful assets are to recovered within 12 months and the substandard assets are amount considered as the doubtful assets which are not received by the bank. Why Private Sector banks? The role of private sector banks is increasing nowadays as many individuals and companies are interested in getting loans for their needs. Private Sector Banks are considering as fastest provider in India Banking Sectors. While the public sector banks are facing major NPAs and it is easy to find a solution to NPA effects and their nature of affecting the banks’ performance. In Private Sector Banks, Axis Bank, Federal Bank, IndusInd Bank is selected for analysis as per the sales value in profit & loss account and goodwill among the customers. 1.2 Industry Profile  The Indian banking system consists of 27 public sector banks, 21 private sector banks, 49 foreign banks, 56 regional rural banks, 1,562 urban cooperative banks and 94,384 rural cooperative banks, in addition to cooperative credit institutions.  As of Q2 FY2019, total credit extended by commercial banks surged to ₹90,579.89 billion and deposits grew to ₹118,501.82 billion.  Indian banks are increasingly focusing on adopting integrated approach to risk management. Banks have already embraced the international banking supervision accord of Basel II, and majority of the banks already meet capital requirements of Basel III, which has a deadline of March 31, 2019.  Reserve Bank of India (RBI) has decided to set up Public Credit Registry (PCR) an extensive database of credit information which is accessible to all stakeholders. The Insolvency and Bankruptcy Code (Amendment) Ordinance, 2017 Bill has been passed and is expected to strengthen the banking sector.  Deposits under Pradhan Mantri Jan Dhan Yojana (PMJDY) increased to ₹863.21 billion were deposited and 336.6 million accounts were opened in India. In May 2018, the Government of India provided ₹6 trillion loans to 120 million beneficiaries under Mudra scheme. In May 2018, the total number of subscribers was 11 million, under Atal Pension Yojna.  Rising incomes are expected to enhance the need for banking services in rural areas and therefore drive the growth of the sector. As of September 2018, Department of Financial Services (DFS), Ministry of Finance and National Informatics Centre (NIC) launched Jan Dhan Darshak as a part of financial inclusion initiative. It is a mobile app to help people locate financial services in India. N
  • 2. International Journal of Scientific and Research Publications, Volume 9, Issue 4, April 2019 304 ISSN 2250-3153 http://dx.doi.org/10.29322/IJSRP.9.04.2019.p8843 www.ijsrp.org  The digital payments revolution will trigger massive changes in the way credit is disbursed in India. Debit cards have radically replaced credit cards as the preferred payment mode in India, after demonetization. Debit cards garnered a share of 87.14 per cent of the total card spending. List of Public Sector Banks and Private Sector Banks in India Public Sector Banks Private Sector Banks 1. Allahabad Bank 2. Andhra Bank 3. Bank of Baroda 4. Bank of India 5. Bank of Maharashtra 6. Canara Bank 7. Central Bank of India 8. Corporation Bank 9. Dena Bank 10. Indian Bank 11. Indian Overseas Bank 12. Oriental Bank of Commerce 13. Punjab National Bank 14. Punjab & Sind Bank 15. State Bank of India 16. Syndicate Bank 17. UCO Bank 18. Union Bank of India 19. United Bank of India 20. Vijaya Bank 21. IDBI Bank Ltd 22. Bharatiya Mahila Bank 1. Catholic Syrian Bank 2. City Union Bank 3. Dhanlaxmi Bank 4. Federal Bank 5. Jammu and Kashmir Bank 6. Karnataka Bank 7. Karur Vysya Bank 8. Lakshmi Vilas Bank 9. Nainital Bank 10. Ratnakar Bank 11. South Indian Bank 12. Tamilnad Mercantile Bank 13. Axis Bank 14. Development Credit Bank 15. HDFC Bank 16. ICICI Bank 17. IndusInd Bank 18. Kotak Mahindra Bank 19. Yes Bank 20. IDFC 21. Bandhan Bank For the study, Three Banks from Private Sector is selected namely Axis Bank, Federal Bank and IndusInd Bank.
  • 3. International Journal of Scientific and Research Publications, Volume 9, Issue 4, April 2019 305 ISSN 2250-3153 http://dx.doi.org/10.29322/IJSRP.9.04.2019.p8843 www.ijsrp.org 1.3 Company Profile 1.3.1 Axis Bank It is India’s third largest private sector bank, which is offering the sources and funs to the business operations in various sectors of the industrial units and the publics. The Bank has 59,600 employees with its 3,882 domestic branches and 12,660 ATMs across the country. The network of Axis Bank spreads across 2,211 cities and towns, enabling the Bank to reach out to a large cross-section of customers with an array of products and services. Vision To be the preferred financial solutions provider excelling in customer delivery through insight, empowered employees and smart use of technology. Values Company’s Core Values,  Customer Centricity  Ethics  Transparency  Teamwork  Ownership Chief Executive Officer Amitabh Chaudhry Industry Type : Private Limited Bank Operating Profit : ₹15,594 Crores Net Profit : ₹ 276 Crores Gross NPA% : 6.77% Net NPA% : 3.40% Corporate Social Responsibility Amount of Corporate Social Responsibility expenses spent during the year - 126.50 crores  Infrastructure Development  Environmental  Healthcare  Education 1.3.2 Federal Bank The ancient development of federal bank is brought by the year 1931 and avil the first facility of banking resources for the people in pre-independence era. The founder and the visionary of federal bank, Late K.P Hormis is the main coin for the bank to be developed in this particular modern times of India. Federal Bank is orginated from its ancient name as Nationwide Institutions. Now the bank is developed and placed its leg in 25 states and makes its best part of BSE and NSE stock prices. Vision  To be the ‘Most Admired Bank’ which is digitally enabled with a sharp focus on Micro, Medium and Middle market enterprises.
  • 4. International Journal of Scientific and Research Publications, Volume 9, Issue 4, April 2019 306 ISSN 2250-3153 http://dx.doi.org/10.29322/IJSRP.9.04.2019.p8843 www.ijsrp.org Mission  Achieve a consistent annual post-tax return of 18% per month.  Develop in every employee a high degree of pride and loyalty in serving the bank. Chief Executive Officer Shyam Srinivasan Industry Type : Private Limited Bank Operating Profit : ₹ 5,692 Crores Net Profit : ₹ 2,297 Crores Gross NPA% : 3% Net NPA% : 1.69% Corporate Social Responsibility The bank has spent 14.43 crores on various social and environment activities, in the areas follow as,  Education and Skill  Healthcare & Safety  Rural Development  Welfare & Poverty   1.3.3 IndusInd Bank IndusInd Bank Limited is a Mumbai based Indian new generation bank, established in 1994. IndusInd Bank was inaugurated in April 1994 by then Union Finance Minister Manmohan Singh. IndusInd Bank is the first among the new-generation private banks in India. As on June 30, 2016, IndusInd Bank has 1,004 branches, and 1885 ATMs spread across 625 geographical locations of the country. Mumbai has the maximum number of bank branches followed by New Delhi and Chennai. The bank has also proposed to double the branches count to 1200 by March 2019. Vision IndusInd Bank will be,  A relevant business and banking partner to its clients.  Customer Responsive, striving at all times to collaborate with clients in providing solutions for their banking needs.  A forerunner in the marketplace in terms of profitability, productivity and efficiency.  Engaged with all our stakeholders and will deliver sustainable and compliant returns. Mission  They will consistently add value to all our stakeholders and emerge as India’s most convenient Bank with Best-in- Banking financial parameters together with the doubling of loan book, clients and profits within the next 3 years.  Chief Executive Officer Romesh Sobti
  • 5. International Journal of Scientific and Research Publications, Volume 9, Issue 4, April 2019 307 ISSN 2250-3153 http://dx.doi.org/10.29322/IJSRP.9.04.2019.p8843 www.ijsrp.org Type Of Industry : Private Bank Limited Operating Profit : ₹ 6,656 Crores Net Profit : ₹ 3,606 Crores Gross NPA% : 1.34% Net NPA% : 0.54% Corporate Social Responsibility The Bank has spent 20.47 crores on various social and environmental activities, in the areas follows as,  Rural Development & Inclusiveness  Environmental  Sustainability  Preventive  Healthcare  Education & Sports 1.4 Need for the Study Banking is the fastest growing economy in India. A major consequence faced by banks now a days is Non – Performing Assets. A high level of NPA in banks will increase the credit values and affects the profit of banks. Thus, the banks will lose their investment for long turn. The article titled “Banks NPAs touch 12.2% by March 2019” is showing the current NPAs rising from 11.6% to 12.2% by March 2019. This shows that Banks and its sector are having more capitalization in investing money and affects the entire economy of the country. It is necessary to trim the NPAs to protect the country’s economy and to increase Bank’s efficiency. 1.5 Objectives of the Study Primary Objective  To Study on comparative analysis of Non – Performing Assets in Selected Private Sector Banks in India. Secondary Objectives  To study the trend of Gross NPA and Net NPA of Selected Private Sector Banks in India.  To measure the effect of NPA in Selected Private Sector Banks Performance. 1.6 Scope of the Study The scope of the study is to understand the comparative analysis of Non-Performing Assets based on secondary collected from Annual Reports of the Banks. The empirical research is used to analyse the data and variables. The Pearson Correlation Co- Efficient tool is used to find the relationship between two variables and analyse the trend factors in GNPA and NNPA. The process of disbursement is used to evaluate the loans disbursement in various sectors and analysing the NPAs in the Geographical distributions. 1.7 Limitations of the Study  The study is observed from the financial year FY2013- FY2014 to FY2017-FY2018.  The data is only based on the secondary data set and focused only on the limited financial statement.  The study is focused only on three banks such as Axis Bank, Federal Bank, IndusInd Bank only. II. LITERATURE REVIEW 2.1 Theoretical Concepts Comparative analysis is used to compare two or more factors to find the positive relationship in each category of the financial statements or business reports of an individual or company based on its market share value, sales report, financial strategy and net operating revenue. The Bank performance is maintained by the Net Profit and Net Sales acquired through the financial years. In this case, Loans are marking up the important structures in creating the performance of banks as low or high in market structure. The loans paying to customer or an individual is to repay or recover by bank from the customer within 90 days and should be considered as interest amount collected on the basis of principal amount provided. When the loans provided to the customer or an individual is become non recoverable funds in future (after 90 days) is considered as Non-Performing Loans or Bad Loans. The Non-Performing Loans are playing major role in bank performance for creating the net profit and analyse the growth of the company for each year. The non-recovered funds are disbursed among various sectors and the NPAs in top five sectors is increasing each financial years. The study is Analytical in nature and analyse the secondary data using various tools like Trend Analysis and Pearson Correlation Co-efficient Ratio in each sectors. Trend Analysis is used to understand the growth of each year and used to analyse to collected data as positive and negative trend growth. Trend analysis can be allowed to each bank and promotes the future trending values in the Profit of Banks.
  • 6. International Journal of Scientific and Research Publications, Volume 9, Issue 4, April 2019 308 ISSN 2250-3153 http://dx.doi.org/10.29322/IJSRP.9.04.2019.p8843 www.ijsrp.org 2.2 Review of Literature 1. Kanika Goyal (2010), an article on “Empirical Study on Non-Performing Assets and Management of Indian Public Sector Banks”. The analysis is based on trend ratio of GNPAs, NNPAs and Assets quality. The data is analyzed using Percentage analysis and statistical tools approaching tools like regression analysis, and co- efficient approach on ANOVA test and Post Low-Key HSD Procedures. 2. Bhawna Sethi (2013) had studied “The Comparative Analysis of NPAs in Punjab National Bank and State Bank of India”. The methodology is based on conceptual framework, population and sample selection, collection of data, analysis of data. Tools use for the analysis is based on Mean, Standard Deviation, Standard Error, T-Test, ANOVA Test. 3. Samir (June 2013) had studied a “Comparative Analysis of Non-Performing Assets of Selected Commercial Banks in India. Its objective is to prevent or delays recycling of funds and erodes profit by way of provisions. The methodology is analytical in nature to understand the trend in Gross NPA and Net NPAs as percentage of total Assets respectively. This Paper is based on trend analysis of NPA and evaluates the financial health of banks. 4. Krishna Murari (Aug 2014) had studied “Comparative Analysis of Non-Performing Assets of Indian Banks: A Study of Public and Private Sector Banks”. The Data is analyzed using Percentage and ratio method of trend projection and one-way ANOVA. The main objective of banking reforms was to improve efficiency, productivity and profitability of banks. 5. Ankur Bhushan (Dec. 2016) had studied “The comparative study on NPA in HDFC Bank and OBC Bank” and screens in the nature of bank’s credit portfolio. The Objective on study is impact on NPA. The methodology is based on Auxiliary data and wellsprings of Data. The ratio analysis of NPA is based on limited resources of NPAs. 6. Ayub Ahamed KS (Dec.2016) had studied a “Comparative Study of Non-Performing Assets in Private Sectors Banks and Public Sector Banks in India”. The objectives are to study NPA trend in last 5 years of Private and private sector banks to measure and suggest the proper management of NPA in Banks. Research Methodology used to carry out is descriptive in nature and describing samples on IDBI Bank, Canara Bank, Central Bank, Axis Bank, ICICI Bank, Kotak Mahindra Bank. 7. Nithin Gupta (2016) had studied on “Non-Performing Assets of Public and Private Sector Banks in India”. The data is based on secondary data and analyzed using ratio analysis. The objective on sector wise distribution of NPAs in Public Sector Banks and Private Sector Banks. The ratio helps in finding out the decision on capital funds and the replacement opportunities in the Loans providing Sectors. 8. Payel Roy (2016) had studied “The Analysis of Non- Performing Assets in Public Sector Banks of India”. The banks advancing loans should be cautious enough to consider the backgrounds of loan receiver. The secondary data are used on study and analyzed using the secondary data to find the loans distributions and tools used like ANOVA, Regression Analysis for the secondary objectives of the study. 9. Vivek Rajbahadur Singh (2016) had studied “The Non-Performing Assets of Commercial Banks and its recovery in India”. The objectives are based on avoid future distractions in NPAs. The methodology based on secondary Data. Highlights the trend analysis and status in impacts in NPA. The NPAs are based on the commercial uses in the recovering process. 10. Dr. Biswanath Sukul (Jan. 2017) had studied on “Non-Performing Assets: A comparative analysis of selected private sector banks”. The objectives is to find the comparative analysis on NPA in HDFC Bank, Axis Bank, ICICI Bank. The methodology based on analytical nature and finding the trend ratio in NPAs. The Pearson Correlation Co-Efficient is used to explore the relationship between Net Profit and NPAs. 11. Rajkumar Mittal (July 2017) had studied “The problem of raising Non-Performing Assets in Banking Sector in India: Comparative Analysis of Public Sector Banks and Private Sector Banks”. The objectives are used to find the quantum of NPAs in Public Sector Banks and Private Sector Banks in India. The study is primarily analytical and descriptive based on secondary data collected from RBI Publications, Journals, Reports, and website annual report of the Public and Private Sector Banks. Compound Annual Growth is Loan Borrowed by an Individual Have to Repay within 90 days Interest Amount calucalted on basis from Principal Amount Loan Borrowed by an Individual Not recovered after 90 days Non-Performing Assets
  • 7. International Journal of Scientific and Research Publications, Volume 9, Issue 4, April 2019 309 ISSN 2250-3153 http://dx.doi.org/10.29322/IJSRP.9.04.2019.p8843 www.ijsrp.org calculated to identify the percentage increase in NPAs over the selected period. III. RESEARCH METHODOLOGY 3.1 Research Design Analytical Research Design is used for the study. The research is based on secondary data source available and collected from various external sources like annual reports, articles, journals and internet. The Secondary Data are analysed by using various statistical tools and find the solutions to understand the hypothesis in each concept of the values. Analytical Research Design is mainly involves in facts, figures and variables which can be interpreted and results can be shown in graphs and diagrams for the future purpose of the institutions. 3.2 Sources of Data Data can be defined as the quantitative or qualitative values of a variable. Data is plural of datum which literally means to give or something given. Data is thought to be the lowest unit of information from which other measurements and analysis can be done. Data can be numbers, images, words, figures, facts or ideas. Data in itself cannot be understood and to get information from the data one must interpret it into meaningful information. There are two types of Data one is Primary data which is fetched directly from the respondents, collected specially for the purpose of the study, and also is the original source and is first handed information. And the other type is Secondary Data are those data collected by someone else other than the user of those data, common sources of secondary data for social science include censuses information collected and published by the government of India departments, organisational records and data that was originally collected for other research purposes. In this study the data is fetched from secondary sources for the study. Such as the published annual reports, journals, web portals of the Axis Bank, Federal Bank, IndusInd Bank is used for the study. 3.3 Tools for Analysis 3.3.1 Trend Analysis A trend analysis is an aspect of technical analysis that tries to predict the future movement of a stock based on past data. Trend analysis is based on the idea that what has happened in the past gives traders an idea of what will happen in the future. There are three main types of trends: short-, intermediate- and long-term. 𝑻𝑻𝑻𝑻𝑻𝑻𝑻𝑻𝑻𝑻 𝑨𝑨𝑨𝑨𝑨𝑨𝑨𝑨𝑨𝑨𝑨𝑨𝑨𝑨𝑨𝑨 𝑹𝑹𝑹𝑹𝑹𝑹𝑹𝑹𝑹𝑹 = � 𝑪𝑪𝑪𝑪𝑪𝑪𝑪𝑪𝑪𝑪𝑪𝑪𝑪𝑪𝑪𝑪 𝑽𝑽𝑽𝑽𝑽𝑽𝑽𝑽𝑽𝑽 𝑩𝑩𝑩𝑩𝑩𝑩𝑩𝑩 𝑽𝑽𝑽𝑽𝑽𝑽𝑽𝑽𝑽𝑽 � ∗ 𝟏𝟏𝟏𝟏𝟏𝟏 In Trend Analysis, base value is starts from 100.00% and have to calculated with Compared Value. 3.3.2 Current Ratio The current ratio is a liquidity ratio that measures a company's ability to pay short-term obligations or those due within one year. It tells investors and analysts how a company can maximize the current assets on its balance sheet to satisfy its current debt and other payables. 𝑪𝑪𝑪𝑪𝑪𝑪𝑪𝑪𝑪𝑪𝑪𝑪𝑪𝑪 𝑹𝑹𝑹𝑹𝑹𝑹𝑹𝑹𝑹𝑹 = � 𝑪𝑪𝑪𝑪𝑪𝑪𝑪𝑪𝑪𝑪𝑪𝑪𝑪𝑪 𝑨𝑨𝑨𝑨𝑨𝑨𝑨𝑨𝑨𝑨𝑨𝑨 𝑪𝑪𝑪𝑪𝑪𝑪𝑪𝑪𝑪𝑪𝑪𝑪𝑪𝑪 𝑳𝑳𝑳𝑳𝑳𝑳𝑳𝑳𝑳𝑳𝑳𝑳𝑳𝑳𝑳𝑳𝑳𝑳𝑳𝑳𝑳𝑳 � A ratio under 1 indicates that the company’s debts due in a year or less are greater than its assets. 3.3.3 Return on Assets Return on assets (ROA) is the measure of efficiency and the profitable a company is relative to its total assets. The Return on Assets will be used to the financial managers to account the next year. 𝑹𝑹𝑹𝑹𝑹𝑹𝑹𝑹𝑹𝑹𝑹𝑹 𝑶𝑶𝑶𝑶 𝑨𝑨𝑨𝑨𝑨𝑨𝑨𝑨𝑨𝑨𝑨𝑨 = � 𝑵𝑵𝑵𝑵𝑵𝑵 𝑰𝑰𝑰𝑰𝑰𝑰𝑰𝑰𝑰𝑰𝑰𝑰 𝑻𝑻𝑻𝑻𝑻𝑻𝑻𝑻𝑻𝑻 𝑨𝑨𝑨𝑨𝑨𝑨𝑨𝑨𝑨𝑨𝑨𝑨 � ∗ 𝟏𝟏𝟏𝟏𝟏𝟏 3.3.4 Pearson Correlation Co-Efficient Ratio Pearson Correlation Co-efficient is used to study the relationship between Net Profit and Net NPA to understand the positive growth among the three selected banks. Co-efficient Values are used to predict the present values and future value based on two variables. The variables are based on dependent in one condition and independent in another condition of the financial years. 𝒓𝒓 = 𝑵𝑵∑𝐱𝐱𝐱𝐱 − (∑𝒙𝒙)(∑𝒚𝒚) ��𝑵𝑵∑𝒙𝒙𝟐𝟐 − (∑𝒙𝒙𝟐𝟐)��𝑵𝑵∑𝒚𝒚𝟐𝟐 − (∑𝒚𝒚𝟐𝟐)� N – Number of values ∑𝒙𝒙𝒙𝒙 – Sum of two multiplied variables ∑𝒙𝒙 – Sum of total x variable ∑𝒚𝒚 – Sum of total y variable ∑𝒙𝒙𝟐𝟐 - Sum of total squared x variable ∑𝒚𝒚𝟐𝟐 - Sum of total squared y variable Pearson Correlation Co-efficient is a statistical tool that calculates the strength of the relationship between the relative movements of the two variables. The range of values for the correlation coefficient bounded by 1.0 on an absolute value basis or between -1.0 to 1.0. If the correlation coefficient is greater than 1.0 or less than -1.0, the correlation measurement is incorrect. A correlation of -1.0 shows a perfect negative correlation, while a correlation of 1.0 shows a perfect positive correlation. A correlation of 0.0 shows zero or no relationship between the movement of the two variables. IV. ANALYSIS AND DISCUSSION 4.1 Trend Analysis 4.1.1 To Study the trend of Gross NPA and Net NPA
  • 8. International Journal of Scientific and Research Publications, Volume 9, Issue 4, April 2019 310 ISSN 2250-3153 http://dx.doi.org/10.29322/IJSRP.9.04.2019.p8843 www.ijsrp.org Table 4.1.1 Bank wise GNPA Bank Name 2013- 14 ₹ Crore 2014- 15 ₹ Crore 2015- 16 ₹ Crore 2016-17 ₹ Crore 2018-17 ₹ Crore Axis Bank 3,146. 41 4,110. 19 6,087.5 1 21,280. 48 34,248. 64 IndusInd Bank 620.79 562.92 776.82 1,054.8 7 1,704.9 1 Federal Bank 1,087. 41 1,057. 73 1,667.7 7 1,727.0 5 2,975.6 2 Interpretation  The value of GNPA is increasing continuously in each financial year and the GNPA is used to predict the Net Profit in future values. Table 4.1.2 Trend GNPA% (in Percentage) Bank Name 2013- 14 2014- 15 2015-16 2016-17 2017-18 Axis Bank 100 130.63 193.47 676.34 1088.49 IndusInd Bank 100 90.67 125.13 169.92 274.63 Federal Bank 100 97.27 153.37 158.82 257.08 Interpretation  Trend Analysis of GNPA in IndusInd Bank and Federal Bank is showing that the banks are facing trouble on FY2014-FY2015 is decreased 10% form base year value and promoting the factors for decrease in Net Profit in IndusInd Bank and Federal Bank is decreased by 3% from base year.  On 2015-16, GNPA values are increased by 25% and 40% in IndusInd Bank and Federal Bank respectively. It shows that the banks are facing higher Profitability and less risk return in credit wise transactions.  In five years, Axis Bank is having more GNPA% of 1088.4% and shows the higher risk in crediting the future money. And comparing 2017-18 with base year, the ratio is trending towards 100% increase and having less profitability. Chart 4.1.1 Trend GNPA% Interpretation  The base year trend analysis percentage is always 100.00%. If the percentage is decreased below 100.00% it shows that the company is indeed in higher net profit of that particular year. If it is above 100.00%, then the company is positively growing in generating net profit. 0 200 400 600 800 1000 1200 2013-14 2014-15 2015-16 2016-17 2017-18 GNPA% AXIS BANK INDUSIND BANK FEDERAL BANK
  • 9. International Journal of Scientific and Research Publications, Volume 9, Issue 4, April 2019 311 ISSN 2250-3153 http://dx.doi.org/10.29322/IJSRP.9.04.2019.p8843 www.ijsrp.org Table 4.1.3 Bank wise Net NPA Bank Name 2013- 14 ₹ Crore 2014- 15 ₹ Crore 2015- 16 ₹ Crore 2016- 17 ₹ Crore 2018- 17 ₹ Crore Axis Bank 1,024. 62 1,316.7 1 2,522.1 4 8,626.6 0 16,592. 00 IndusInd Bank 184.5 210.48 321.75 438.90 745.67 Federal Bank 321.56 373.27 950.01 941.20 1,551.9 6 Interpretation  In Federal Bank, the FY2016-FY2017 is showing the Net NPA ₹941.20 Crores is decreased from the previous year FY2015-FY2016. It shows that the company is relaxed at the financial year and decreased their risk of returns to promotes more profitability. Table 4.1.4 Trend NNPA% Bank 2013- 14 2014- 15 2015- 16 2016- 17 2017- 18 Axis Bank 100 128.50 246.15 841.93 1619.3 3 IndusInd Bank 100 114.36 174.81 238.46 405.14 Federal Bank 100 116.08 295.43 292.69 482.63 Interpretation  FY2016-FY2017 is analyzed as 3% decrease from FY2015-FY2016 and shows the value ₹9 crores approximately decreased from ₹950 crores and having more profitability in the current year.  In FY2017-FY2018 shows that Axis Bank is having more Net NPA has highest value ₹16,592 Crores and with trend ratio of 1619.33% and shows the tremendous growth when compared to previous year and in higher risks factors.  Among three banks, IndusInd Bank is rapidly growing in NNPA% by 14%, 60%, 60%, 200% from the base financial year. The 200% growth in NNPA ratio is shows the NPA values are dominating the current Net Profit Value of the Bank. Chart 4.1.2 Trend of NNPA% 0 200 400 600 800 1000 1200 1400 1600 1800 2013-14 2014-15 2015-16 2016-17 2017-18 NNPA% AXIS BANK INDUSIND BANK FEDERAL BANK
  • 10. International Journal of Scientific and Research Publications, Volume 9, Issue 4, April 2019 312 ISSN 2250-3153 http://dx.doi.org/10.29322/IJSRP.9.04.2019.p8843 www.ijsrp.org Interpretation  On comparing three banks Trend Ratio of FY2017- FY2018 is shows that IndusInd Bank is having lesser ratio 405.1% and next to Federal Bank, 482.6% and Axis Bank is placing more trend ratio value of 1619.3% and having more NPA values in five years. 4.1.2 Current Ratio Table 4.1.5 Current Ratio Bank Name 2013-14 ₹ Crore 2014-15 ₹ Crore 2015-16 ₹ Crore 2016-17 ₹ Crore 2017-18 ₹ Crore Axis Bank 6.82 6.29 7.68 10.34 9.21 IndusInd Bank 0.43 0.26 0.21 0.36 0.53 Federal Bank 6.61 4.88 6.84 6.24 6.23 Interpretation  In Five Financial years, IndusInd Bank is facing the major issues in distributing the current assets in each year and the bank is incapable in organizing the assets when to compared to other provisions. The ratio rate below 1 is considered for the major disturbance in the financial years.  The negative balance in the current ratio is showing that IndusInd Bank have to prepared for less liability in all consecutive years.  Axis Bank, shows the ratio of 10.34 in 2016-17 as a positive one and company is good in maintaining the assets and other provisions in all years Axis Bank is stable in current ratio as the company is strengthened in five financial years and the ratio rates are higher than 6.  Federal Bank is also good in maintaining the current ratio of each five consecutive years. The ratio resembles on Axis Bank and Federal Bank is good for the organization and may provide the internal funds to the organization. Chart 4.1.3 Current Ratio 0 2 4 6 8 10 12 2013-14 Rs. Crore 2014-15 Rs. Crore 2015-16 Rs. Crore 2016-17 Rs. Crore 2017-18 Rs. Crore Current Ratio Axis Bank Federal Bank IndusInd Bank Linear (Axis Bank) Linear (Federal Bank) Linear (IndusInd Bank)
  • 11. International Journal of Scientific and Research Publications, Volume 9, Issue 4, April 2019 313 ISSN 2250-3153 http://dx.doi.org/10.29322/IJSRP.9.04.2019.p8843 www.ijsrp.org Interpretation  Linear Trend is used in the current ratio to describe the bank’s short-term obligations in meeting their needs in each consecutive financial year.  Trend Line of Axis Bank is showing the continuous increase in associating the company assets and their short-term debt paying in year ended. Axis Bank is over the trend line in 2016-17 and their assets value is highly increased, and liabilities of that year is decreased and can increase internal provisions for the next working capital 2017-18.  Trend Line of IndusInd Bank is straight in organizing the assets and liabilities without any increased in the current ratio and the bank can do the moderate changes in the financial years.  Federal Bank is also associating the same trend line in current ratio and the bank is stable in solvent among the assets and liabilities in each year. 4.1.3 Return on Assets Table 4.1.6 Return On Assets (ROA) % Bank Name 2013-14 2014-15 2015-16 2016-17 2017-18 Axis Bank 1.62 1.59 1.56 0.61 0.03 IndusInd Bank 1.61 1.64 1.63 1.6 1.62 Federal Bank 1.12 1.21 0.52 0.72 0.63 Interpretation  ROA of Axis Bank is decreasing in all five years And IndusInd Bank is following the same ROA in all financial years. Axis Bank’s Performance is decreasing in each year and reaches 0.03% in 2017-18, shows that the bank is suitable for investor and shareholders to invest the shares.  IndusInd Bank’s Performance is moderate and the percentage in each year is 1.6% and shows the bank is good in investing the shares and shareholders to promote new shares in the industry when compared to Federal Bank and Axis Bank.  In 2017-18, Axis Bank is performing the lowest ROA among banks as it holds 0.03% and next to Axis Bank, Federal Bank is having 0.63% and IndusInd Bank holds 1.62% and showing IndusInd Bank is having essential Net Income and have stable investors.  In 2013-14, Axis Bank and IndusInd Bank is having the same percentage in ROA and showing the same investors and shareholders on that particular year. It makes the two banks become more competitive in the net profit and assets equality.
  • 12. International Journal of Scientific and Research Publications, Volume 9, Issue 4, April 2019 314 ISSN 2250-3153 http://dx.doi.org/10.29322/IJSRP.9.04.2019.p8843 www.ijsrp.org Chart 4.1.4 Return On Assets (ROA) % Interpretation  Trend Line of Axis Bank and Federal Bank is decreasing for the five financial years. Axis Bank is facing the major issue in ROA and doesn’t maintains the shareholding partners and investor to promote the shares for the next consecutive years.  Trend Line indicates that IndusInd Bank is good in understand the shareholding pattern in achieving the relations between investors in Profit and assets equality.4.2 Pearson Correlation Co-efficient 4.2.1 To test the relationship between Net NPA and Net Profit of Axis Bank. Negative Hypothesis: There is negative relationship and indicates the company is decreasing in one variable of the selected variables for the values is below -1. Null Hypothesis: The relationship between two variables are same and the co-efficient ratios are equal to understand the values are consistent when exactly 0. Positive Hypothesis: There is positive relationship and indicates that the values is increasing in one dependent variable of the selected variable for the values is above +1. Table 4.2.1 Comparing Net NPA and Net Profit of Axis Bank Bank Particulars 2013-14 ₹ Crores 2014-15 ₹ Crores 2015-16 ₹ Crores 2016-17 ₹ Crores 2017-18 ₹ Crores Axis Bank NET NPA 1,024.62 1,316.71 2,522.14 8,626.60 16,592.0 NET PROFIT 6217.67 7357.82 8223.66 3,679.28 275.68 Interpretation  Net profit of Axis Bank is continuously decreasing from financial year 2015-16 to 2017-18 and marked up with lowest Net Profit as ₹257.68 Crores and reflects more NPAs in the five years. This condition may bring heavy losses to the bank and may decrease net profit for future years also.  Net NPA of Axis Bank is increasing for all five years and reaches the value of ₹16,592 Crores in 2017-18. The Net NPA of Axis Bank is stable in increase and bank have to take remedial measures on clearing those funds. 0 0.5 1 1.5 2 2.5 2013-14 2014-15 2015-16 2016-17 2017-18 Return On Assets (ROA) % Axis Bank Federal Bank IndusInd Bank Linear (Axis Bank) Linear (Federal Bank) Linear (IndusInd Bank)
  • 13. International Journal of Scientific and Research Publications, Volume 9, Issue 4, April 2019 315 ISSN 2250-3153 http://dx.doi.org/10.29322/IJSRP.9.04.2019.p8843 www.ijsrp.org Table 4.2.2 Pearson Correlation Co-efficient of Axis Bank Bank Particulars 2013-14 ₹ Crores 2014-15 ₹ Crores 2015-16 ₹ Crores 2016-17 ₹ Crores 2017-18 ₹ Crores Ratio Axis Bank NET NPA 1,024.6 1,316.7 2,522.1 8,626.6 16,592.0 -0.95 NET PROFIT 6217.67 7357.82 8223.66 3,679.2 275.68 Interpretation  As Axis Bank is facing major issues in Net NPA increasing for the five financial years, the bank’s correlated ratio is -0.95 and the ratio is negative in relationships and shows that Net NPA and Net Profit is not related as Net NPA is increasing constantly and Net Profit is less when compared with Net NPA.  In financial years 2013-14, 2014-15, 2015-16 shows that Axis Bank is maintaining the Net Profit as it requires to performing the Bank assets and other internal provisions while the Net Profit is also increasing in other side.  In financial years, 2017-18 Axis Bank faces its dramatical change in Net Profit and Net NPA is increased by ₹ 8,626.6 Crores and the NPAs is peeked in that year and tends to increase by ₹ 16,592 Crores and Axis Bank is in unexpected issues to control and monitor the funds. Chart 4.2.1 Comparing Net NPA and Net Profit of Axis Bank Interpretation  In 2017-18, Axis Bank Net NPA is increased drastically and making the bank to suffer in upcoming financial years. Increase in Net NPA is not good for the Bank as it decreases the profitability for the following years.  The Ratio -0.95 is showing the negative relationship between Net NPA and Net Profit for all five financial years. The Line express the relations associated with the Net NPA and Net Profit of Axis Bank.  The Negative Relationship existing in Axis Bank leads to decrease in stock investors, lesser profitability and can’t exists the following financial years to promote the budgets and the banking performance throughout the financial years. 4.2.2 To test the relationship between Net NPA and Net Profit of IndusInd Bank Negative Hypothesis: There is negative relationship and indicates the company is decreasing in one variable of the selected variables for the values is below -1. 1,024.62 1,316.71 2,522.14 8,626.60 16,592.00 -0.953813262 6217.67 7357.82 8223.66 3,679.28 275.68 2013-14 ₹ Crore 2014-15 ₹ Crore 2015-16 ₹ Crore 2016-17 ₹ Crore 2017-18 ₹ Crore Ratio Net NPA and Net Profit with Correlated Ratio Axis Bank NET NPA Axis Bank NET PROFIT
  • 14. International Journal of Scientific and Research Publications, Volume 9, Issue 4, April 2019 316 ISSN 2250-3153 http://dx.doi.org/10.29322/IJSRP.9.04.2019.p8843 www.ijsrp.org Null Hypothesis: The relationship between two variables are same and the co-efficient ratios are equal to understand the values are consistent when exactly 0. Positive Hypothesis: There is positive relationship and indicates that the values is increasing in one dependent variable of the selected variable for the values is above +1. Table 4.2.3 Comparing Net NPA and Net Profit of IndusInd Bank Bank Particulars 2013-14 ₹ Crore 2014-15 ₹ Crore 2015-16 ₹ Crore 2016-17 ₹ Crore 2017-18 ₹ Crore IndusInd Bank NET NPA 184.05 210.48 321.75 438.9 745.67 NET PROFIT 1,408.02 1,793.72 2,286.45 2,867.89 2,978.89 Interpretation  On interpreting IndusInd Bank Net NPA and Net Profit the bank is having Increasing factors for both the cases. Increased Net Profit and Increasing Net Profit is maintaining the Bank performance consistent and achieve their internal operations.  While increase in Net Profit is a good sign for the Bank and can increase more shareholders and investors in their shares. On the same while, Net NPA is increasing in each year is also acting as a barrier for the bank’s growth in each year.  The Net Profit which is earned by the bank is fully in depositing against the Bad Loans acquired by the Bank and it is highest NPA of ₹ 745.67 Crores and the Net Profit is ₹ 2,978.89 Crores which takes the bank to stable and constant in acquiring the good position in Banking Industry. Table 4.2.4 Pearson Correlation Co-Efficient of IndusInd Bank Ba nk Partic ulars 2013 -14 ₹ Cror es 2014 -15 ₹ Cror es 2015- 16 ₹ Cror es 2016 -17 ₹ Cror es 2017 -18 ₹ Cror es Ra tio Ind us -Ind Ban k NET NPA 184.0 5 210. 48 321.7 5 438. 9 745.6 7 0.8 8 NET PROFI T 1,408 .0 1,79 3.7 2,286 .4 2,86 7.8 2,978 .8 Interpretation  The correlation ratio of IndusInd Bank is 0.88 and it shows the positive relationship between Net NPA and Net Profit for the all consecutive financial years. The Positive Relationship for the banks is reflecting the strong management and the organization of funds in each sector wise distribution of loans.  IndusInd Bank performance is measured with its positive relationship among Net NPA and Net Profit. In this case, the Net NPA values is also increasing the factors and raising the bank to regulate the movement of NPAs among different sectors and their sources of funds.  While considering the Net Profit of 2015-16 and 2016-17 is slightly increased and the bank is facing with higher NPA of ₹ 438.9 Crores which shows that the bank is lite unstable conditions but however the bank is organized by the essential funds on that particular year.
  • 15. International Journal of Scientific and Research Publications, Volume 9, Issue 4, April 2019 317 ISSN 2250-3153 http://dx.doi.org/10.29322/IJSRP.9.04.2019.p8843 www.ijsrp.org Chart 4.2.2 Comparing Net NPA and Net Profit of IndusInd Bank Interpretation  On interpreting the IndusInd Bank is facing more Net Profit when compared to Net NPAs and this is the major factor for IndusInd Bank is to maintain the greater management and the sources of funds among the industrial sectors.  Positive relationship is acquired with 0.88 as Net NPA is lower when compared to Net Profit acquired by the banks each year.  Higher Profitability shows that the bank is leading in acquiring new customers and other benefits in new customer avail facility for the branches in urban and rural areas. This Profitability can increase the goodwill among the investors and shareholders to place a god shares in the market place and can increase the sales of the bank. 2.3 To test the relationship between Net NPA and Net Profit of Federal Bank Negative Hypothesis: There is negative relationship and indicates the company is decreasing in one variable of the selected variables for the values is below -1. Null Hypothesis: The relationship between two variables are same and the co-efficient ratios are equal to understand the values are consistent when exactly 0. Positive Hypothesis: There is positive relationship and indicates that the values is increasing in one dependent variable of the selected variable for the values is above +1. Table 4.2.5 Comparing Net NPA and Net Profit of Federal Bank Bank Particulars 2013-14 ₹ Crore 2014-15 ₹ Crore 2015-16 ₹ Crore 2016-17 ₹ Crore 2017-18 ₹ Crore Federal Bank NET NPA 321.56 373.27 950.01 941.2 1551.96 NET PROFIT 838.89 1,005.75 475.65 830.79 878.85 Interpretation  Federal Bank is facing the major issues in the financial year 2017-18 as Net NPA value is higher than Net Profit Value and seeks the highest NPA of ₹ 1551.96 Crores which is higher in the five financial years and NPA is continuously increasing from the base year 2013-14.  On interpreting the Net Profit of Federal Bank, the bank is facing again problem with constant increase and decrease in the profitability of banks. In financial year 2015-16 the bank is reached its lowest profit of ₹ 475.65 crores when compared with other financial years. 184.05 210.48 321.75 438.9 745.67 0.880918223 1,408.02 1,793.72 2,286.45 2,867.89 2,978.89 2013-14 ₹ Crore 2014-15 ₹ Crore 2015-16 ₹ Crore 2016-17 ₹ Crore 2017-18 ₹ Crore Ratio Net NPA and Net Profit with Correlated Ratio IndusInd Bank NET NPA IndusInd Bank NET PROFIT
  • 16. International Journal of Scientific and Research Publications, Volume 9, Issue 4, April 2019 318 ISSN 2250-3153 http://dx.doi.org/10.29322/IJSRP.9.04.2019.p8843 www.ijsrp.org  In financial year 2015-16, the bank faces major issues by increased in NPA and decrease in Net Profit and makes the banks more unstable and the performance is again measured to be low in handling the bad loans to the vendors and borrowers. Table 4.2.6 Pearson Correlation Co-efficient of Federal Bank Bank Particular 2013-14 ₹ Crore 2014-15 ₹ Crore 2015-16 ₹ Crore 2016-17 ₹ Crore 2017-18 ₹ Crore Ratio Federal Bank NET NPA 321.5 373.27 950.0 941.2 1551.9 -0.23 NET PROFIT 838.8 1,005.7 475.6 830.7 Interpretation  Federal Bank’s correlated ratio of Net NPA and Net Profit is -0.23, which reflects the bank is negative relationship in NPA and Profit. The negative relationship is unstable and the bank efficiency in providing the funds and money to other transfer is impossible in accessing the Bad loans.  Net NPA and Net Profit is resembling the major part of a bank, in Federal Bank both factors are below in ratio to its lesser profitability and the bank is to take remedial measures in control the unorganized funds and loans to the borrowers.  On Interpreting Federal Bank is facing the decreasing values in both Net NPA and Net Profit. The Bank is weaker in assets and other provisions on looking the relationship is lower in each financial year. Chart 4.2.3 Comparing Net NPA and Net Profit of Federal Bank Interpretation  On interpreting the Federal Bank with Net NPA and Net NPA for the correlation is taken with the negative relationship of -0.23 and lesser profitability in each sector for the bad loans.  In financial year 2013-14 and 2014-15, the Bank is good in maintaining the profit and Net NPA with less credit wise exposures and more profitability in that financial years for the bank performance is good but the bank is aided in at the financial years 2016-17 and 2017-18 as Net NPA values are dominating Net Profit.  Federal Bank is unstable and the operating expenses is also done in the lesser providence of the profit and the major issues are not maintain the organization to plan on next financial year structure to earn profit and to dominate the NPAs from borrowers and to increase shareholders. 321.56 373.27 950.01 941.2 1551.96 -0.231792149 838.89 1,005.75 475.65 830.79 878.85 2013-14 ₹ Crore 2014-15 ₹ Crore 2015-16 ₹ Crore 2016-17 ₹ Crore 2017-18 ₹ Crore Ratio Net NPA and Net Profit with Correlated Ratio Federal Bank NET NPA Federal Bank NET PROFIT
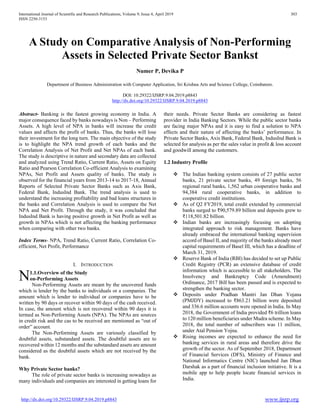
  • 17. International Journal of Scientific and Research Publications, Volume 9, Issue 4, April 2019 319 ISSN 2250-3153 http://dx.doi.org/10.29322/IJSRP.9.04.2019.p8843 www.ijsrp.org 4.2.4 To measure the effect of NPA in Selected Private Sector Banks Performance Table 4.2.7 Pearson Correlation Coefficient Ratio Bank Name Correlation Coefficient Ratio Axis Bank -0.95 IndusInd Bank 0.88 Federal Bank -0.23 Interpretation  Correlation ratio of IndusInd Bank is showing the positive relationship among the NPA and Profitability of bank. The Positive ratio finalize that IndusInd bank is more stable in acquiring profit and funds in each sectors of the loan distributions.  Federal Bank is next to IndusInd Bank in correlation ratio, but it is negative relationship of -0.23 and bank have to be stable and to acquire more profit in associates the funds in each sector and the funding positions of the bank.  Axis Bank is the least negative ratio of -0.95 and facing the major issues in the profit and bank is in condition of loss in each year. The Bank have to take immediate measure in each sectoral sourcing funds and have to take decisions in expenditure to be followed in the organizational functions. Chart 4.2.4 Pearson Correlation Co-efficient Ratio Interpretation  IndusInd Bank is getting Positive Ratio in Correlation Co-efficient and shows the consistent growth in generating net profit and maintain the NPAs values. Next to IndusInd Bank, Federal Bank and Axis Bank is getting negative values in NPA.  IndusInd Bank is showing the positive Hypothesis as it shows the value above 0. The bank is ready to accept the net profit and net gains in understanding the values and functions for increasing the net profits for next year.  The Negative Hypothesis is again hit the Federal Bank by showing value of -0.23. The negative values indicate slight difference to make the positive hypothesis. The Bank has to work on Net Profit and to recover NPA to achieve again success in the future financial years. -0.95 0.88 -0.23 -1.5 -1 -0.5 0 0.5 1 Axis Bank IndusInd Bank Federal Bank Pearson Correlation Co-Efficient
  • 18. International Journal of Scientific and Research Publications, Volume 9, Issue 4, April 2019 320 ISSN 2250-3153 http://dx.doi.org/10.29322/IJSRP.9.04.2019.p8843 www.ijsrp.org V. FINDINGS AND SOLUTIONS 5.1 Findings of the Study  Non-Performing Assets (NPA) is the major causes of each bank and every financial institution. In selected private sector banks, Axis Bank, Federal Bank, IndusInd Bank is having their Net NPA values of ₹30,082.07 crores, ₹4138 crores, ₹1900.85 crores respectively.  The total NPA of three banks is evaluated as ₹36,20.92 crores. The NPA of these three banks is occupying the major NPA values of the private sector banks as market sales and recovery of funds.  The Net Profit and Net NPA is compared in correlation co-efficient ratio to find the comparison among the three selected banks. The ratio is provided with Null Hypothesis and Positive Hypothesis in the three banks.  The expected positive results are changed, by Axis Bank is having the negative hypothesis of -0.9538%. These co-efficient ratio shows that Axis Bank is indeed of getting decreased Net Profit and it reflected as Net Profit of ₹275.68 Crores in 2017-18 with Net NPA of ₹16,592 crores which is doubled of Net Profit.  IndusInd Bank is showing the consistent growth in all five years and the growth is indicating the positive hypothesis of 0.8502%. The bank receives the increasing Net Profit as it indicates in Annual Reports.  This shows that the bank stable in organizing the funds to organizational sectors. In other hand the Net NPA is also increasing for the five years, ₹184.05 crores in 2013-14, ₹214.08 crores in 2014-15, ₹321.75 crores in 2015-16, ₹438.9 crores in 2016-17 and ₹745.67 in 2017-18. This increasing factor of Net NPA will decrease the increasing Net Profit of Banks and may leads to loss in future.  Federal Bank is funded with Negative Hypothesis of -0.2317. The Net NPA and Net Profit of this bank is fluctuating in all consecutive five years. This shows that the bank is unstable and should be positioned in the upcoming financial years. 5.2 Suggestions The management of NPAs is a very challenging task. It requires Preventive measures as well as Curative measures i.e. banks should not only take steps to reduce the present NPAs but also take precaution to avoid future NPAs. Preventive measures include,  Inculcating ethics in borrowers regarding the importance of timely repayment of credit.  Adherence of proper credit appraisal techniques.  Proper evaluation of projects.  Timely sanction and disbursement of credit.  Proper credit monitoring to restrict any misuse and diversion of fund.  assisting borrowers in developing entrepreneurial skill.  Follow up of SLP (security, liquidity and profitability) principle VI. CONCLUSION On concluding three private sector banks for the comparative is based on the sales report and their market values in the banking sectors. The Trend Analysis is used to analysed the GNPA and NNPA factors that are affecting the banking natures. The Correlation effect is compared between three banks and the hypothesis funded with IndusInd Bank is good in recovering the NPA and maintains their Net Profit and can move with the positive outgrowth for next financial years. NPA is the main artery vein of banking sector and other financial institutions to maintain the economy as a growing factors and to increase the country’s profitability. REFERENCES Books [1] An Introduction to Statistical Learning by Gareth James. [2] Statistics and Data Analysis for Financial Engineering: With R Examples by David Ruppert and David S. Matteson. Websites [3] http://campaign.axisbank.com/2018/june/index.html [4] https://www.federalbank.co.in/documents/10180/12548116/Annual+Report +2017-18/582f8313-08ff-4931-b0b3-1e72b045b16c [5] https://www.indusind.com/content/dam/indusind/AnnualReports/2017- 18/2017-18/Indusind-AR2018_R1 AUTHORS First Author – Numer P, III - BBA(CA), Sri Krishna Arts and Science College, Coimbatore, numer1301@gmail.com Second Author – Devika P, Assistant Professor, Sri Krishna Arts and Science College, Coimbatore, pdevikasabari@gmail.com Correspondence Author – Numer P, numer1301@gmail.com, numerp16bba229@skasc.ac.in, +91 93856 55606