Download as PDF, PPTX
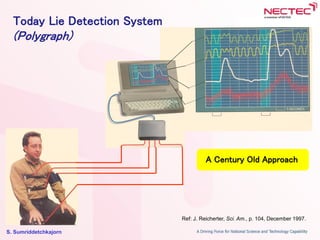
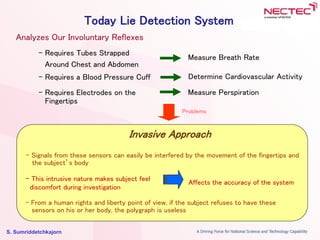

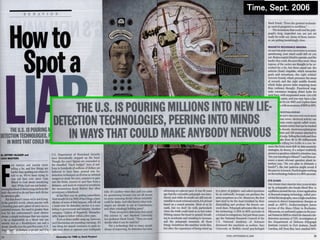
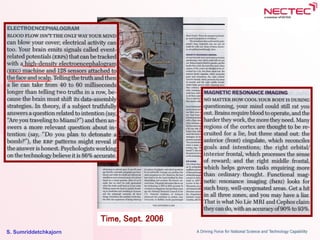
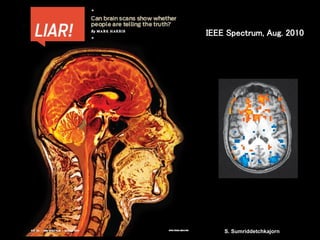
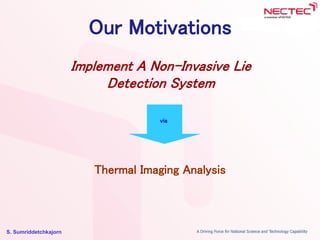
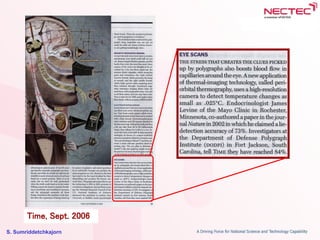
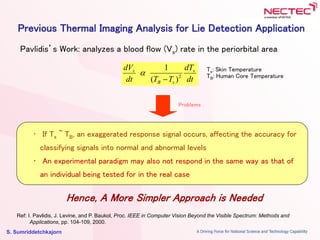
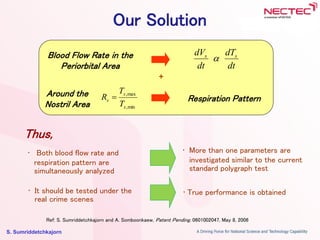
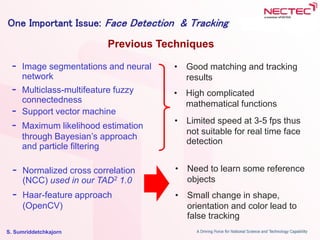

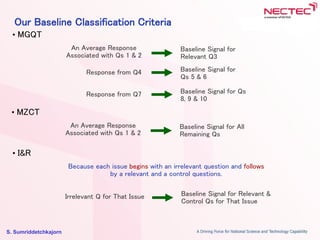
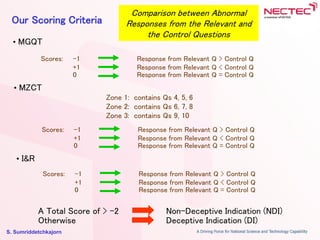
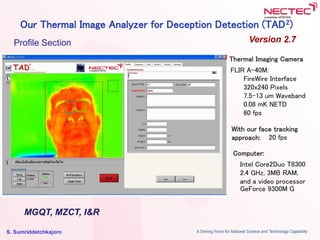
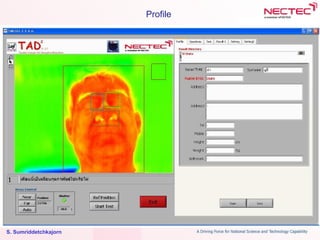
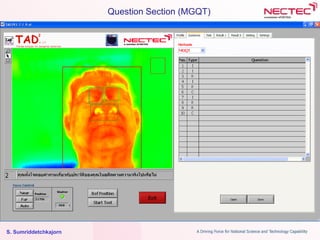
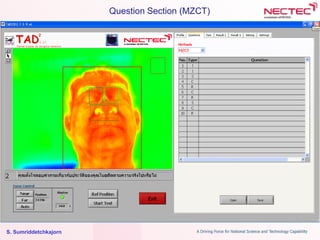
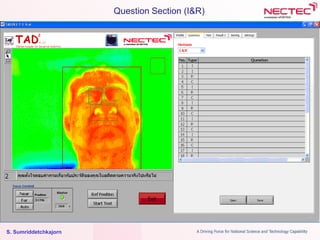
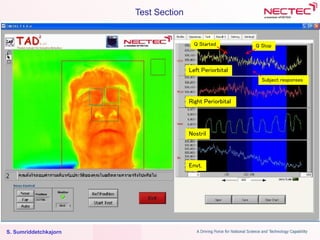
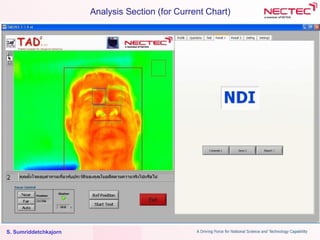
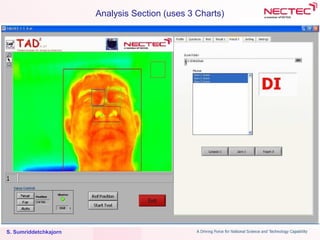

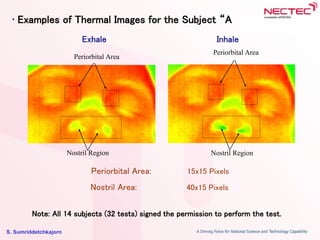
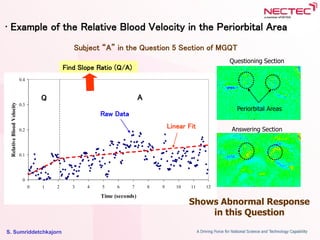
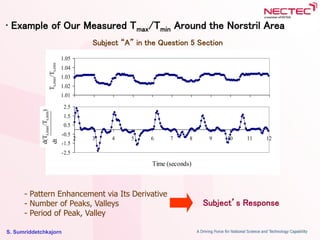
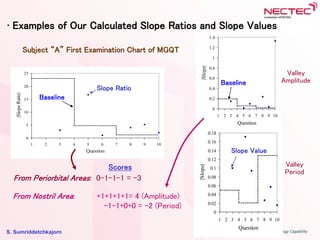
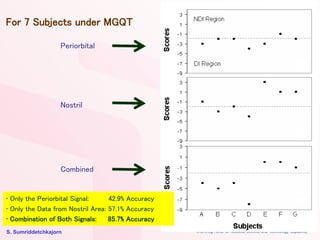
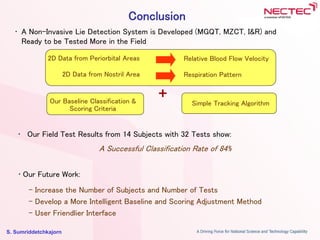

This document describes a non-invasive lie detection system called TAD2 that analyzes thermal images of the face. TAD2 was developed as an alternative to traditional polygraph tests, which require physical sensors be attached to the body. TAD2 uses a thermal camera to track blood flow changes in the periorbital area and respiration patterns by analyzing the nostril area. Field tests on 14 subjects using three standardized questioning techniques showed an 84% accurate classification rate at detecting deception without physical contact. The developers aim to continue improving TAD2 through additional testing and developing more advanced baseline and scoring methods.


![Big Data and Analytics [บริหารและประยุกต์ใช้ (Big) Data]](https://cdn.slidesharecdn.com/ss_thumbnails/20190906bigdataseminarsarun-191024021317-thumbnail.jpg?width=640&height=640&fit=bounds)


