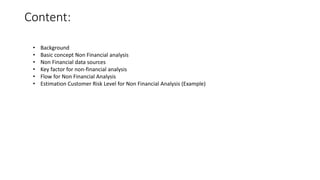
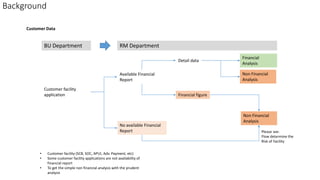
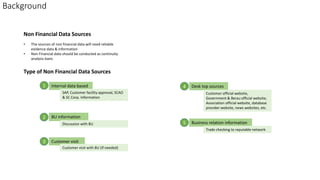
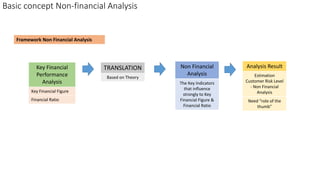
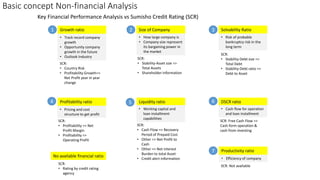
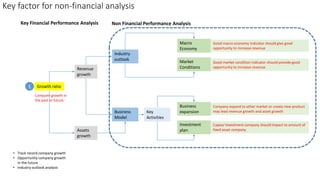
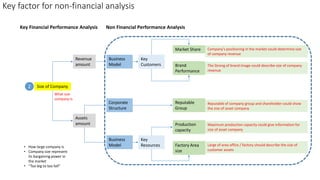
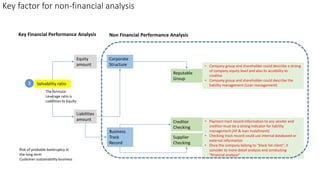
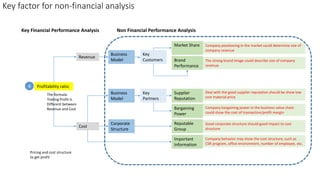
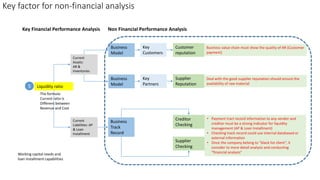
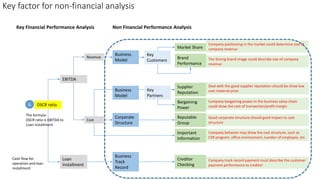
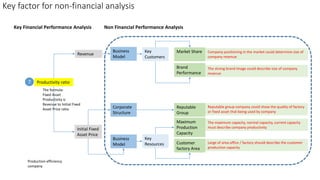
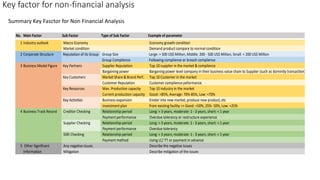
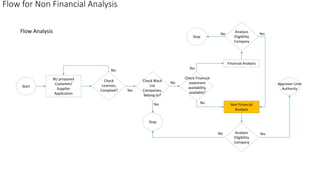
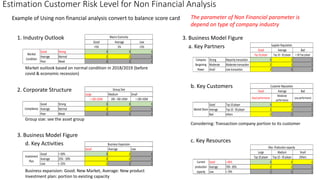
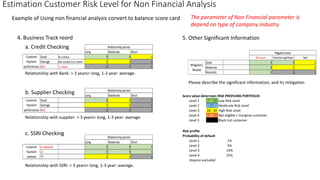
NON FINANCIAL PERFORMANCE ANALYSIS
Based on Key Financial performance
Draft – to be discussed
RM DEPARTMENT
Jakarta, December 2022
Content:
• Background
• Basic concept Non Financial analysis
• Non Financial data sources
• Key factor for non-financial analysis
• Flow for Non Financial Analysis
• Estimation Customer Risk Level for Non Financial Analysis (Example)
Background
Customer facility
application
Available Financial
Report
BU Department
No available Financial
Report
Financial figure
Detail data
RM Department
Non Financial
Analysis
Financial
Analysis
• Customer facility (SCB, SOC, APUI, Adv. Payment, etc)
• Some customer facility applications are not availability of
financial report
• To get the simple non financial analysis with the prudent
analysis
Customer Data
Please see:
Flow determine the
Risk of Facility
Non Financial
Analysis
Non Financial Data Sources
BU information
Business relation information
Customer visit
Desk top sources
Internal data based
SAP, Customer facility approval, SCAO
& SC Corp. Information
Customer official website,
Government & Berau official website,
Association official website, database
provider website, news websites, etc.
Discussion with BU
Customer visit with BU (if needed)
Trade checking to reputable network
1
2
3
4
5
• The sources of non financial data will need reliable
evidence data & information
• Non Financial data should be conducted as continuity
analysis basis
Type of Non Financial Data Sources
Background
Basic concept Non-financial Analysis
Key Financial
Performance
Analysis
TRANSLATION Non Financial
Analysis
Key Financial Figure
Financial Ratio
Based on Theory
The Key Indicators
that influence
strongly to Key
Financial Figure &
Financial Ratio
Analysis Result
Estimation
Customer Risk Level
- Non Financial
Analysis
Framework Non Financial Analysis
Need “role of the
thumb”
Key Financial Performance Analysis vs Sumisho Credit Rating (SCR)
Solvability Ratio
Liquidity ratio
Profitability ratio
Growth ratio Size of Company
DSCR ratio
Productivity ratio
• Track record company
growth
• Opportunity company
growth in the future
• Outlook Industry
• How large company is
• Company size represent
its bargaining power in
the market
• Risk of probable
bankruptcy risk in the
long term
• Pricing and cost
structure to get profit
• Working capital and
loan installment
capabilities
• Cash flow for operation
and loan installment
• Efficiency of company
1 2 3
4 5 6
7
SCR:
• Country Risk
• Profitability Growth=>
Net Profit year in year
change
SCR:
• Stability-Asset size =>
Total Assets
• Shareholder information
SCR:
• Stability-Debt size =>
Total Debt
• Stability-Debt ratio =>
Debt to Asset
SCR:
• Profitability => Net
Profit Margin
• Profitability =>
Operating Profit
SCR:
• Cash Flow => Recovery
Period of Prepaid Cost
• Other => Net Profit to
Cash
• Other => Net interest
Burden to total Asset
• Credit alert information
SCR: Free Cash Flow =>
Cash form operation &
cash from investing
SCR: Not available
SCR:
• Rating by credit rating
agency
No available financial ratio
Basic concept Non-financial Analysis
Key factor for non-financial analysis
Key Financial Performance Analysis Non Financial Performance Analysis
Growth ratio
Revenue
growth
Company growth in
the past or future
Assets
growth
Industry
outlook
Business
Model
Macro
Economy
Market
Conditions
Business
expansion
Investment
plan
Good macro economy indicator should give good
opportunity to increase revenue
Good market condition indicator should provide good
opportunity to increase revenue
Company expand to other market or create new product
may lead revenue growth and asset growth
Capex/ Investment company should impact to amount of
fixed asset company
1
• Track record company growth
• Opportunity company growth
in the future
• Industry outlook analysis
Key
Activities
Key factor for non-financial analysis
Key Financial Performance Analysis Non Financial Performance Analysis
Size of Company
Revenue
amount
What size
company is
Assets
amount
Market Share
Brand
Performance
Reputable
Group
Production
capacity
Company’s positioning in the market could determine size
of company revenue
The Strong of brand image could describe size of company
revenue
Reputable of company group and shareholder could show
the size of asset company
Maximum production capacity could give information for
size of asset company
2
Factory Area
size
Large of area office / factory should describe the size of
customer assets
• How large company is
• Company size represent
its bargaining power in
the market
• “Too big to too fall”
Business
Model
Key
Customers
Corporate
Structure
Business
Model
Key
Resources
Key factor for non-financial analysis
Key Financial Performance Analysis Non Financial Performance Analysis
Solvability ratio
Equity
amount
Risk of probable bankruptcy in
the long term
Customer sustainability business
Liabilities
amount
Reputable
Group
Creditor
Checking
• Company group and shareholder could describe a strong
of company equity level and also its accebility to
creditor.
• Company group and shareholder could describe the
liability management (Loan management)
• Payment tract record information to any vendor and
creditor must be a strong indicator for liability
management (AP & loan installment)
• Checking track record could use internal databased or
external information
• Once the company belong to “black list client”, it
consider to more detail analysis and conducting
“financial analysis”
3
The formula:
Leverage ratio is
Liabilities to Equity
Corporate
Structure
Business
Track
Record
Supplier
Checking
Key factor for non-financial analysis
Key Financial Performance Analysis Non Financial Performance Analysis
Profitability ratio
Revenue
Cost
Market Share
Important
Information
Deal with the good supplier reputation should be show low
cost material price
4
The formula:
Trading Profit is
Different between
Revenue and Cost
Brand
Performance
Company positioning in the market could determine size of
company revenue
The strong brand image could describe size of company
revenue
Supplier
Reputation
Bargaining
Power
Reputable
Group
Company bargaining power in the business value chain
could show the cost of transaction/profit margin
Good corporate structure should good impact to cost
structure
Company behavior may show the cost structure, such as
CSR program, office environment, number of employee, etc.
Pricing and cost structure
to get profit
Business
Model
Key
Customers
Corporate
Structure
Key
Partners
Business
Model
Key factor for non-financial analysis
Key Financial Performance Analysis Non Financial Performance Analysis
Liquidity ratio
Current
Assets:
AR &
Inventories
Current
Liabilities: AP
& Loan
Installment
Customer
reputation
5
The formula:
Current ratio is
Different between
Revenue and Cost
Business value chain must show the quality of AR (Customer
payment)
Deal with the good supplier reputation should ensure the
availability of raw material
Supplier
Reputation
Working capital needs and
loan installment capabilities
Business
Model
Key
Customers
Business
Model
Key
Partners
Business
Track
Record
Creditor
Checking
• Payment tract record information to any vendor and
creditor must be a strong indicator for liquidity
management (AP & Loan Installment)
• Checking track record could use internal databased or
external information
• Once the company belong to “black list client”, it
consider to more detail analysis and conducting
“financial analysis”
Supplier
Checking
Key factor for non-financial analysis
Key Financial Performance Analysis Non Financial Performance Analysis
DSCR ratio
EBITDA
Loan
Installment
6
The formula:
DSCR ratio is EBITDA to
Loan installment
Creditor
Checking
Company track record payment must describe the customer
payment performance to creditor
Revenue
Cost
Market Share
Important
Information
Deal with the good supplier reputation should be show low
cost material price
Brand
Performance
Company positioning in the market could determine size of
company revenue
The Strong brand image could describe size of company
revenue
Supplier
Reputation
Bargaining
Power
Reputable
Group
Company bargaining power in the business value chain
could show the cost of transaction/profit margin
Good corporate structure should good impact to cost
structure
Company behavior may show the cost structure, such as
CSR program, office environment, number of employee, etc.
Cash flow for
operation and loan
installment
Business
Model
Key
Customers
Corporate
Structure
Key
Partners
Business
Model
Business
Track
Record
Key factor for non-financial analysis
Key Financial Performance Analysis Non Financial Performance Analysis
Productivity ratio
Revenue
Production efficiency
company
Initial Fixed
Asset Price
7
The formula:
Fixed Asset
Productivity is
Revenue to Initial Fixed
Asset Price ratio
Market Share
Customer
factory Area
Reputable group company could show the quality of factory
or fixed asset that being used by company
Brand
Performance
Company positioning in the market could determine size of
company revenue
The strong brand image could describe size of company
revenue
Reputable
Group
Maximum
Production
Capacity
The maximum capacity, normal capacity, current capacity
must describe company productivity
Large of area office / factory should describe the customer
production capacity
Business
Model
Key
Customers
Corporate
Structure
Business
Model
Key
Resources
Key factor for non-financial analysis
Summary Key Fasctor for Non Financial Analysis
No. Main Factor Sub Factor Type of Sub Factor Example of parameter
1 Industry outlook Macro Economy Economy growth condition
Market condition Demand product compare to normal condition
2 Corporate Structure Reputation of its Group Group Size Large: > 500 US$ Million, Middle: 200 - 500 US$ Million, Small: < 200 US$ Million
Group Complience Following complience or breach complience
3 Business Model Figure Key Partners Supplier Reputation Top 10 supplier in the market & complience
Bargaining power Barganing power level company in their business value chain to Supplier (such as dominity transaction)
Key Customers Market Share & Brand Perf. Top 10 Customer in the market
Customer Reputation Customer complience peformance
Key Resources Max. Production capacity Top 10 industry in the market
Current production capacity Good: >85%, Average: 70%-85%, Low: <70%
Key Activities Business expansion Eneter into new market, produce new product, etc
Investment plan from existing facility => Good: >50%, 25%- 50%, Low: <25%
4 Business Track Record Creditor Checking Relationship period Long: > 3 years, moderate: 1 - 3 years, short: < 1 year
Payment performance Overdue tolerancy or restructure experience
Supplier Checking Relationship period Long: > 3 years, moderate: 1 - 3 years, short: < 1 year
Payment performance Overdue tolerancy
SSRI Checking Relationship period Long: > 3 years, moderate: 1 - 3 years, short: < 1 year
Payment method Using LC/ TT or payment in advance
5 Any negative issues Describe the negative issues
Mitigation Describe mitigation of the issues
Other Significant
Information
Flow for Non Financial Analysis
Start
BU proposed
Customer/
Supplier
Application
Check
Licenses,
Complied?
Check Black
List
Companies,
belong to?
Check Financial
statement
availability,
available?
Financial Analysis
Non Financial
Analysis
Analysis
Eligibility
Company
Analysis
Eligibility
Company
Stop
Approver Limit
Authority
Stop
No
No
Yes
No
No
Yes
Yes
Yes
Yes
No
Flow Analysis
Estimation Customer Risk Level for Non Financial Analysis
Example of Using non financial analysis convert to balance score card
1. Industry Outlook
Good Average Low
>5% 5% <5%
Good Strong 3 3 3
Average Normal 2 2 1
Poor Weak 1 1 1
Market
Condition
Macro Economy
Market outlook based on normal condition in 2018/2019 (before
covid & economic recession)
2. Corporate Structure
Large Medium Small
> 500 US$M 200 - 500 US$M < 200 US$M
Good Strong 3 3 3
Average Normal 2 2 1
Poor Weak 1 1 1
Complience
Group Size
Group size: see the asset group
3. Business Model Figure
a. Key Partners Good Average Bad
Top 10 player Top 10 - 50 player < 50 Top player
Strong Mayority transaction 3 2 1
Moderate Moderate transaction 2 2 1
Small Low transaction 2 1 1
Company
Bargaining
Power
Supplier Reputation
b. Key Customers
Good Average Bad
Good performance
Moderate
performance
Low performance
Good Top 10 player 3 2 1
Average Top 10 - 50 player 2 2 1
Bad others 2 1 1
MarketShare
Customer Reputation
Considering: Transaction company portion to its customer
c. Key Resources
d. Key Activities
3. Business Model Figure
Good Average Low
Good > 50% 3 2 1
Average 25% - 50% 2 2 1
Low < 25% 2 1 1
Investment
Plan
Business Expansion
Business expansion: Good: New Market, Average: New product
Investment plan: portion to existing capacity
The parameter of Non Financial parameter is
depend on type of company industry
Large Medium Small
Top 10 player Top 10 - 50 player Others
Good > 85% 3 2 2
Average 70% - 85% 2 2 1
Low < 70% 1 1 1
Max .Production capacity
Current
production
capacity
Estimation Customer Risk Level for Non Financial Analysis
Example of Using non financial analysis convert to balance score card
4. Business Track reord
Relationship with Bank: > 3 years= long, 1-3 year: average.
5. Other Significant Information
b. Supplier Checking
c. SSRI Checking
The parameter of Non Financial parameter is
depend on type of company industry
a. Credit Checking
Long Moderate Short
Good No overdue 3 3 2
Average Max overdue 0 to 2 weeks 2 2 1
Bad > 2 weeks 1 1 1
Customer
Payment
performance
Relationship period
Long Moderate Short
Good 3 2 1
Average 2 2 1
Bad 1 1 1
Customer
Payment
performance
Relationship period
Relationship with supplier: > 3 years= long, 1-3 year: average.
Long Moderate Short
In advance 3 3 3
LC 3 3 3
TT 2 2 1
Customer
Payment
method
Relationship period
Relationship with SSRI: > 3 years= long, 1-3 year: average.
No issues Potential significant Bad
Good 3 3 2
Moderate 3 2 2
Pesimistic 3 1 1
Mitigation/
Resolve
Negative issue
Please describe the significant information, and its mitigation
Score value determain RISK PROFILING PORTFOLIO
Level 1 > 24 Low Risk Level
Level 2 21 - 23 Moderate Risk Level
Level 3 18 - 20 High Risk Level
Level 4 < 18 Not eligible / marginal customer
Level 5 Black List customer
Risk profile
Probability of default
Level 1 1%
Level 2 5%
Level 3 10%
Level 4 25%
Impaire excluded
THANK YOU

Non Financial Analysis.pptx

  • 1.
    NON FINANCIAL PERFORMANCEANALYSIS Based on Key Financial performance Draft – to be discussed RM DEPARTMENT Jakarta, December 2022
  • 2.
    Content: • Background • Basicconcept Non Financial analysis • Non Financial data sources • Key factor for non-financial analysis • Flow for Non Financial Analysis • Estimation Customer Risk Level for Non Financial Analysis (Example)
  • 3.
    Background Customer facility application Available Financial Report BUDepartment No available Financial Report Financial figure Detail data RM Department Non Financial Analysis Financial Analysis • Customer facility (SCB, SOC, APUI, Adv. Payment, etc) • Some customer facility applications are not availability of financial report • To get the simple non financial analysis with the prudent analysis Customer Data Please see: Flow determine the Risk of Facility Non Financial Analysis
  • 4.
    Non Financial DataSources BU information Business relation information Customer visit Desk top sources Internal data based SAP, Customer facility approval, SCAO & SC Corp. Information Customer official website, Government & Berau official website, Association official website, database provider website, news websites, etc. Discussion with BU Customer visit with BU (if needed) Trade checking to reputable network 1 2 3 4 5 • The sources of non financial data will need reliable evidence data & information • Non Financial data should be conducted as continuity analysis basis Type of Non Financial Data Sources Background
  • 5.
    Basic concept Non-financialAnalysis Key Financial Performance Analysis TRANSLATION Non Financial Analysis Key Financial Figure Financial Ratio Based on Theory The Key Indicators that influence strongly to Key Financial Figure & Financial Ratio Analysis Result Estimation Customer Risk Level - Non Financial Analysis Framework Non Financial Analysis Need “role of the thumb”
  • 6.
    Key Financial PerformanceAnalysis vs Sumisho Credit Rating (SCR) Solvability Ratio Liquidity ratio Profitability ratio Growth ratio Size of Company DSCR ratio Productivity ratio • Track record company growth • Opportunity company growth in the future • Outlook Industry • How large company is • Company size represent its bargaining power in the market • Risk of probable bankruptcy risk in the long term • Pricing and cost structure to get profit • Working capital and loan installment capabilities • Cash flow for operation and loan installment • Efficiency of company 1 2 3 4 5 6 7 SCR: • Country Risk • Profitability Growth=> Net Profit year in year change SCR: • Stability-Asset size => Total Assets • Shareholder information SCR: • Stability-Debt size => Total Debt • Stability-Debt ratio => Debt to Asset SCR: • Profitability => Net Profit Margin • Profitability => Operating Profit SCR: • Cash Flow => Recovery Period of Prepaid Cost • Other => Net Profit to Cash • Other => Net interest Burden to total Asset • Credit alert information SCR: Free Cash Flow => Cash form operation & cash from investing SCR: Not available SCR: • Rating by credit rating agency No available financial ratio Basic concept Non-financial Analysis
  • 7.
    Key factor fornon-financial analysis Key Financial Performance Analysis Non Financial Performance Analysis Growth ratio Revenue growth Company growth in the past or future Assets growth Industry outlook Business Model Macro Economy Market Conditions Business expansion Investment plan Good macro economy indicator should give good opportunity to increase revenue Good market condition indicator should provide good opportunity to increase revenue Company expand to other market or create new product may lead revenue growth and asset growth Capex/ Investment company should impact to amount of fixed asset company 1 • Track record company growth • Opportunity company growth in the future • Industry outlook analysis Key Activities
  • 8.
    Key factor fornon-financial analysis Key Financial Performance Analysis Non Financial Performance Analysis Size of Company Revenue amount What size company is Assets amount Market Share Brand Performance Reputable Group Production capacity Company’s positioning in the market could determine size of company revenue The Strong of brand image could describe size of company revenue Reputable of company group and shareholder could show the size of asset company Maximum production capacity could give information for size of asset company 2 Factory Area size Large of area office / factory should describe the size of customer assets • How large company is • Company size represent its bargaining power in the market • “Too big to too fall” Business Model Key Customers Corporate Structure Business Model Key Resources
  • 9.
    Key factor fornon-financial analysis Key Financial Performance Analysis Non Financial Performance Analysis Solvability ratio Equity amount Risk of probable bankruptcy in the long term Customer sustainability business Liabilities amount Reputable Group Creditor Checking • Company group and shareholder could describe a strong of company equity level and also its accebility to creditor. • Company group and shareholder could describe the liability management (Loan management) • Payment tract record information to any vendor and creditor must be a strong indicator for liability management (AP & loan installment) • Checking track record could use internal databased or external information • Once the company belong to “black list client”, it consider to more detail analysis and conducting “financial analysis” 3 The formula: Leverage ratio is Liabilities to Equity Corporate Structure Business Track Record Supplier Checking
  • 10.
    Key factor fornon-financial analysis Key Financial Performance Analysis Non Financial Performance Analysis Profitability ratio Revenue Cost Market Share Important Information Deal with the good supplier reputation should be show low cost material price 4 The formula: Trading Profit is Different between Revenue and Cost Brand Performance Company positioning in the market could determine size of company revenue The strong brand image could describe size of company revenue Supplier Reputation Bargaining Power Reputable Group Company bargaining power in the business value chain could show the cost of transaction/profit margin Good corporate structure should good impact to cost structure Company behavior may show the cost structure, such as CSR program, office environment, number of employee, etc. Pricing and cost structure to get profit Business Model Key Customers Corporate Structure Key Partners Business Model
  • 11.
    Key factor fornon-financial analysis Key Financial Performance Analysis Non Financial Performance Analysis Liquidity ratio Current Assets: AR & Inventories Current Liabilities: AP & Loan Installment Customer reputation 5 The formula: Current ratio is Different between Revenue and Cost Business value chain must show the quality of AR (Customer payment) Deal with the good supplier reputation should ensure the availability of raw material Supplier Reputation Working capital needs and loan installment capabilities Business Model Key Customers Business Model Key Partners Business Track Record Creditor Checking • Payment tract record information to any vendor and creditor must be a strong indicator for liquidity management (AP & Loan Installment) • Checking track record could use internal databased or external information • Once the company belong to “black list client”, it consider to more detail analysis and conducting “financial analysis” Supplier Checking
  • 12.
    Key factor fornon-financial analysis Key Financial Performance Analysis Non Financial Performance Analysis DSCR ratio EBITDA Loan Installment 6 The formula: DSCR ratio is EBITDA to Loan installment Creditor Checking Company track record payment must describe the customer payment performance to creditor Revenue Cost Market Share Important Information Deal with the good supplier reputation should be show low cost material price Brand Performance Company positioning in the market could determine size of company revenue The Strong brand image could describe size of company revenue Supplier Reputation Bargaining Power Reputable Group Company bargaining power in the business value chain could show the cost of transaction/profit margin Good corporate structure should good impact to cost structure Company behavior may show the cost structure, such as CSR program, office environment, number of employee, etc. Cash flow for operation and loan installment Business Model Key Customers Corporate Structure Key Partners Business Model Business Track Record
  • 13.
    Key factor fornon-financial analysis Key Financial Performance Analysis Non Financial Performance Analysis Productivity ratio Revenue Production efficiency company Initial Fixed Asset Price 7 The formula: Fixed Asset Productivity is Revenue to Initial Fixed Asset Price ratio Market Share Customer factory Area Reputable group company could show the quality of factory or fixed asset that being used by company Brand Performance Company positioning in the market could determine size of company revenue The strong brand image could describe size of company revenue Reputable Group Maximum Production Capacity The maximum capacity, normal capacity, current capacity must describe company productivity Large of area office / factory should describe the customer production capacity Business Model Key Customers Corporate Structure Business Model Key Resources
  • 14.
    Key factor fornon-financial analysis Summary Key Fasctor for Non Financial Analysis No. Main Factor Sub Factor Type of Sub Factor Example of parameter 1 Industry outlook Macro Economy Economy growth condition Market condition Demand product compare to normal condition 2 Corporate Structure Reputation of its Group Group Size Large: > 500 US$ Million, Middle: 200 - 500 US$ Million, Small: < 200 US$ Million Group Complience Following complience or breach complience 3 Business Model Figure Key Partners Supplier Reputation Top 10 supplier in the market & complience Bargaining power Barganing power level company in their business value chain to Supplier (such as dominity transaction) Key Customers Market Share & Brand Perf. Top 10 Customer in the market Customer Reputation Customer complience peformance Key Resources Max. Production capacity Top 10 industry in the market Current production capacity Good: >85%, Average: 70%-85%, Low: <70% Key Activities Business expansion Eneter into new market, produce new product, etc Investment plan from existing facility => Good: >50%, 25%- 50%, Low: <25% 4 Business Track Record Creditor Checking Relationship period Long: > 3 years, moderate: 1 - 3 years, short: < 1 year Payment performance Overdue tolerancy or restructure experience Supplier Checking Relationship period Long: > 3 years, moderate: 1 - 3 years, short: < 1 year Payment performance Overdue tolerancy SSRI Checking Relationship period Long: > 3 years, moderate: 1 - 3 years, short: < 1 year Payment method Using LC/ TT or payment in advance 5 Any negative issues Describe the negative issues Mitigation Describe mitigation of the issues Other Significant Information
  • 15.
    Flow for NonFinancial Analysis Start BU proposed Customer/ Supplier Application Check Licenses, Complied? Check Black List Companies, belong to? Check Financial statement availability, available? Financial Analysis Non Financial Analysis Analysis Eligibility Company Analysis Eligibility Company Stop Approver Limit Authority Stop No No Yes No No Yes Yes Yes Yes No Flow Analysis
  • 16.
    Estimation Customer RiskLevel for Non Financial Analysis Example of Using non financial analysis convert to balance score card 1. Industry Outlook Good Average Low >5% 5% <5% Good Strong 3 3 3 Average Normal 2 2 1 Poor Weak 1 1 1 Market Condition Macro Economy Market outlook based on normal condition in 2018/2019 (before covid & economic recession) 2. Corporate Structure Large Medium Small > 500 US$M 200 - 500 US$M < 200 US$M Good Strong 3 3 3 Average Normal 2 2 1 Poor Weak 1 1 1 Complience Group Size Group size: see the asset group 3. Business Model Figure a. Key Partners Good Average Bad Top 10 player Top 10 - 50 player < 50 Top player Strong Mayority transaction 3 2 1 Moderate Moderate transaction 2 2 1 Small Low transaction 2 1 1 Company Bargaining Power Supplier Reputation b. Key Customers Good Average Bad Good performance Moderate performance Low performance Good Top 10 player 3 2 1 Average Top 10 - 50 player 2 2 1 Bad others 2 1 1 MarketShare Customer Reputation Considering: Transaction company portion to its customer c. Key Resources d. Key Activities 3. Business Model Figure Good Average Low Good > 50% 3 2 1 Average 25% - 50% 2 2 1 Low < 25% 2 1 1 Investment Plan Business Expansion Business expansion: Good: New Market, Average: New product Investment plan: portion to existing capacity The parameter of Non Financial parameter is depend on type of company industry Large Medium Small Top 10 player Top 10 - 50 player Others Good > 85% 3 2 2 Average 70% - 85% 2 2 1 Low < 70% 1 1 1 Max .Production capacity Current production capacity
  • 17.
    Estimation Customer RiskLevel for Non Financial Analysis Example of Using non financial analysis convert to balance score card 4. Business Track reord Relationship with Bank: > 3 years= long, 1-3 year: average. 5. Other Significant Information b. Supplier Checking c. SSRI Checking The parameter of Non Financial parameter is depend on type of company industry a. Credit Checking Long Moderate Short Good No overdue 3 3 2 Average Max overdue 0 to 2 weeks 2 2 1 Bad > 2 weeks 1 1 1 Customer Payment performance Relationship period Long Moderate Short Good 3 2 1 Average 2 2 1 Bad 1 1 1 Customer Payment performance Relationship period Relationship with supplier: > 3 years= long, 1-3 year: average. Long Moderate Short In advance 3 3 3 LC 3 3 3 TT 2 2 1 Customer Payment method Relationship period Relationship with SSRI: > 3 years= long, 1-3 year: average. No issues Potential significant Bad Good 3 3 2 Moderate 3 2 2 Pesimistic 3 1 1 Mitigation/ Resolve Negative issue Please describe the significant information, and its mitigation Score value determain RISK PROFILING PORTFOLIO Level 1 > 24 Low Risk Level Level 2 21 - 23 Moderate Risk Level Level 3 18 - 20 High Risk Level Level 4 < 18 Not eligible / marginal customer Level 5 Black List customer Risk profile Probability of default Level 1 1% Level 2 5% Level 3 10% Level 4 25% Impaire excluded
  • 18.