This workbook was developed to assist candidates in preparing for the National Institute of Securities Markets' Equity Derivatives Certification Examination. The workbook covers basics of equity derivatives trading in India, including strategies using equity futures and options, the clearing and settlement process, risk management, and the regulatory environment. It aims to provide a common minimum level of knowledge for professionals working in equity derivatives at exchanges or brokerages.


![21
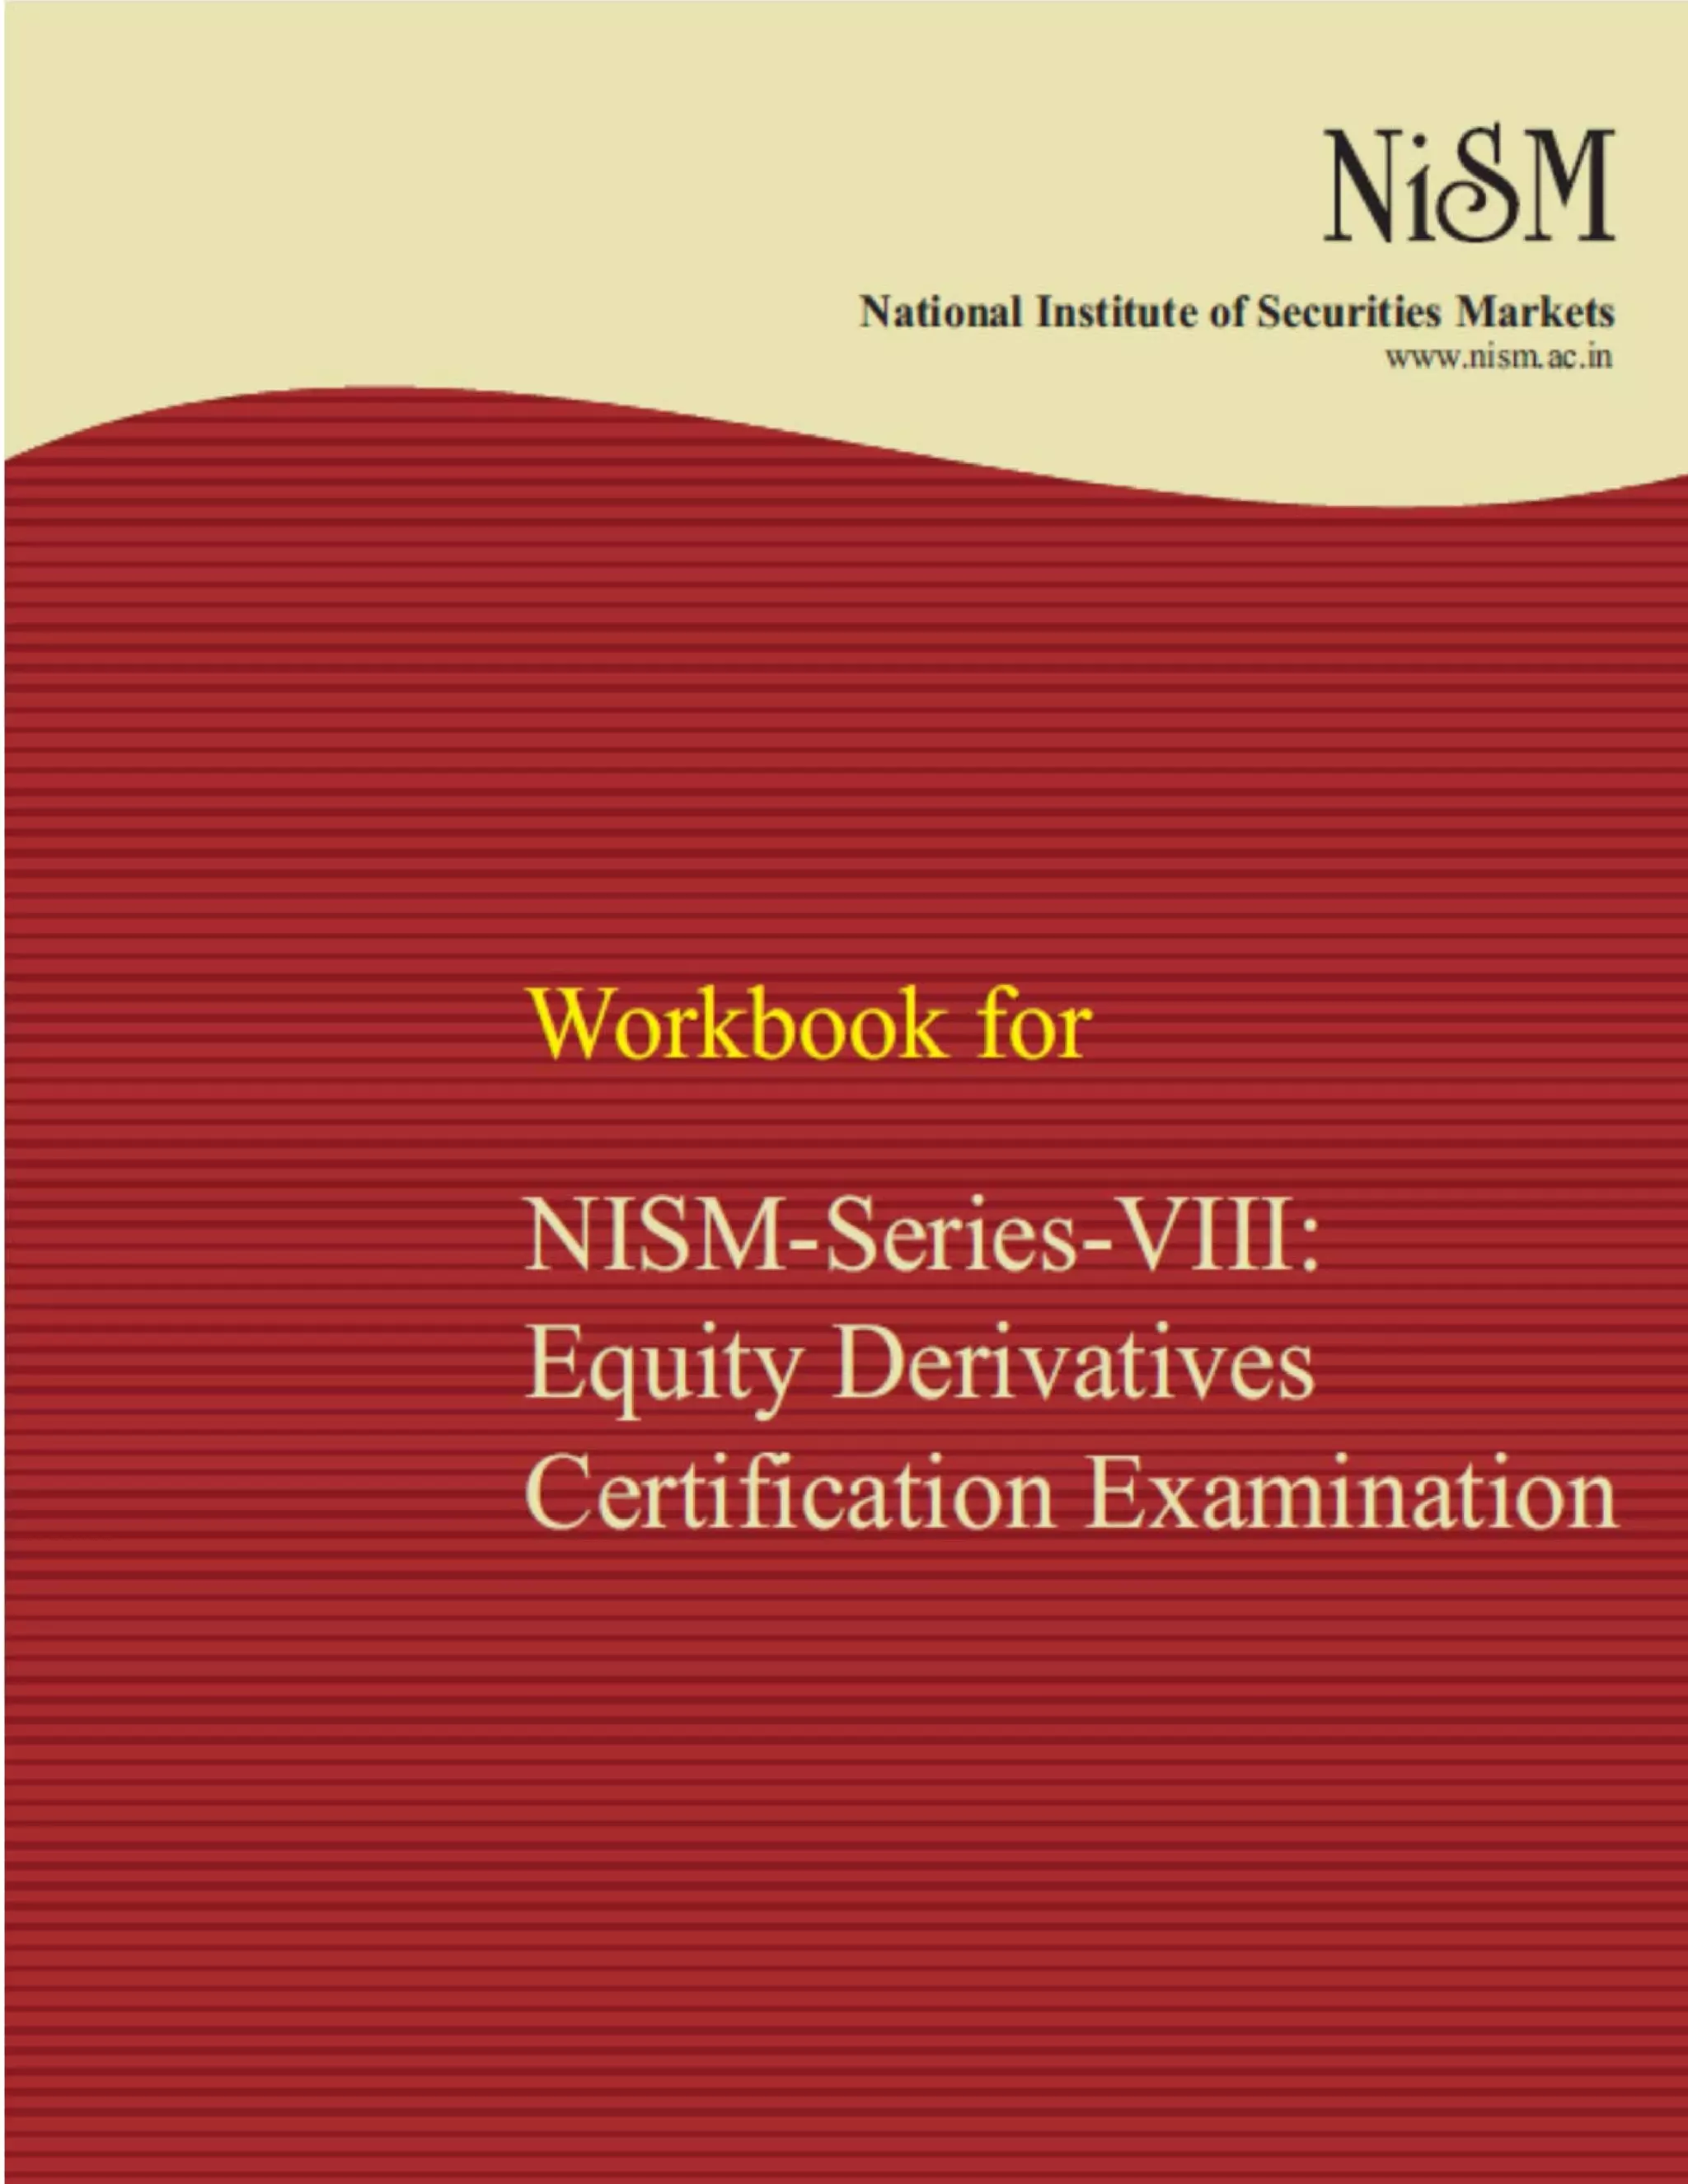
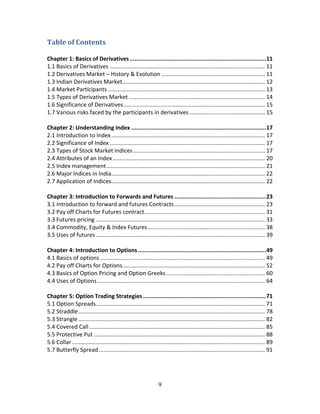
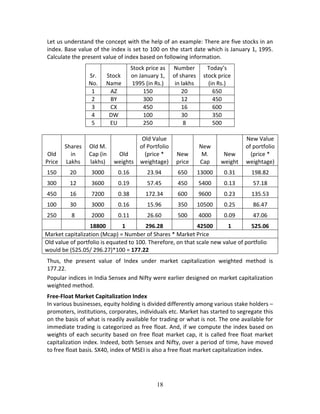
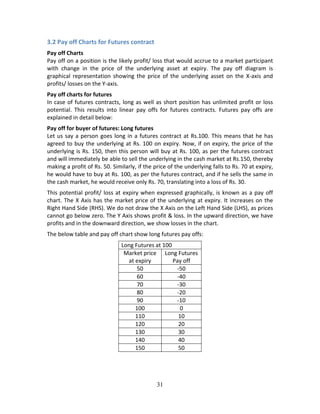
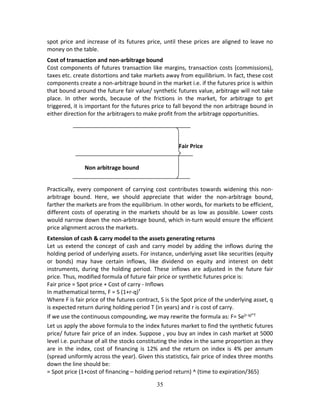
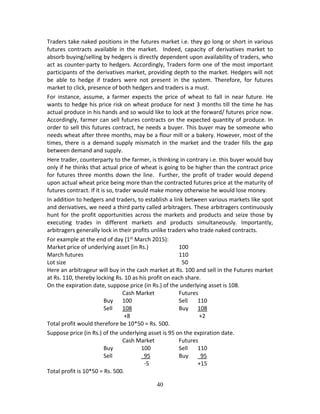
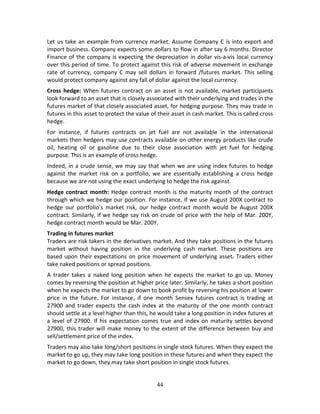
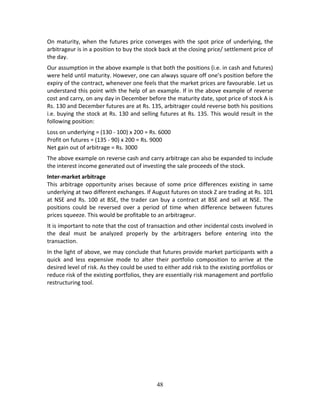
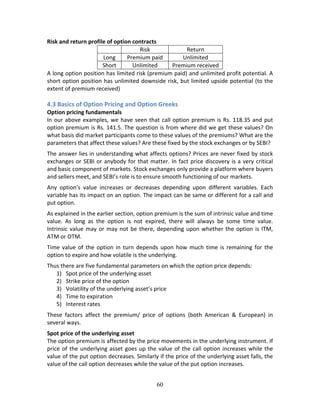
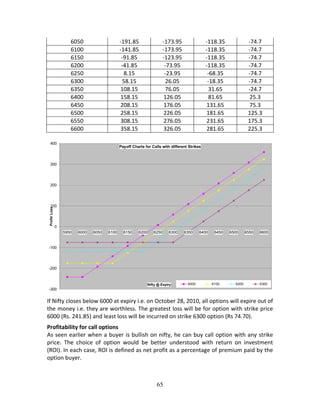
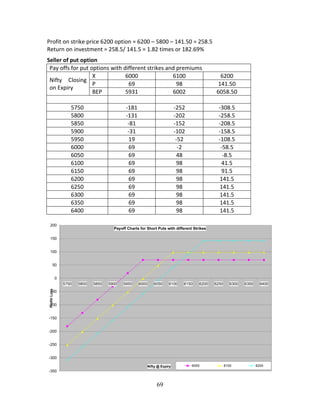
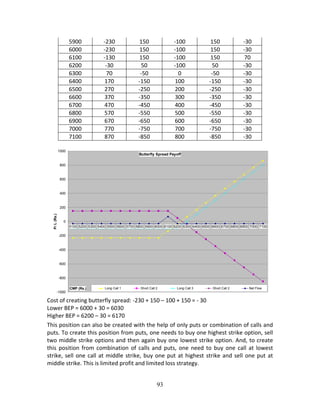
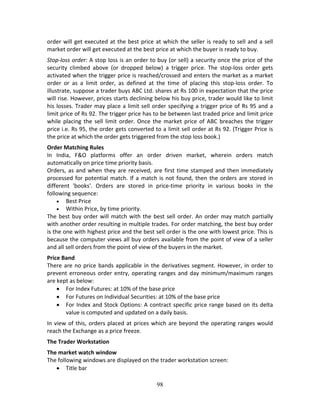
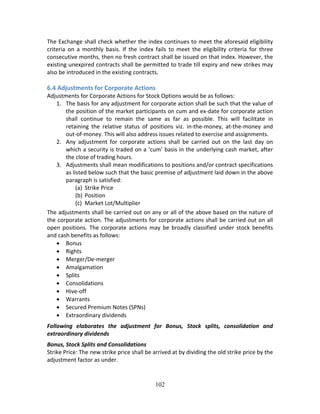
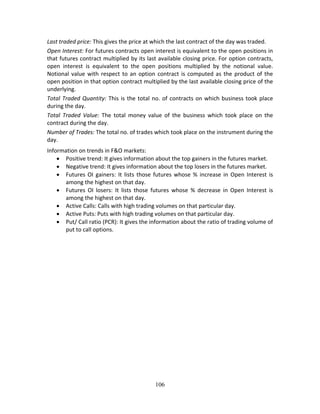
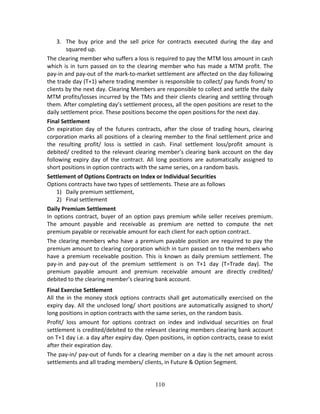
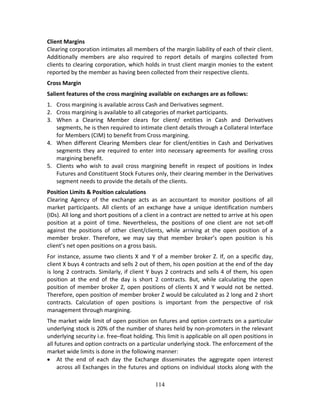
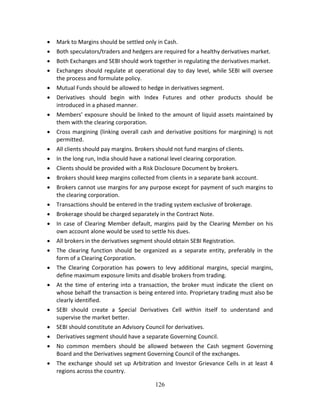
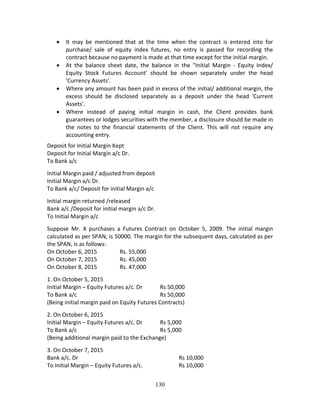
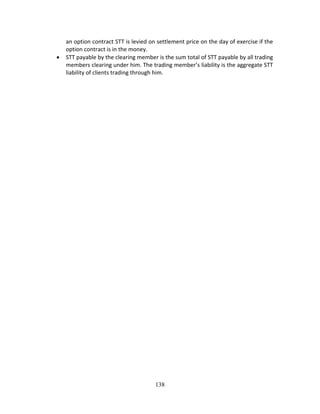
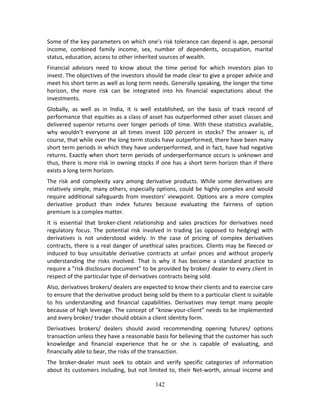
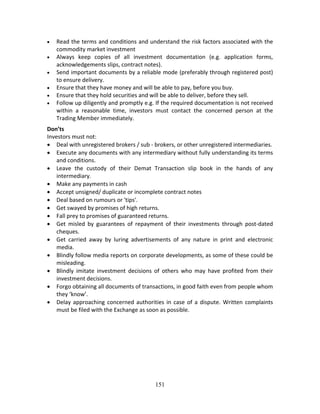
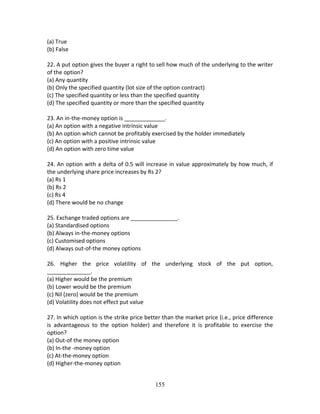
There is increase in the transaction cost for an order size of 3000 shares in comparison
to the transaction cost for order for 100 shares. The “bid‐ask spread” therefore conveys
transaction cost for small trade.
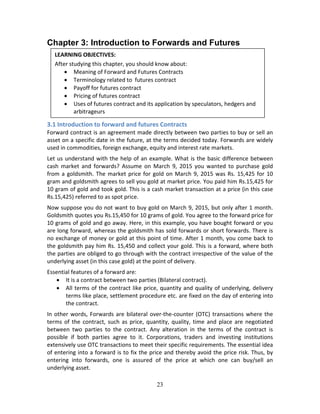
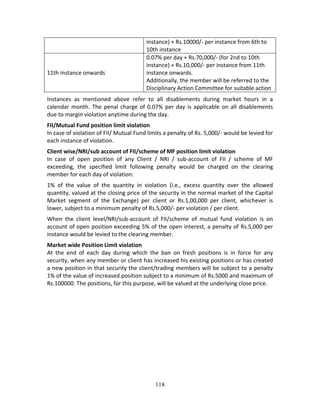
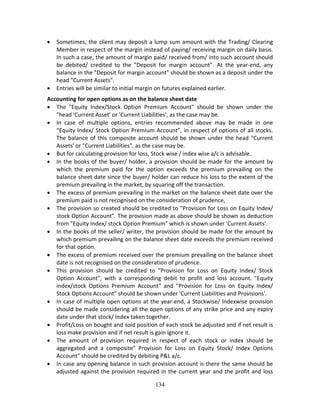
Now, we come across the term called impact cost. We have to start by defining the ideal
price as the average of the best bid and offer price. In our example it is (4+4.50)/2, i.e.
Rs. 4.25. In an infinitely liquid market, it would be possible to execute large transactions
on both buy and sell at prices that are very close to the ideal price of Rs.4.25. However,
while actually trading, you will pay more than Rs.4.25 per share while buying and will
receive less than Rs.4.25 per share while selling. Percentage degradation, which is
experienced vis‐à‐vis the ideal price, when shares are bought or sold, is called impact
cost. Impact cost varies with transaction size. Also, it would be different for buy side and
sell side.
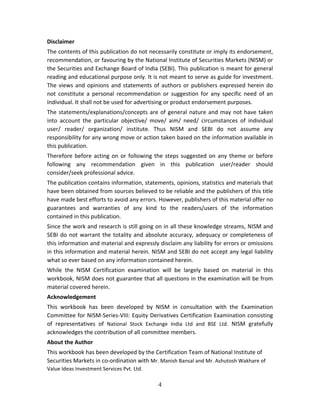
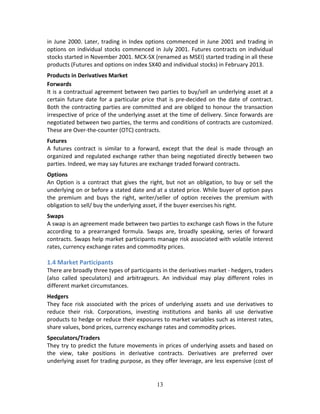
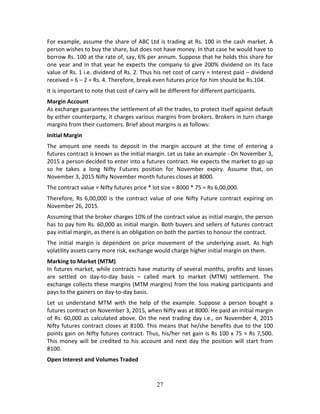
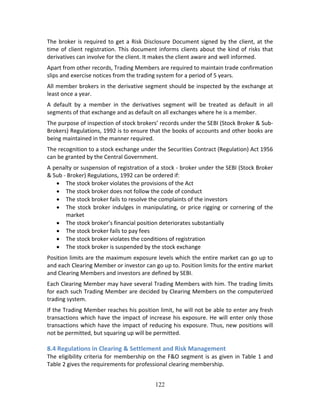
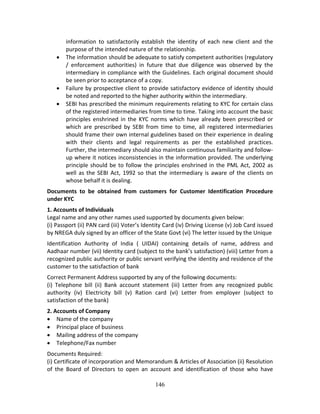
Buy Quantity Buy Price (in Rs.) Sell Price (in Rs.) Sell Quantity
1000 9.80 9.90 1000
2000 9.70 10.00 1500
3000 9.60 10.10 1000
To buy 1500 shares, Ideal price = (9.8+9.9)/ 2 = Rs.9.85
Actual buy price = [(1000*9.9)+(500*10.00)]/1500 = Rs.9.93
Impact cost for (1500 shares) = {(9.93 ‐ 9.85)/9.85}*100 = 0.84 %
2.5 Index management
Index construction, maintenance and revision process is generally done by specialized
agencies. For instance, all NSE indices are managed by a separate company called “India
Index Services and Products Ltd. (IISL)”, a joint venture between Standard and Poor’s
(S&P), National Stock Exchange (NSE) and CRISIL Ltd. (Now a part of Standard & Poor’s).
Index construction is all about choosing the index stocks and deciding on the index
calculation methodology. Maintenance means adjusting the index for corporate actions
like bonus issue, rights issue, stock split, consolidation, mergers etc. Revision of index
deals with change in the composition of index as such i.e. replacing some existing stocks
by the new ones because of change in the trading paradigm of the stocks / interest of
market participants.
Index Construction
A good index is a trade‐off between diversification and liquidity. A well diversified index
reflects the behaviour of the overall market/ economy. While diversification helps in
reducing risk, beyond a point it may not help in the context. Going from 10 stocks to 20
stocks gives a sharp reduction in risk. Going from 50 stocks to 100 stocks gives very little
reduction in risk. Going beyond 100 stocks gives almost zero reduction in risk. Hence,
there is little to gain by diversifying beyond a point.
Stocks in the index are chosen based on certain pre‐determined qualitative and
quantitative parameters, laid down by the Index Construction Managers. Once a stock
satisfies the eligibility criterion, it is entitled for inclusion in the index. Generally, final](https://image.slidesharecdn.com/equityderivativesworkbookversionsep-2015-160707104606/85/NISM-Series-VIII-Equity-Derivatives-22-320.jpg)
![36
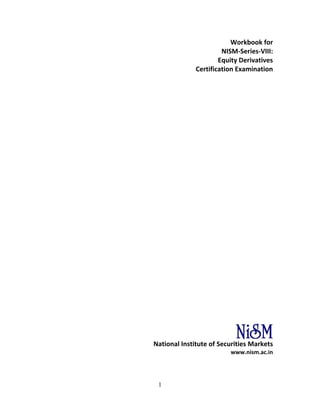
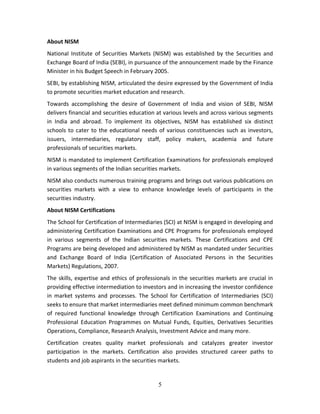
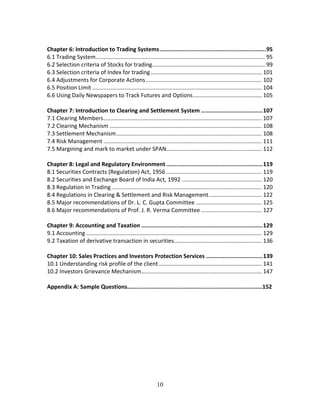
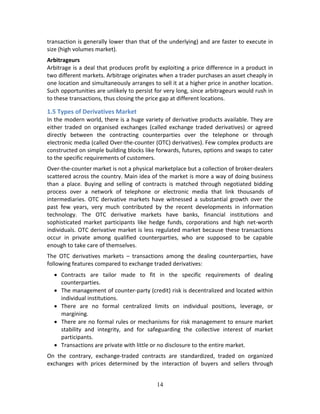
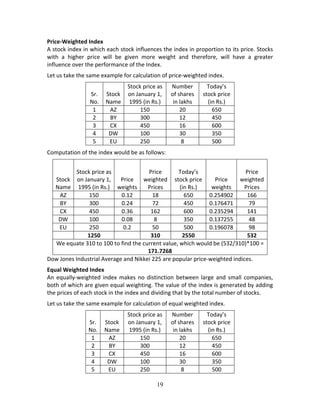
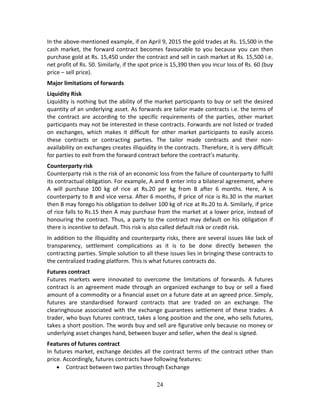
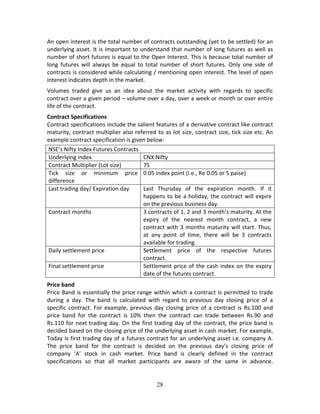
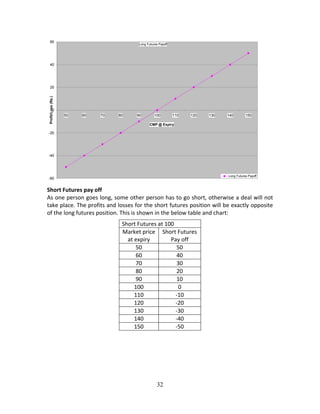
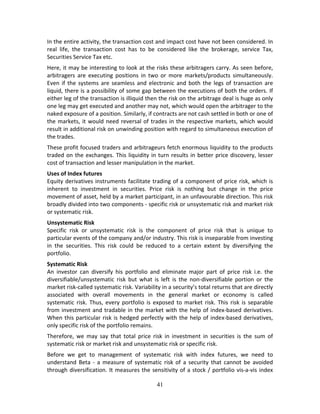
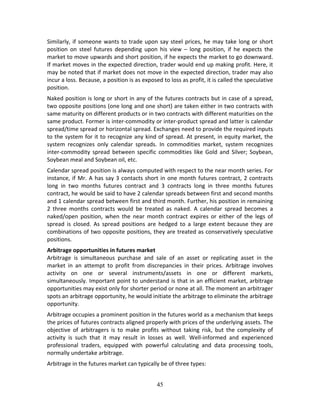
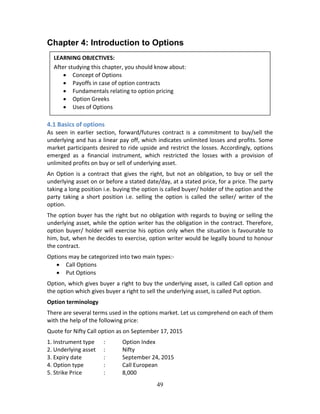
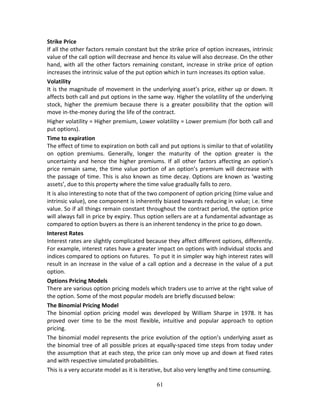
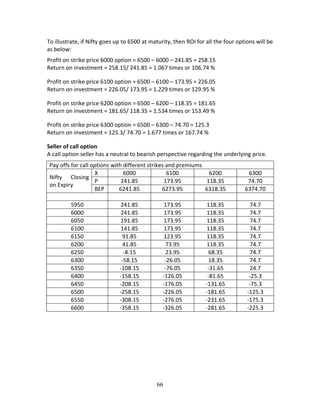
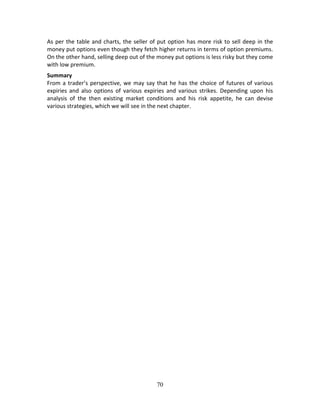
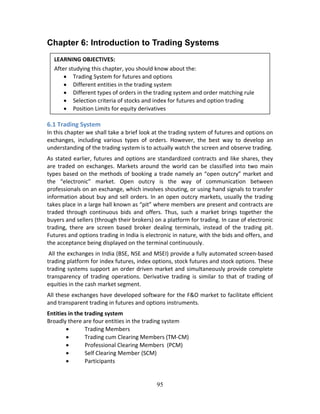
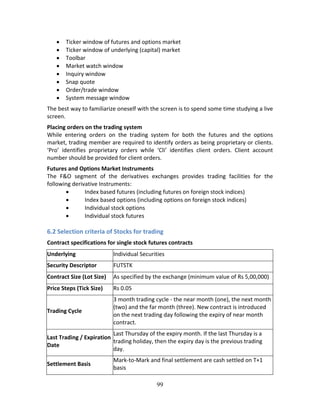
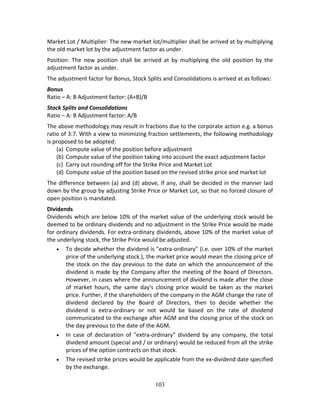
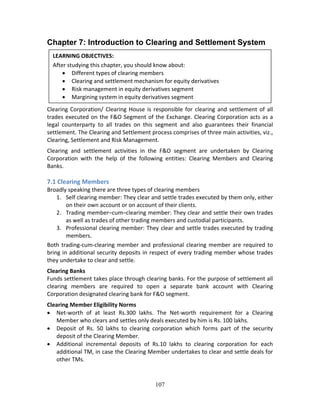
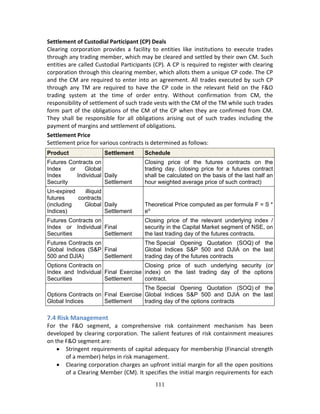
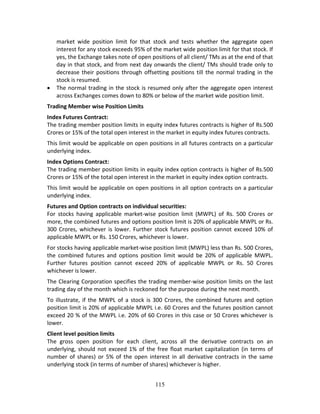
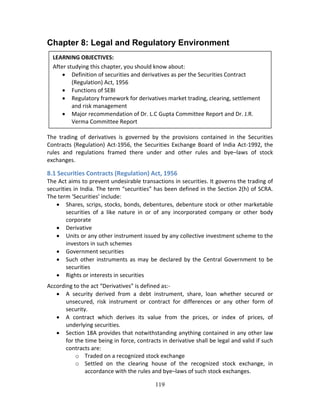
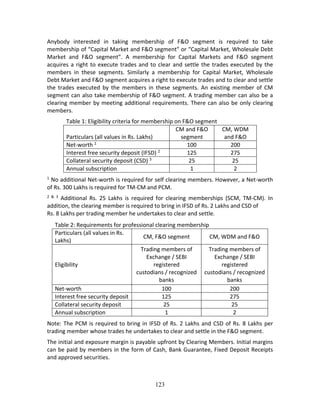
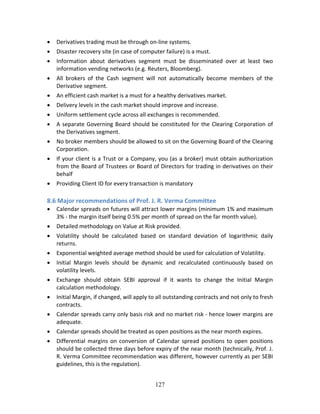
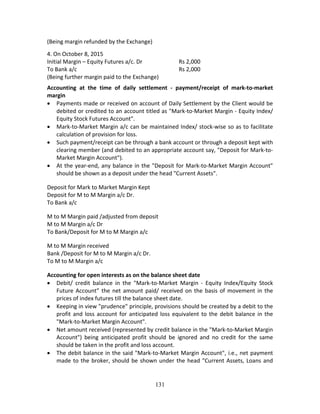
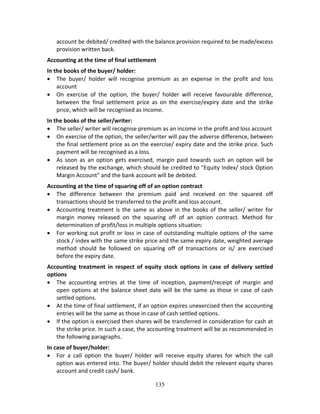
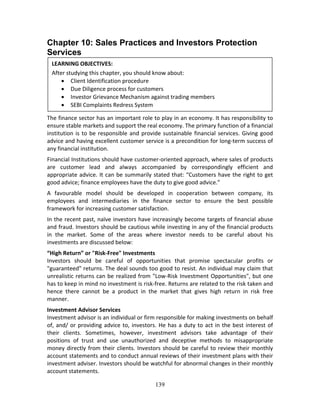
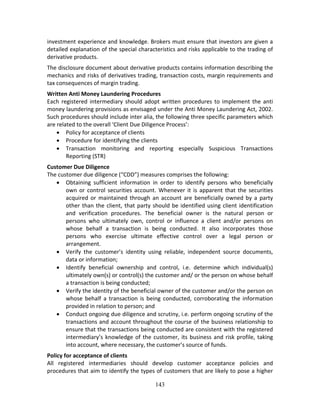
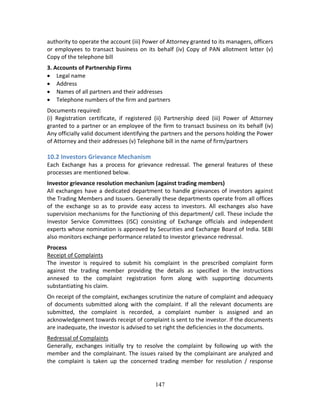
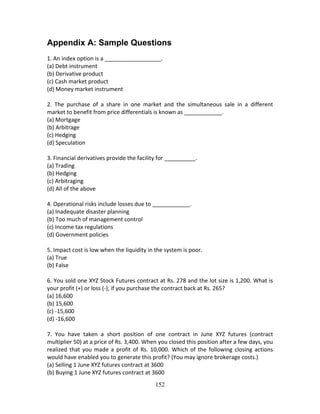
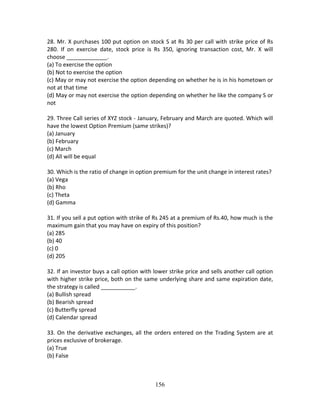
= 5000 (1+0.12‐0.04)^(90/365)
= Rs. 5095.79
[Alternatively, we could use exponential form for calculating the futures value as spot
price * e(r‐q)T
. Value in that case would have been 5000 * e((0.12‐0.04)*90/365)
= Rs. 5099.61].
If index futures is trading above 5099, we can buy index stocks in cash market and
simultaneously sell index futures to lock the gains equivalent to the difference between
futures price and future fair price (the cost of transaction, taxes, margins etc. are not
considered while calculating the future fair value).
Note: Cost of borrowing of funds and securities, return expectations on the held asset
etc. are different for the different market participants. The number of fair values of
futures can be equal to the number of market participants in the market. Perhaps the
difference among the fair values of futures contracts and non‐arbitrage bound for
different market participants is what makes the market on continuous basis.
Assumptions in cash and carry model
Cash and carry model of futures pricing works under certain assumptions. The important
assumptions are stated below:*
Underlying asset is available in abundance in cash market.
Demand and supply in the underlying asset is not seasonal.
Holding and maintaining of underlying asset is easy and feasible.
Underlying asset can be sold short.
No transaction costs.
No taxes.
No margin requirements.
[*This is not an exhaustive list of the assumptions of the model but is the list of important assumptions]
The assumption that underlying asset is available in abundance in the cash market i.e.
we can buy and/or sell as many units of the underlying assets as we want. This
assumption does not work especially when underlying asset has seasonal pattern of
demand and supply. The prices of seasonal assets (especially commodities) vary
drastically in different demand‐supply environments. When supplies arrive to the
market place, prices are generally low whereas prices are generally high immediately
before the supply of the underlying.
When an underlying asset is not storable i.e. the asset is not easy to hold/maintain, then
one cannot carry the asset to the future. The cash and carry model is not applicable to
these types of underlying assets.
Similarly, many a times, the underlying may not be sold short. This is true in case of
seasonal commodities.
Even though this simple form of cash and carry model does not discount for transaction
cost, taxes etc. we can always upgrade the formula to reflect the impact of these factors
in the model. Margins are not considered while delivering the fair value/ synthetic
futures value. That is why this model is suitable for pricing forward contracts rather than
futures contracts.](https://image.slidesharecdn.com/equityderivativesworkbookversionsep-2015-160707104606/85/NISM-Series-VIII-Equity-Derivatives-37-320.jpg)
![62
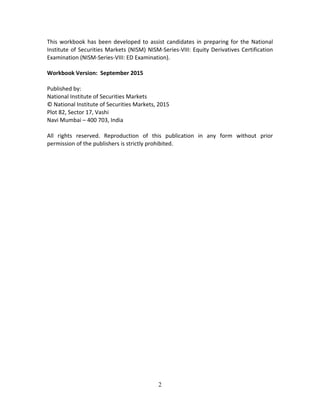
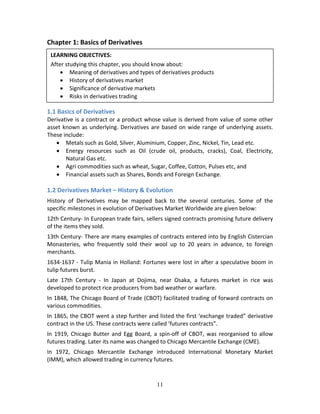
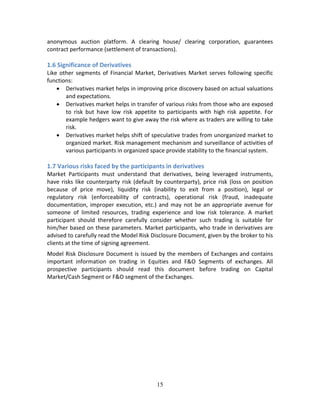
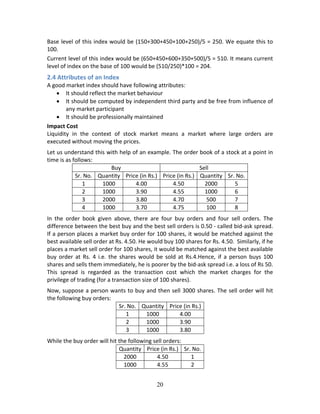
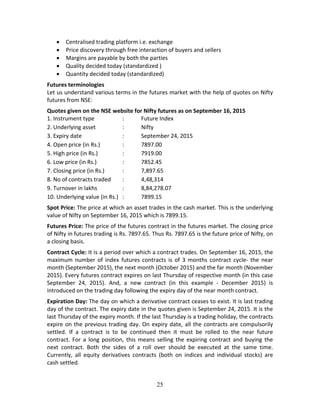
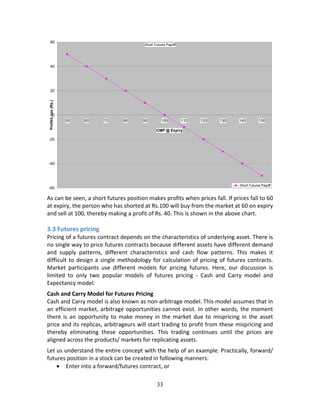
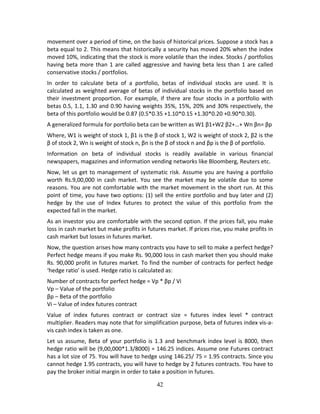
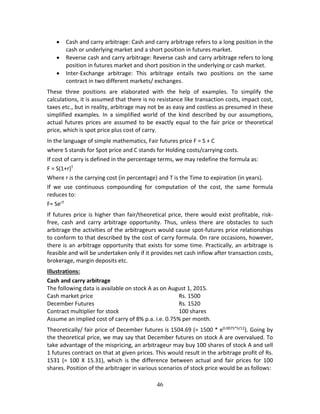
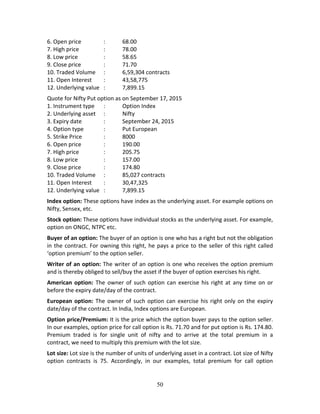
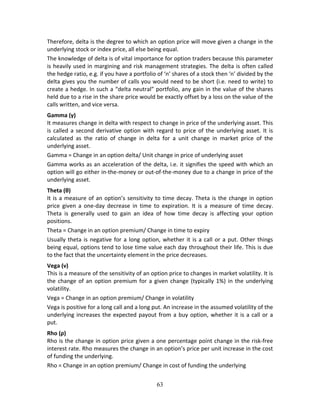
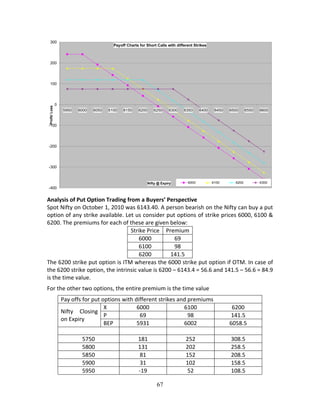
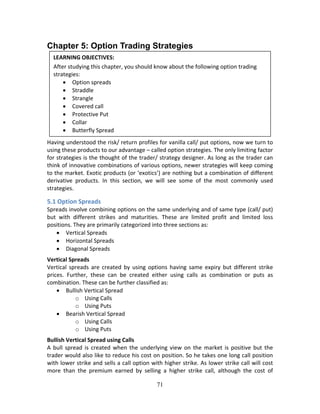
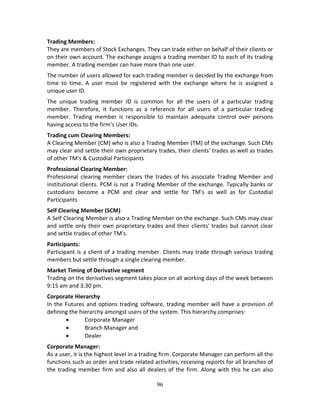
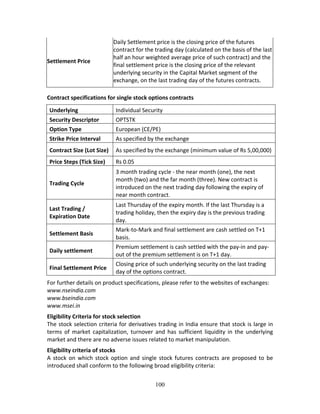
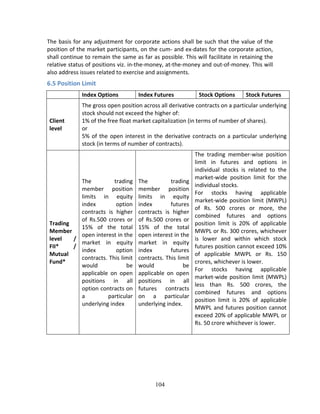
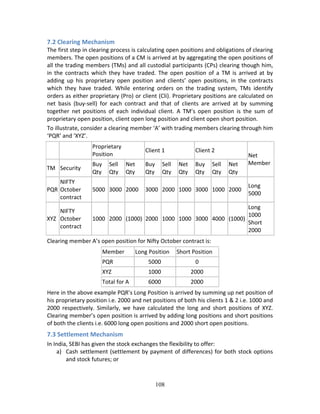
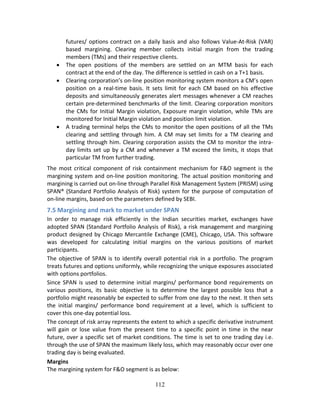
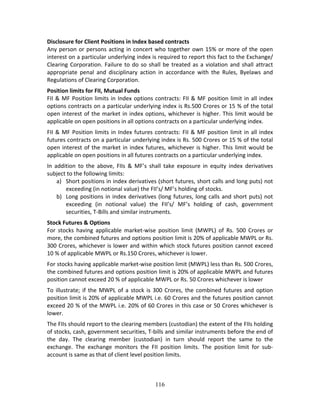
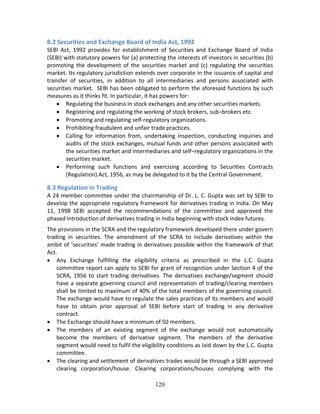
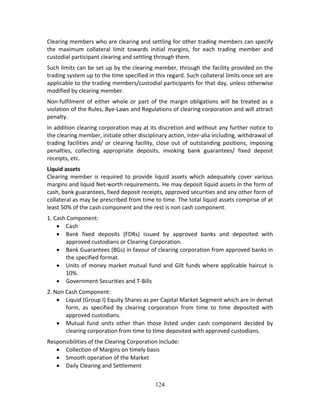
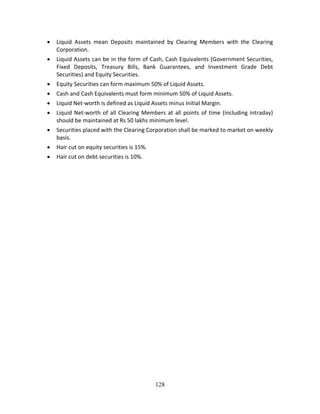
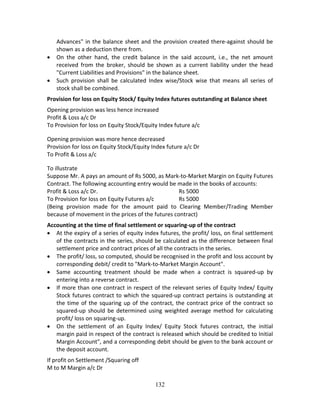
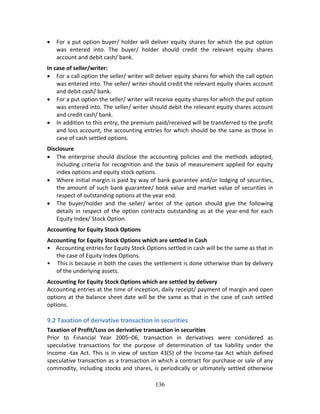
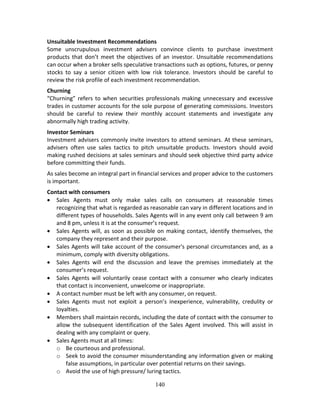
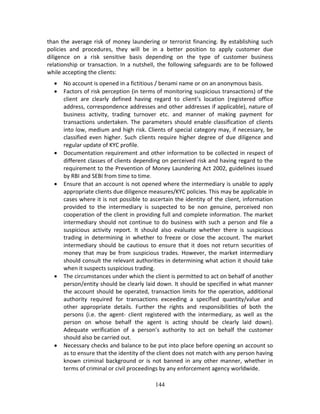
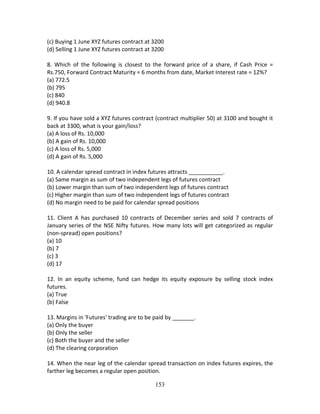
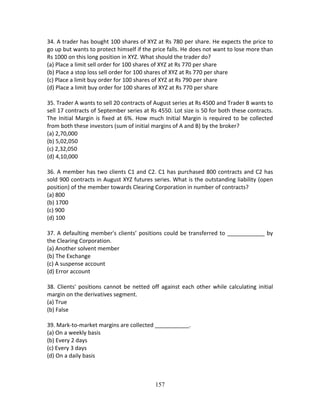
The Black & Scholes Model
The Black & Scholes model was published in 1973 by Fisher Black and Myron Scholes. It
is one of the most popular, relative simple and fast modes of calculation. Unlike the
binomial model, it does not rely on calculation by iteration.
This model is used to calculate a theoretical call price (ignoring the dividends paid during
the life of the option) using the five key determinants of an option’s price: stock price,
strike price, volatility, time to expiration, and short‐term (risk free) interest rate.
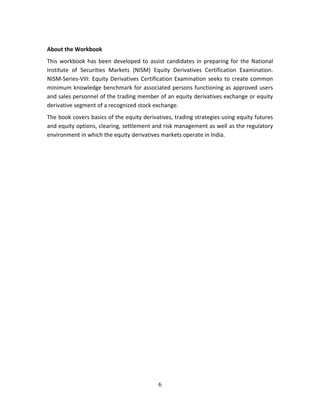
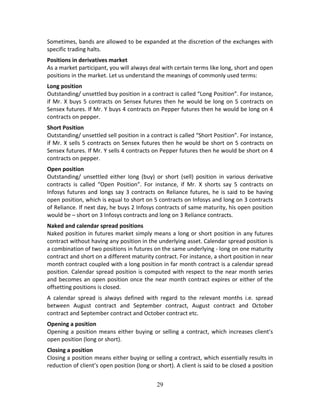
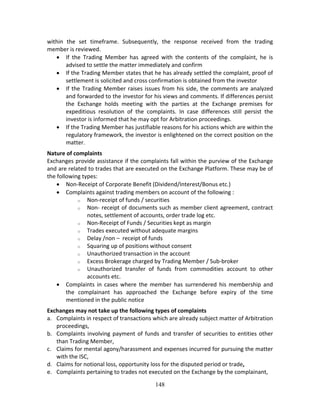
The original formula for calculating the theoretical Option Price (OP) is:
OP = SN(d1)‐Xert
N(d2)
Where,
D1=[In(s/n)+(r+(v2
/2)t]/ vt
D2 = d1‐vt
And the variables are
S = stock price
X = strike price
t = time remaining until expiration, expressed in years
r = current continuously compounded risk‐free interest rate
v = annual volatility of stock price (the standard deviation of the short‐term
returns over one year)
In = natural logarithm
N(x) = standard normal cumulative distribution function
e = the exponential function
Option Greeks
Option premiums change with changes in the factors that determine option pricing i.e.
factors such as strike price, volatility, term to maturity etc. The sensitivities most
commonly tracked in the market are known collectively as “Greeks” represented by
Delta, Gamma, Theta, Vega and Rho.
Delta (δ or ∆)
The most important of the ‘Greeks’ is the option’s “Delta”. This measures the sensitivity
of the option value to a given small change in the price of the underlying asset. It may
also be seen as the speed with which an option moves with respect to price of the
underlying asset.
Delta = Change in option premium/ Unit change in price of the underlying asset.
Delta for call option buyer is positive. This means that the value of the contract
increases as the share price rises. To that extent it is rather like a long or ‘bull’ position
in the underlying asset. Delta for call option seller will be same in magnitude but with
the opposite sign (negative).
Delta for put option buyer is negative. The value of the contract increases as the share
price falls. This is similar to a short or ‘bear’ position in the underlying asset. Delta for
put option seller will be same in magnitude but with the opposite sign (positive).](https://image.slidesharecdn.com/equityderivativesworkbookversionsep-2015-160707104606/85/NISM-Series-VIII-Equity-Derivatives-63-320.jpg)

![149
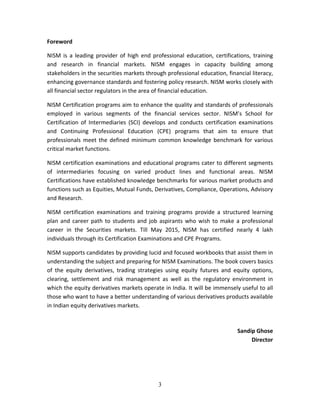
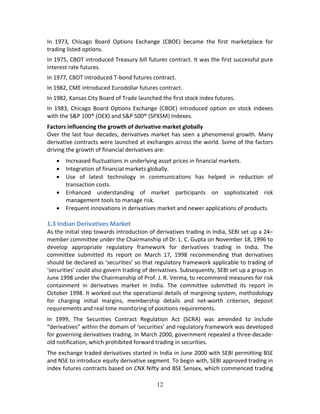
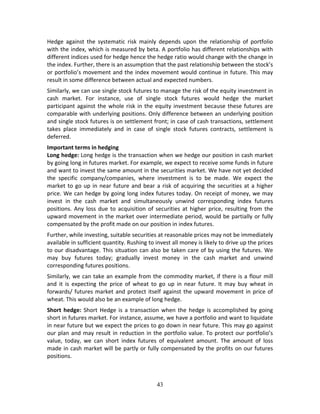
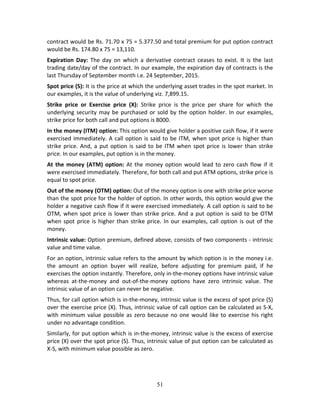
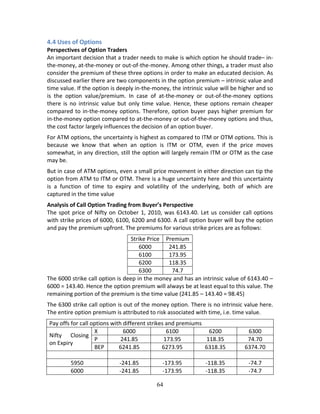
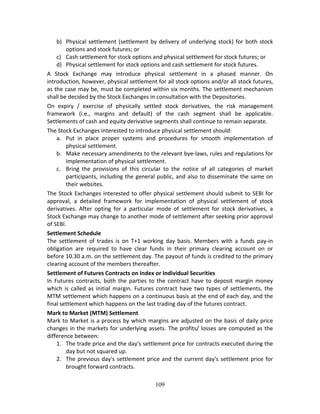
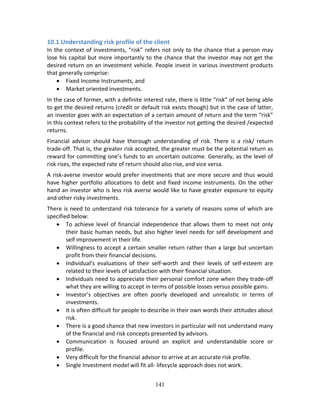
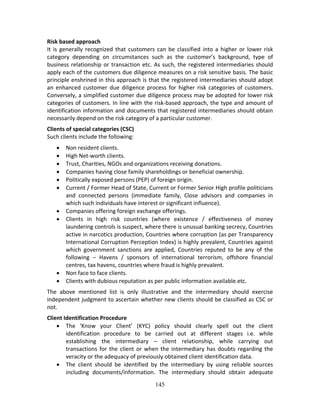
f. Claims of sub‐broker/authorized persons for private commercial dealings with the
trading member,
g. Claims relating to transactions which are in the nature of loan or financing which are
not within the framework defined by the Exchange.
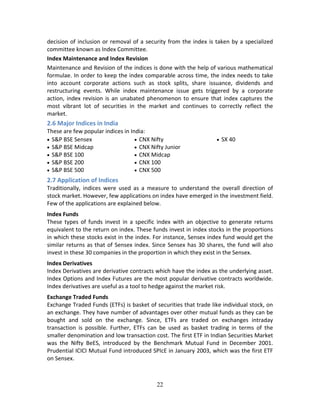
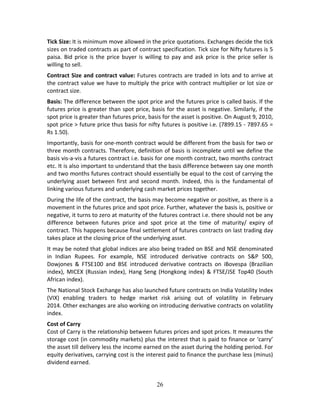
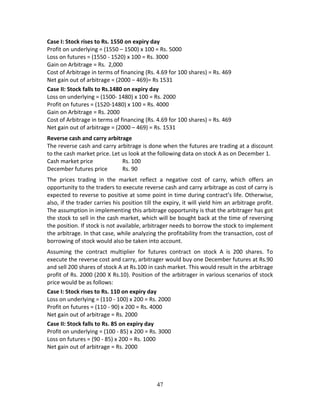
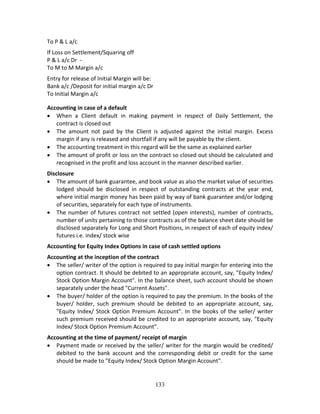
Arbitration
SEBI has instructed the exchange to have arbitration committees so that differences,
disputes and claims between trading members and investors can be settled effectively
and in a short time. Arbitration is also governed by Exchange Bye‐laws.
Arbitration is a quasi judicial process of settlement of disputes between Trading
Members, Investors, Sub‐brokers & Clearing Members and between Investors and
Issuers (Listed Companies). Generally the application for arbitration has to be filed at
the Arbitration Centres established by the exchanges.
The parties to arbitration are required to select the arbitrator from the panel of
arbitrators provided by the Exchange. The arbitrator conducts the arbitration
proceeding and passes the award normally within a period of four months from the date
of initial hearing.
The arbitration award is binding on both the parties. However, the aggrieved party,
within fifteen days of the receipt of the award from the arbitrator, can file an appeal to
the arbitration tribunal for re‐hearing the whole case. On receipt of the appeal, the
Exchange appoints an Appellate Bench consisting of five arbitrators who re‐hear the
case and then give the decision. The judgment of the Bench is by a ‘majority’ and is
binding on both the parties. The final award of the Bench is enforceable as if it were the
decree of the Court.
Any party who is dissatisfied with the Appellate Bench Award may challenge the same in
a Court of Law.
SEBI Complaints Redress System (SCORES) [http://scores.gov.in]
SEBI has launched a centralized web based complaints redress system (SCORES). This
would enable investors to lodge and follow up their complaints and track the status of
redressal of such complaints from anywhere. This would also enable the market
intermediaries and listed companies to receive the complaints from investors against
them, redress such complaints and report redressal. All the activities starting from
lodging of a complaint till its disposal by SEBI would be carried online in an automated
environment and the status of every complaint can be viewed online at any time. An
investor, who is not familiar with SCORES or does not have access to SCORES, can lodge
complaints in physical form. However, such complaints would be scanned and uploaded
in SCORES for processing. SCORES would expedite disposal of investors’ complaints as
this would obviate the need for physical movement of complaints and the possibility of
loss, damage or misdirection of the complaints would be avoided. It would facilitate
easy retrieval and tracking of complaints at any time.](https://image.slidesharecdn.com/equityderivativesworkbookversionsep-2015-160707104606/85/NISM-Series-VIII-Equity-Derivatives-150-320.jpg)

![Study Material - [NISM] Series-VIII Equity Derivatives](https://cdn.slidesharecdn.com/ss_thumbnails/studymaterial-nismseries-viiiequityderivatives-191226040905-thumbnail.jpg?width=640&height=640&fit=bounds)


![Study Material - [NCFM] FIMMDA-NSE Debt Market (Basic) Module](https://cdn.slidesharecdn.com/ss_thumbnails/studymaterial-ncfmfimmda-nsedebtmarketbasicmodule-191226040706-thumbnail.jpg?width=640&height=640&fit=bounds)


