Downloaded 52 times
![Copywright©2014TheNielsenCompany.Confidentialandproprietary.
23
[VALUE]
[VALUE]
0
100
200
300
400
500
600
700
800
900
1000
25%
30%
35%
40%
45%
50%
Feb Mar Apr May Jun Jul Aug Sep Oct Nov Dec Jan
GRPs Total HH's NFL/Perry Fans
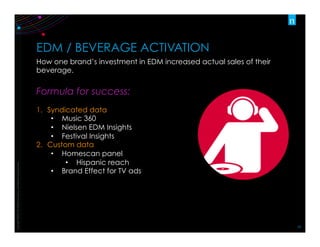
Share of Pepsi sales peak on the announcement of Perry as the halftime
performer, and during the playoffs
KATY PERRY FANS / PEPSI SALES TIMELINE
Regular
Pepsi
sales
as
a
share
of
all
regular
Cola
purchases
Source:
Nielsen
Homescan,
Off-‐Season
1/26/2014-‐8/23/14;
Regular
Season
8/24/2014-‐12/20/2014,
Playoffs
12/21/2014-‐1/24/2014
11/24/2013: Pepsi begins
airing the ‘Halftime’ ad,
featuring music by Katy Perry
10/09/14: First announcement
that Katy Perry will play Pepsi
Halftime Show](https://image.slidesharecdn.com/nielsenmusicbizbigdata-150526142210-lva1-app6891/85/Nielsen-Music-Big-Data-Means-Big-Opportunities-23-320.jpg)
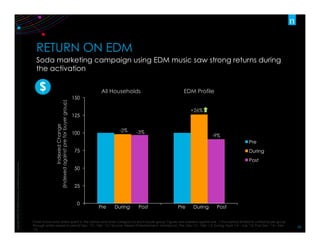

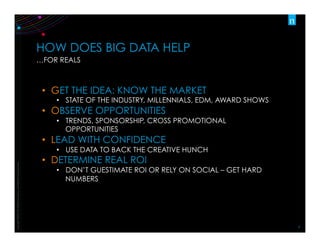
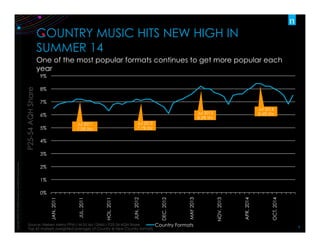
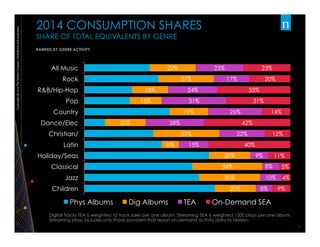
The document discusses the impact of big data on the music industry, highlighting trends, consumption patterns, and genre popularity among millennials, particularly focusing on country music and its demographic shifts. It emphasizes the importance of utilizing data for decision-making and ROI assessment in marketing strategies related to music and brand partnerships. The insights illustrate how consumer behaviors, particularly among younger audiences, can inform sponsorship and promotional opportunities for brands within the music space.


![Music sheet genesis - songbook [full band score]](https://cdn.slidesharecdn.com/ss_thumbnails/musicsheet-genesis-songbookfullbandscore-150818024003-lva1-app6892-thumbnail.jpg?width=640&height=640&fit=bounds)


