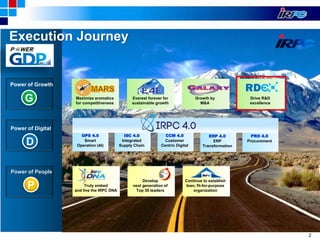
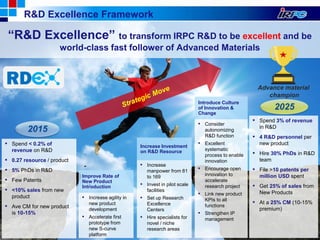
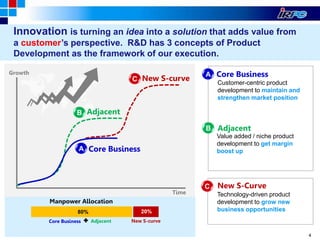
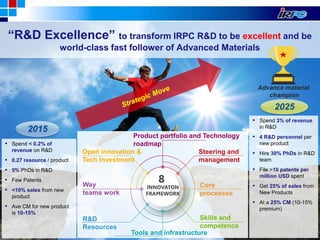
1
The Westin Grande Sukumvit Bangkok
August 31st, 2018
2
Execution Journey
Maximize aromatics
for competitiveness
Growth by
M&A
Everest forever for
sustainable growth
Drive R&D
excellence
OPS 4.0
Smart
Operation (AI)
ISC 4.0
Integrated
Supply Chain
CCM 4.0
Customer
Centric Digital
ERP 4.0
ERP
Transformation
PRO 4.0
Procurement
Truly embed
and live the IRPC DNA
Develop
next generation of
Top 30 leaders
Continue to establish
lean, fit-for-purpose
organization
Power of Growth
Power of Digital
G
D
Power of People
P
33
2015
2025
3
▪ Spend < 0.2% of
revenue on R&D
▪ 0.27 resource / product
▪ 5% PhDs in R&D
▪ Few Patents
▪ <10% sales from new
product
▪ Ave CM for new product
is 10-15%
▪ Spend 3% of revenue
in R&D
▪ 4 R&D personnel per
new product
▪ Hire 30% PhDs in R&D
team
▪ File >10 patents per
million USD spent
▪ Get 25% of sales from
New Products
▪ At a 25% CM (10-15%
premium)
“R&D Excellence” to transform IRPC R&D to be excellent and be
world-class fast follower of Advanced Materials
Advance material
champion
Improve Rate of
New Product
Introduction
Increase Investment
on R&D Resource
Introduce Culture
of Innovation &
Change
▪ Consider
autonomizing
R&D function
▪ Excellent
systematic
process to enable
innovation
▪ Encourage open
innovation to
accelerate
research project
▪ Link new product
KPIs to all
functions
▪ Strengthen IP
management
▪ Increase
manpower from 81
to 169
▪ Invest in pilot scale
facilities
▪ Set up Research
Excellence
Centers
▪ Hire specialists for
novel / niche
research areas
▪ Increase agility in
new product
development
▪ Accelerate first
prototype from
new S-curve
platform
R&D Excellence Framework
4
Time
Growth
Core Business
Value added / niche product
development to get margin
boost up
Adjacent
Technology-driven product
development to grow new
business opportunities
New S-curve
A
B
C
Core Business
Adjacent
New S-Curve
A
B
C
Innovation is turning an idea into a solution that adds value from
a customer’s perspective. R&D has 3 concepts of Product
Development as the framework of our execution.
Customer-centric product
development to maintain and
strengthen market position
Core Business Adjacent New S-curve
80% 20%
Manpower Allocation
5
Nano additive for diesel
Organic RON booster
Core & Adjacent Business
IRPC Innovation Center
Sterile products & healthcare
Household products
Construction materials
Biopolymer & composites
Performance Asphalt
PPR pipe
Additives
Interior decorative design Cosmetic case
- Performance-Graded asphalt cement
- Natural rubber modified asphalt
WHERE DO WE GO AND WHAT VALUE
PROPOSITION DO WE BRING
Portfolio and Tech
roadmap
Skills and
competence
Open innovation and
Tech investment
Steering and
management
Yarn Wire and cable
EE appliances
Office
automation
6
Idea Generation Evaluation Selection & Detailing
~70
ideas
Ideas Falling Out due to
External Factors
15 platforms
Ideas were generated from
both within IRPC (megatrends
workshop) and baesd on
techvision program
Ideas were consolidated
into 15 platforms based on
commonality of technology,
material or product
Of the 15 platforms, 7
were shortlisted and 11
products identified from
these
Megatrend
Workshop 1
Primary source
of Techvision
Megatrend
Workshop 2
7 new platforms were identified to focus on leading to 11 new products
7
Intended time-to-market for IRPC portfolio broadly in line with peers
SOURCE: Team analysis
R&D project pipeline based on time-to-market
% of projects as intended1 by teams
100%
13% 60% 27%
62% 36% 2%
45% 37% 18%
Industry
avg.2
Materials &
Chemicals
Polymers
Customer Solutions
Total
R&D
45% 44% 11%
1 Based on current plan as stated by DMs in each department 2 Based on chemical companies average
Short-term
< 2018
Med-term
2019 – 2020
Long-term
> 2020
▪ Good alignment
with average of
chemical industry,
which also includes
leading
innovators…
▪ …which suggests
that IRPC’s
intended R&D
portfolio should
deliver growth
similar to global
peer groups
88
2015
2025
8
▪ Spend < 0.2% of
revenue on R&D
▪ 0.27 resource / product
▪ 5% PhDs in R&D
▪ Few Patents
▪ <10% sales from new
product
▪ Ave CM for new product
is 10-15%
▪ Spend 3% of revenue
in R&D
▪ 4 R&D personnel per
new product
▪ Hire 30% PhDs in R&D
team
▪ File >10 patents per
million USD spent
▪ Get 25% of sales from
New Products
▪ At a 25% CM (10-15%
premium)
“R&D Excellence” to transform IRPC R&D to be excellent and be
world-class fast follower of Advanced Materials
Advance material
champion
99
2015
2025
9
▪ Spend < 0.2% of
revenue on R&D
▪ 0.27 resource / product
▪ 5% PhDs in R&D
▪ Few Patents
▪ <10% sales from new
product
▪ Ave CM for new product
is 10-15%
▪ Spend 3% of revenue
in R&D
▪ 4 R&D personnel per
new product
▪ Hire 30% PhDs in R&D
team
▪ File >10 patents per
million USD spent
▪ Get 25% of sales from
New Products
▪ At a 25% CM (10-15%
premium)
“R&D Excellence” to transform IRPC R&D to be excellent and be
world-class fast follower of Advanced Materials
Advance material
champion
Steering and
management
Core
processes
Skills and
competence
Product portfolio and Technology
roadmap
R&D
Resources
Way
teams work
Tools and infrastructure
INNOVATON
FRAMEWORK
8
Open innovation &
Tech Investment
10
Value
add
‘Necessary
evil’
Non-valueaddedtime
TOTAL AVG. (8x) DM (3x) Researcher (3x) Technician (2x)
SOURCE: IRPC data, Team analysis
29
77
29
Research report
Management report
8
Direct supervision of researcher
Research work
TOTAL VALUE ADDED TIME 106 (22%)
5
Administrative task
Project work meeting 51
87
TOTAL PROJECT RELATED TIME 278 (58%)
Non-project work
14
480
18
407(85%)
Non-project meeting
19
27
Emails
TOTAL NET TIME
12
73
Movement
Calls
31
Breaks
TOTAL TIME (100%)
Interruption
Waiting time
84
0
32
50
78
2
0
272 (57%)
51
44
25
402 (84%)
480
46
47
4
17
128 (27%)
5
3
80
5
100
305 (64%)
15
195
105 (22%)
3
8
68
480
400 (83%)
0
18
18
257 (54%)
18
103
85 (18%)
34
16
85
43
20
22
63
13
24
417 (87%)
480
Time in minutes, %
DAY-IN-THE-LIFE-OF (DILO) ANALYSIS
On average 22% of time is dedicated to value-add activities;
for researchers this share is only 18%
11
Structured interviews and the innovation survey have uncovered the
following 19 challenges
SOURCE: R&D Team Analysis
R&D
organization
Steering and
management
Way teams
work
Core
processes
Tools and
infrastructure
Customer,
product, and
technology
roadmap
Skills and
competence
Skills and competence
▪ Some skill mismatches vs. role in the
function
▪ Some areas of challenge for
competencies – scale-up, product
development, know-how of plant
constraints, business mindset for
projects
▪ Limited knowledge transfer
Portfolio & Roadmap
▪ High number of projects worked on in
parallel
▪ Limited alignment across IRPC
▪ Lack of active portfolio management
and balancing to align with growth
targets of IRPC
▪ Limited transparency to leadership on
full projects list
Core processes
▪ Stage gate process not easy to use
and not applicable to several projects
in the portfolio
▪ No effective controlling and
monitoring of project list
R&D organization
▪ Activity overlap across divisions in
R&D function
▪ Career paths unclear for researchers
in R&D
Steering and management
▪ Approvals only made on charters for budget
▪ Challenging to make effective PDC decisions
▪ KPIS not applicable for all parts of R&D organization
▪ Budgeting process does not promote efficient behaviour
Way teams work
▪ Heavy burden of administrative tasks (HR, budget, procurement, other
corporate, some management reports)
▪ Limited communication across functions
▪ Lack of structured communication and operating model with marketing for
urgent asks vs. strategic projects
1
2
4
9
5
6
7
8
10
15
16
17
18
19
Global
footprint
Tools and infrastructure
▪ Lack of unified system to monitor
projects and help management
decisions
14
3
11
12
13
Global footprint
▪ n/a
12
Report-
out to
IRPC MC
Everest
Forever
Frequency
Monthly
Bi-weekly
Pre-IPC
MC
Pre- PDC
Weekly
Daily/weekly
Participants
EVP IPC, VPs
Internal to department
VP, IPM, DMs
CTO, EVP IPC, VPs,
DMs, Project managers
Internal to department
DM, Project Team
Objectives
CEO, cross-functional
SEVPs, EVP IPC, VPs
Project portfolio
review
Stage gate review
Division by division
status review
Execution review integrated
with Everest Forever
Project team
working review
Forum
PDC
IPC MC
VP review
R&D work
stream TO
Project
check-in
Governance: streamlined report-up is now in place,
for both – execution excellence and also growth delivery
This will enable both clear governance, but also a structured
way of working for DMs and VPs in the R&D organization
13
We now have
set-up monthly
meetings for all
three above
resulting in full
transparency
across functions
Cadence: clear linkages with operations and marketing now
Operations
alignment
Commercial
alignment
Support
request
alignment
Attendees
VPs,
Operations,
IPM, DMs
VPs,
Operations,
IPM, DMs
RS VP,
Marketing,
Operations
Objective
▪ Secure capacity for plant trials
▪ Project launches in the next 6 months
▪ Align on prices/volumes
▪ Schedule customer trials
▪ Handover finished projects to marketing
▪ Discuss support needed for new requests
▪ Forecast R&D resources needed
14
R&D innovation stage-gate process
Case study
Plant trials
Lab
Project
types
Minor
change
Major
change
RD/ RS
New
platform
RD/ RS
Product launch
RD/ RS/ OPS/ MKTRD/ RS/ OPS/ MKT
Business
approval
Lab/Pilot
approval
RM/ OPS/ MKT RM/ OPS/ MKT
RD/ RS/ OPS/ MKT
Ramp up
approval
RM-De novo program
Idea generation
approval
Short-term,
Quick win
Medium-term
Long-term
Incoming projects
15
IRPC Core Value
I = “Innovation”
a. Build more products or services, not just protecting the
existing ones
b. Never leave it mature. Keep thinking no ending
c. Value is what people pay, not low-priced commodity
d. Customers don’t know what they need. We have to find
explicit and implicit needs
e. Keep experimenting
Mindset to build innovative creativity
I R P C D N A
16
R&D Climate & Culture - Infrastructure
IRPC Innovation Center (IIC)
• R&D Office and Laboratory
• Centralized R&D Instrument
• Innovation Plaza
17
Thank you

Future Enterprise - IRPC

  • 1.
    1 The Westin GrandeSukumvit Bangkok August 31st, 2018
  • 2.
    2 Execution Journey Maximize aromatics forcompetitiveness Growth by M&A Everest forever for sustainable growth Drive R&D excellence OPS 4.0 Smart Operation (AI) ISC 4.0 Integrated Supply Chain CCM 4.0 Customer Centric Digital ERP 4.0 ERP Transformation PRO 4.0 Procurement Truly embed and live the IRPC DNA Develop next generation of Top 30 leaders Continue to establish lean, fit-for-purpose organization Power of Growth Power of Digital G D Power of People P
  • 3.
    33 2015 2025 3 ▪ Spend <0.2% of revenue on R&D ▪ 0.27 resource / product ▪ 5% PhDs in R&D ▪ Few Patents ▪ <10% sales from new product ▪ Ave CM for new product is 10-15% ▪ Spend 3% of revenue in R&D ▪ 4 R&D personnel per new product ▪ Hire 30% PhDs in R&D team ▪ File >10 patents per million USD spent ▪ Get 25% of sales from New Products ▪ At a 25% CM (10-15% premium) “R&D Excellence” to transform IRPC R&D to be excellent and be world-class fast follower of Advanced Materials Advance material champion Improve Rate of New Product Introduction Increase Investment on R&D Resource Introduce Culture of Innovation & Change ▪ Consider autonomizing R&D function ▪ Excellent systematic process to enable innovation ▪ Encourage open innovation to accelerate research project ▪ Link new product KPIs to all functions ▪ Strengthen IP management ▪ Increase manpower from 81 to 169 ▪ Invest in pilot scale facilities ▪ Set up Research Excellence Centers ▪ Hire specialists for novel / niche research areas ▪ Increase agility in new product development ▪ Accelerate first prototype from new S-curve platform R&D Excellence Framework
  • 4.
    4 Time Growth Core Business Value added/ niche product development to get margin boost up Adjacent Technology-driven product development to grow new business opportunities New S-curve A B C Core Business Adjacent New S-Curve A B C Innovation is turning an idea into a solution that adds value from a customer’s perspective. R&D has 3 concepts of Product Development as the framework of our execution. Customer-centric product development to maintain and strengthen market position Core Business Adjacent New S-curve 80% 20% Manpower Allocation
  • 5.
    5 Nano additive fordiesel Organic RON booster Core & Adjacent Business IRPC Innovation Center Sterile products & healthcare Household products Construction materials Biopolymer & composites Performance Asphalt PPR pipe Additives Interior decorative design Cosmetic case - Performance-Graded asphalt cement - Natural rubber modified asphalt WHERE DO WE GO AND WHAT VALUE PROPOSITION DO WE BRING Portfolio and Tech roadmap Skills and competence Open innovation and Tech investment Steering and management Yarn Wire and cable EE appliances Office automation
  • 6.
    6 Idea Generation EvaluationSelection & Detailing ~70 ideas Ideas Falling Out due to External Factors 15 platforms Ideas were generated from both within IRPC (megatrends workshop) and baesd on techvision program Ideas were consolidated into 15 platforms based on commonality of technology, material or product Of the 15 platforms, 7 were shortlisted and 11 products identified from these Megatrend Workshop 1 Primary source of Techvision Megatrend Workshop 2 7 new platforms were identified to focus on leading to 11 new products
  • 7.
    7 Intended time-to-market forIRPC portfolio broadly in line with peers SOURCE: Team analysis R&D project pipeline based on time-to-market % of projects as intended1 by teams 100% 13% 60% 27% 62% 36% 2% 45% 37% 18% Industry avg.2 Materials & Chemicals Polymers Customer Solutions Total R&D 45% 44% 11% 1 Based on current plan as stated by DMs in each department 2 Based on chemical companies average Short-term < 2018 Med-term 2019 – 2020 Long-term > 2020 ▪ Good alignment with average of chemical industry, which also includes leading innovators… ▪ …which suggests that IRPC’s intended R&D portfolio should deliver growth similar to global peer groups
  • 8.
    88 2015 2025 8 ▪ Spend <0.2% of revenue on R&D ▪ 0.27 resource / product ▪ 5% PhDs in R&D ▪ Few Patents ▪ <10% sales from new product ▪ Ave CM for new product is 10-15% ▪ Spend 3% of revenue in R&D ▪ 4 R&D personnel per new product ▪ Hire 30% PhDs in R&D team ▪ File >10 patents per million USD spent ▪ Get 25% of sales from New Products ▪ At a 25% CM (10-15% premium) “R&D Excellence” to transform IRPC R&D to be excellent and be world-class fast follower of Advanced Materials Advance material champion
  • 9.
    99 2015 2025 9 ▪ Spend <0.2% of revenue on R&D ▪ 0.27 resource / product ▪ 5% PhDs in R&D ▪ Few Patents ▪ <10% sales from new product ▪ Ave CM for new product is 10-15% ▪ Spend 3% of revenue in R&D ▪ 4 R&D personnel per new product ▪ Hire 30% PhDs in R&D team ▪ File >10 patents per million USD spent ▪ Get 25% of sales from New Products ▪ At a 25% CM (10-15% premium) “R&D Excellence” to transform IRPC R&D to be excellent and be world-class fast follower of Advanced Materials Advance material champion Steering and management Core processes Skills and competence Product portfolio and Technology roadmap R&D Resources Way teams work Tools and infrastructure INNOVATON FRAMEWORK 8 Open innovation & Tech Investment
  • 10.
    10 Value add ‘Necessary evil’ Non-valueaddedtime TOTAL AVG. (8x)DM (3x) Researcher (3x) Technician (2x) SOURCE: IRPC data, Team analysis 29 77 29 Research report Management report 8 Direct supervision of researcher Research work TOTAL VALUE ADDED TIME 106 (22%) 5 Administrative task Project work meeting 51 87 TOTAL PROJECT RELATED TIME 278 (58%) Non-project work 14 480 18 407(85%) Non-project meeting 19 27 Emails TOTAL NET TIME 12 73 Movement Calls 31 Breaks TOTAL TIME (100%) Interruption Waiting time 84 0 32 50 78 2 0 272 (57%) 51 44 25 402 (84%) 480 46 47 4 17 128 (27%) 5 3 80 5 100 305 (64%) 15 195 105 (22%) 3 8 68 480 400 (83%) 0 18 18 257 (54%) 18 103 85 (18%) 34 16 85 43 20 22 63 13 24 417 (87%) 480 Time in minutes, % DAY-IN-THE-LIFE-OF (DILO) ANALYSIS On average 22% of time is dedicated to value-add activities; for researchers this share is only 18%
  • 11.
    11 Structured interviews andthe innovation survey have uncovered the following 19 challenges SOURCE: R&D Team Analysis R&D organization Steering and management Way teams work Core processes Tools and infrastructure Customer, product, and technology roadmap Skills and competence Skills and competence ▪ Some skill mismatches vs. role in the function ▪ Some areas of challenge for competencies – scale-up, product development, know-how of plant constraints, business mindset for projects ▪ Limited knowledge transfer Portfolio & Roadmap ▪ High number of projects worked on in parallel ▪ Limited alignment across IRPC ▪ Lack of active portfolio management and balancing to align with growth targets of IRPC ▪ Limited transparency to leadership on full projects list Core processes ▪ Stage gate process not easy to use and not applicable to several projects in the portfolio ▪ No effective controlling and monitoring of project list R&D organization ▪ Activity overlap across divisions in R&D function ▪ Career paths unclear for researchers in R&D Steering and management ▪ Approvals only made on charters for budget ▪ Challenging to make effective PDC decisions ▪ KPIS not applicable for all parts of R&D organization ▪ Budgeting process does not promote efficient behaviour Way teams work ▪ Heavy burden of administrative tasks (HR, budget, procurement, other corporate, some management reports) ▪ Limited communication across functions ▪ Lack of structured communication and operating model with marketing for urgent asks vs. strategic projects 1 2 4 9 5 6 7 8 10 15 16 17 18 19 Global footprint Tools and infrastructure ▪ Lack of unified system to monitor projects and help management decisions 14 3 11 12 13 Global footprint ▪ n/a
  • 12.
    12 Report- out to IRPC MC Everest Forever Frequency Monthly Bi-weekly Pre-IPC MC Pre-PDC Weekly Daily/weekly Participants EVP IPC, VPs Internal to department VP, IPM, DMs CTO, EVP IPC, VPs, DMs, Project managers Internal to department DM, Project Team Objectives CEO, cross-functional SEVPs, EVP IPC, VPs Project portfolio review Stage gate review Division by division status review Execution review integrated with Everest Forever Project team working review Forum PDC IPC MC VP review R&D work stream TO Project check-in Governance: streamlined report-up is now in place, for both – execution excellence and also growth delivery This will enable both clear governance, but also a structured way of working for DMs and VPs in the R&D organization
  • 13.
    13 We now have set-upmonthly meetings for all three above resulting in full transparency across functions Cadence: clear linkages with operations and marketing now Operations alignment Commercial alignment Support request alignment Attendees VPs, Operations, IPM, DMs VPs, Operations, IPM, DMs RS VP, Marketing, Operations Objective ▪ Secure capacity for plant trials ▪ Project launches in the next 6 months ▪ Align on prices/volumes ▪ Schedule customer trials ▪ Handover finished projects to marketing ▪ Discuss support needed for new requests ▪ Forecast R&D resources needed
  • 14.
    14 R&D innovation stage-gateprocess Case study Plant trials Lab Project types Minor change Major change RD/ RS New platform RD/ RS Product launch RD/ RS/ OPS/ MKTRD/ RS/ OPS/ MKT RD/ RS/ OPS/ MKTRD/ RS/ OPS/ MKT Business approval Lab/Pilot approval RM/ OPS/ MKT RM/ OPS/ MKT RD/ RS/ OPS/ MKT Ramp up approval RM-De novo program Idea generation approval Short-term, Quick win Medium-term Long-term Incoming projects
  • 15.
    15 IRPC Core Value I= “Innovation” a. Build more products or services, not just protecting the existing ones b. Never leave it mature. Keep thinking no ending c. Value is what people pay, not low-priced commodity d. Customers don’t know what they need. We have to find explicit and implicit needs e. Keep experimenting Mindset to build innovative creativity I R P C D N A
  • 16.
    16 R&D Climate &Culture - Infrastructure IRPC Innovation Center (IIC) • R&D Office and Laboratory • Centralized R&D Instrument • Innovation Plaza
  • 17.