Downloaded 44 times

![29
Research Questions (Advanced Technology/Issues)
• GIS system with real-time 3D mapping
– Map localization performance and issues
– Path planning performance and issues
• Cameras and Image Processing
– Object detection performance
– Object classification performance
– Object segmentation performance
• See through fog and dark
– RADAR (proximity detection)
– Ultrasonic (proximity detection)
– LiDAR (360-degree vision)
• Dedicated low-cost supercomputers
– NVIDIA DRIVE™ PX 2 capable of 24 Trillion ‘deep learning’ operations per second
(equivalent of 150 MacBook Pros), supporting 12 simultaneous camera streams, plus
LiDAR, RADAR, and Ultrasonic sensors [html] used by Audi, BMW, Daimler, Ford
– Google, Apple, Blackberry, Samsung, etc.
• Machine learning software
– Accumulate more driving wisdom than humans over time
– Never distract and never repeat a mistake (unlike humans)
– Sensor calibration, data synchronization, sensor fusion
– Establish vehicle position relative to static and dynamic objects
– Calculate optimal path for safe travel
– ‘Deep’ neural network learning from successes, failures, and other vehicles
– Shared learning network from effective driving behaviors
Source 1: NVIDIA (2016)
1
?](https://image.slidesharecdn.com/smarttransportation-march2016-160316195059/85/Next-Generation-Intelligent-Transportation-Solutions-for-Smart-Cities-29-320.jpg)

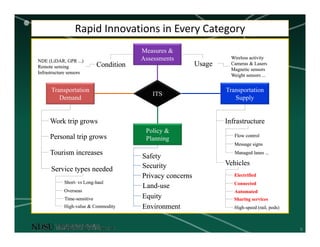
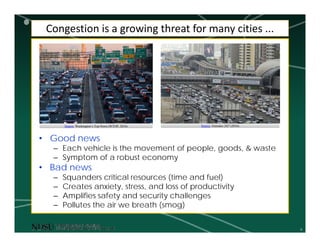
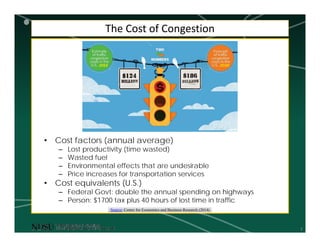
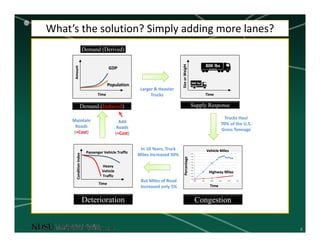
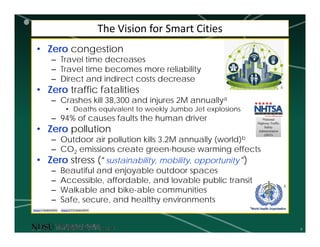
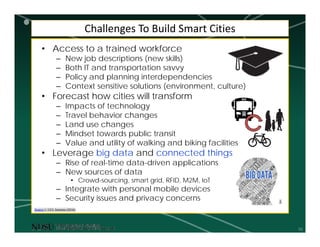
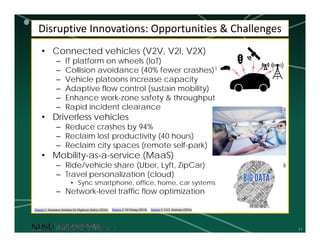
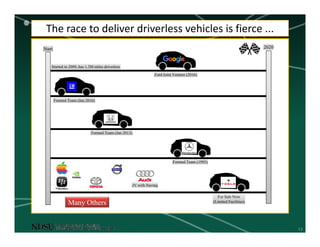
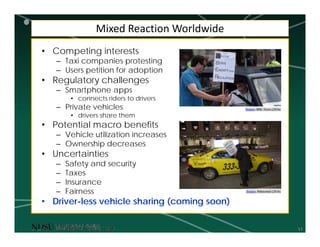
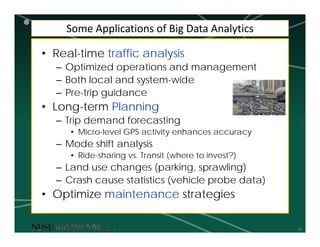
The document discusses the evolution and challenges of intelligent transportation solutions in smart cities, emphasizing the need for rapid innovation and the integration of information and transportation technologies. It highlights the costs of congestion and proposes visions for reducing traffic fatalities, pollution, and stress through advancements like connected and driverless vehicles, as well as mobility-as-a-service. Additionally, it outlines challenges in workforce training, policy planning, and the adoption of big data analytics to inform decision-making and improve urban transportation systems.


