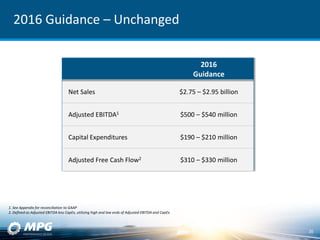
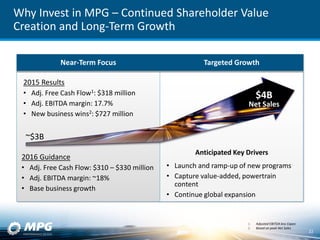
MPG provided guidance for 2016 that is unchanged from previous estimates:
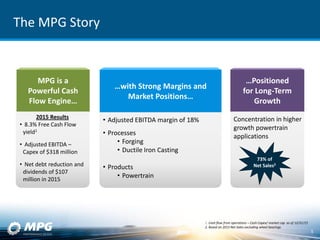
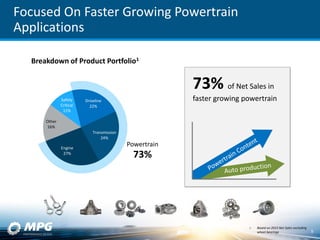
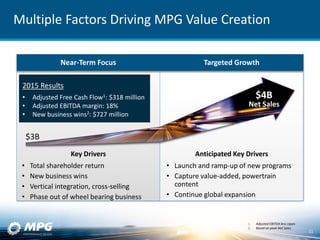
- Net sales are expected to be approximately $3.1 billion.
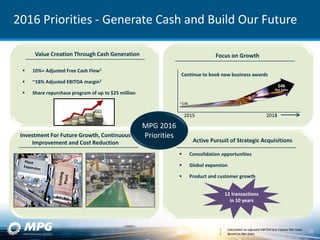
- Adjusted EBITDA margin is anticipated to be around 18%.
- Adjusted free cash flow yield is projected to be over 10% of net sales.