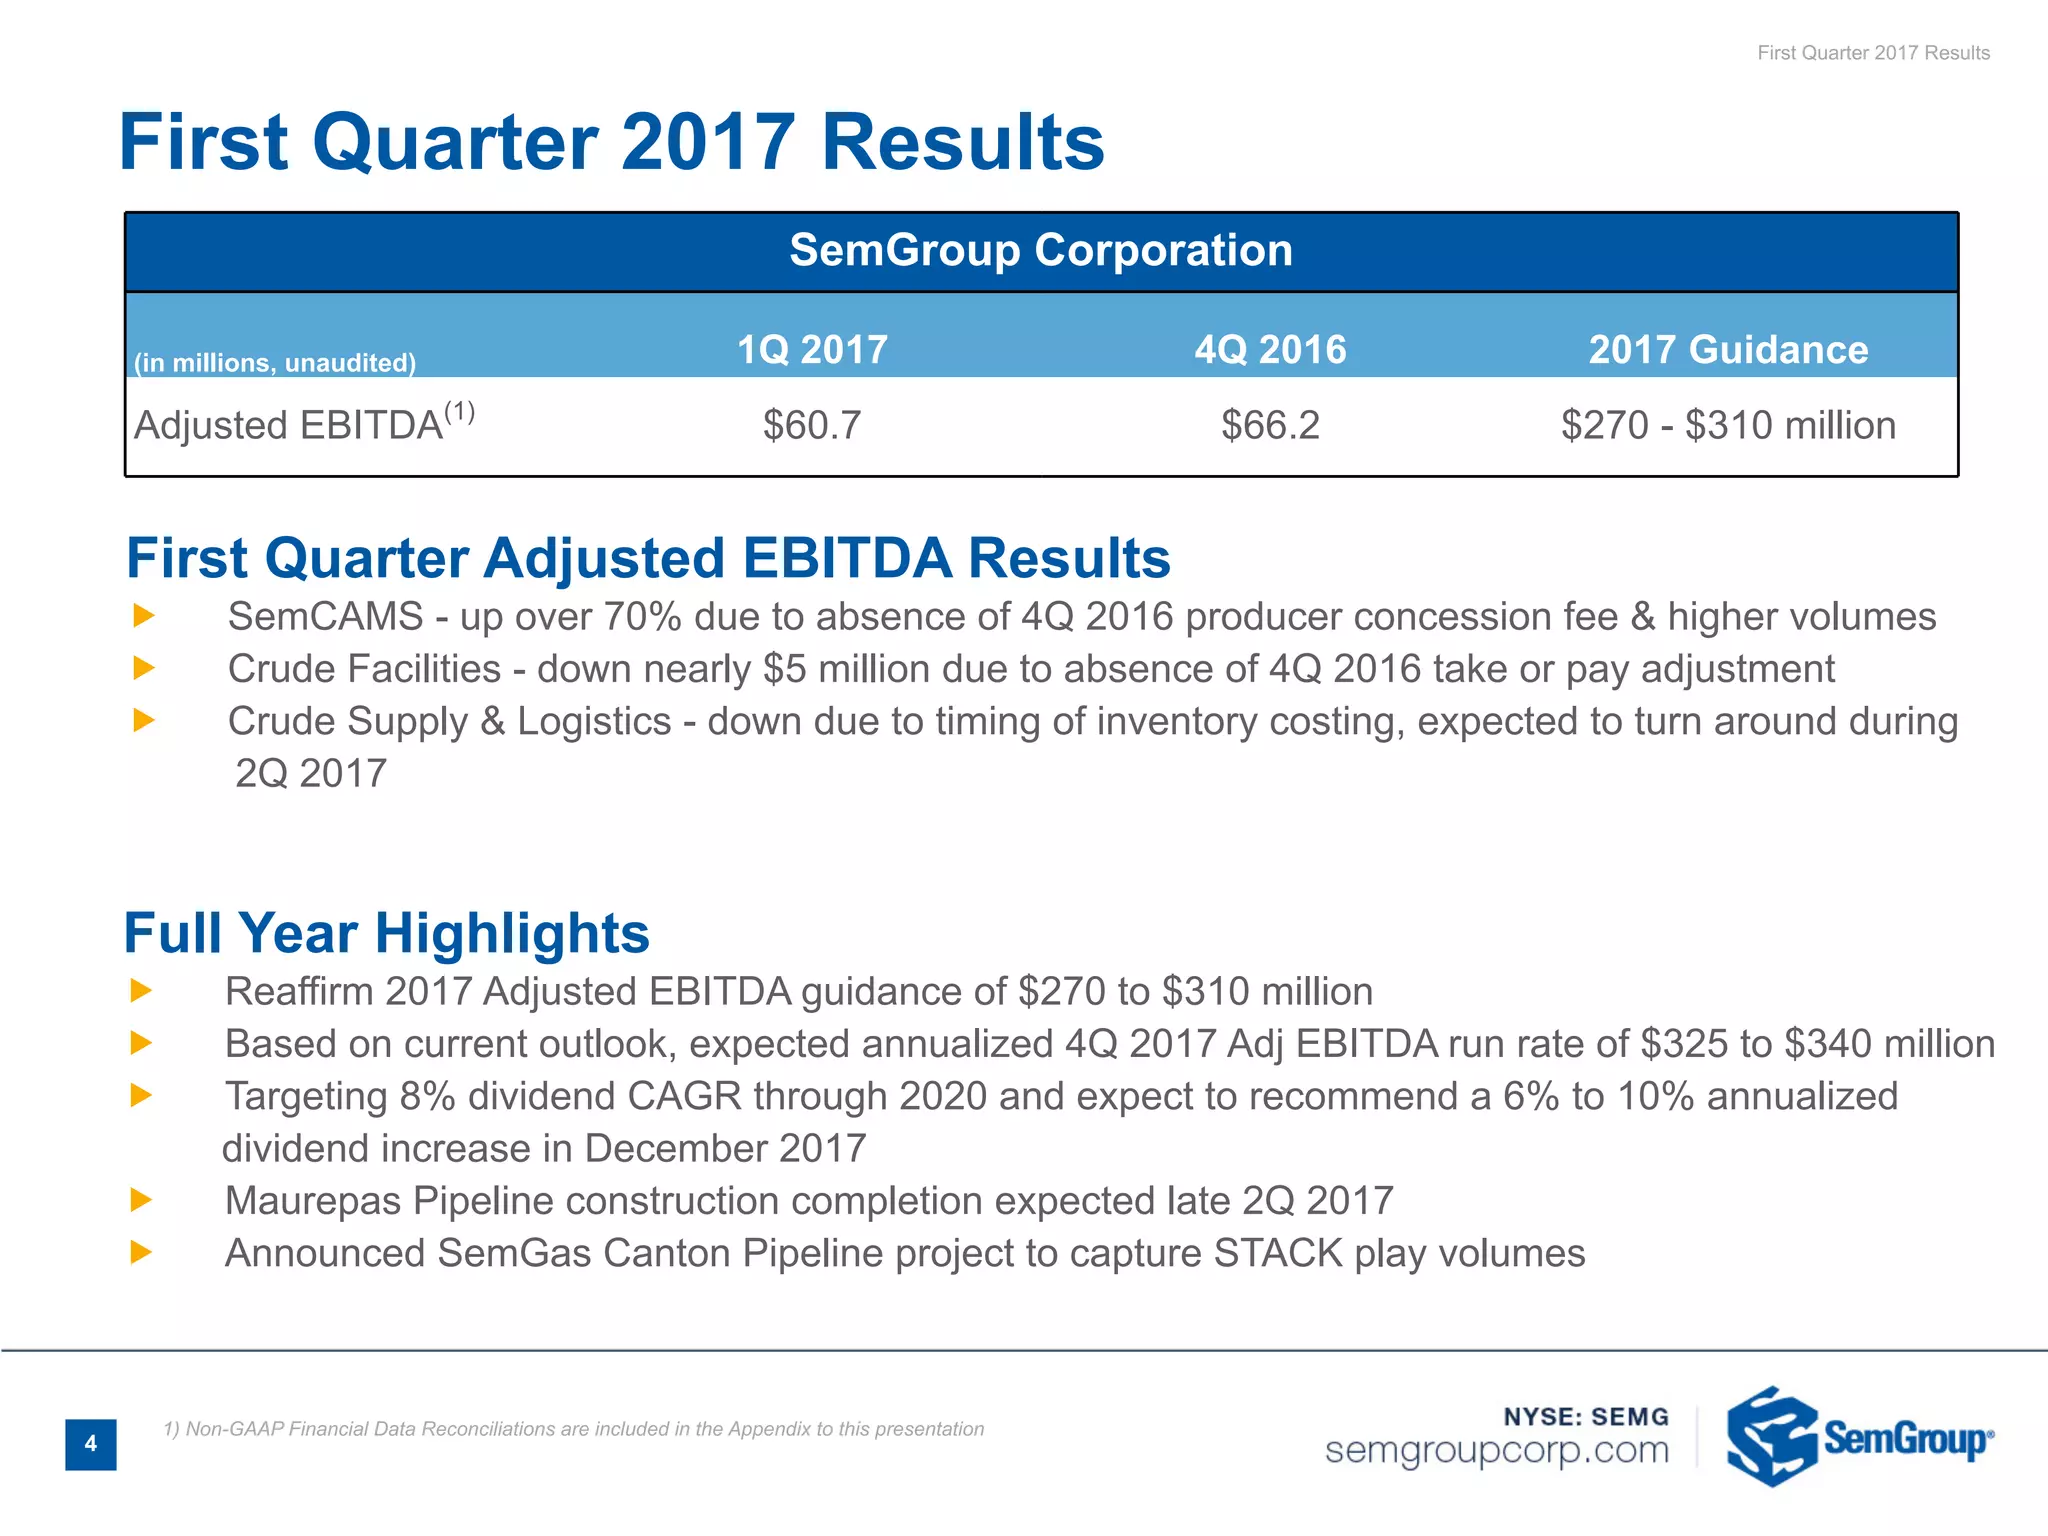
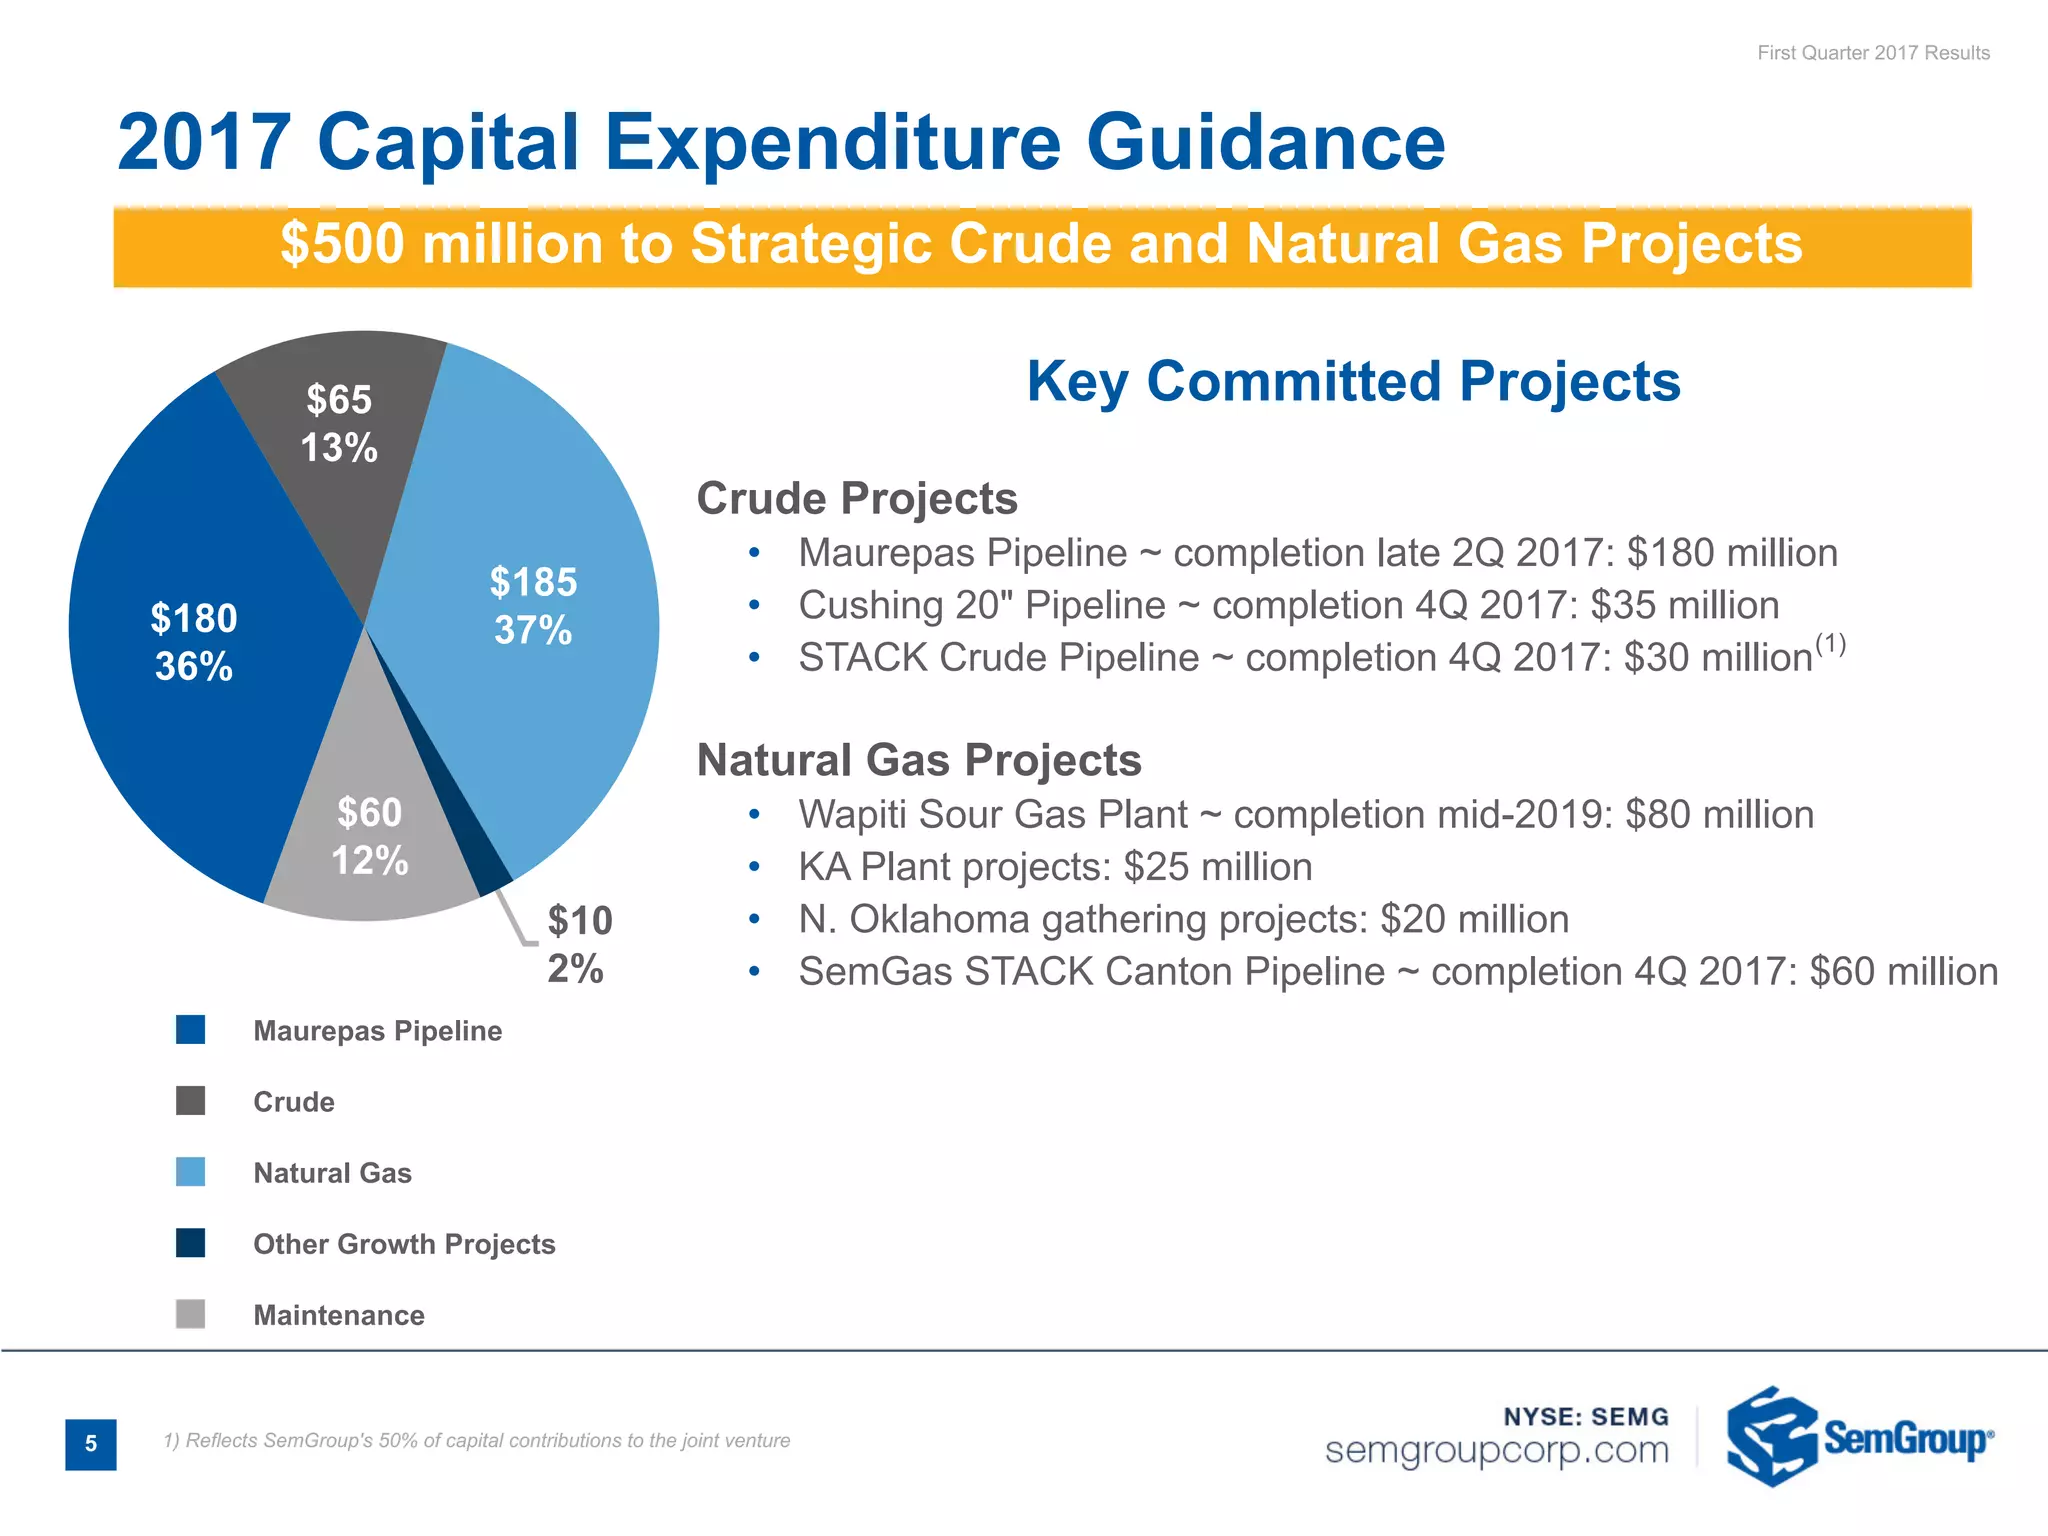
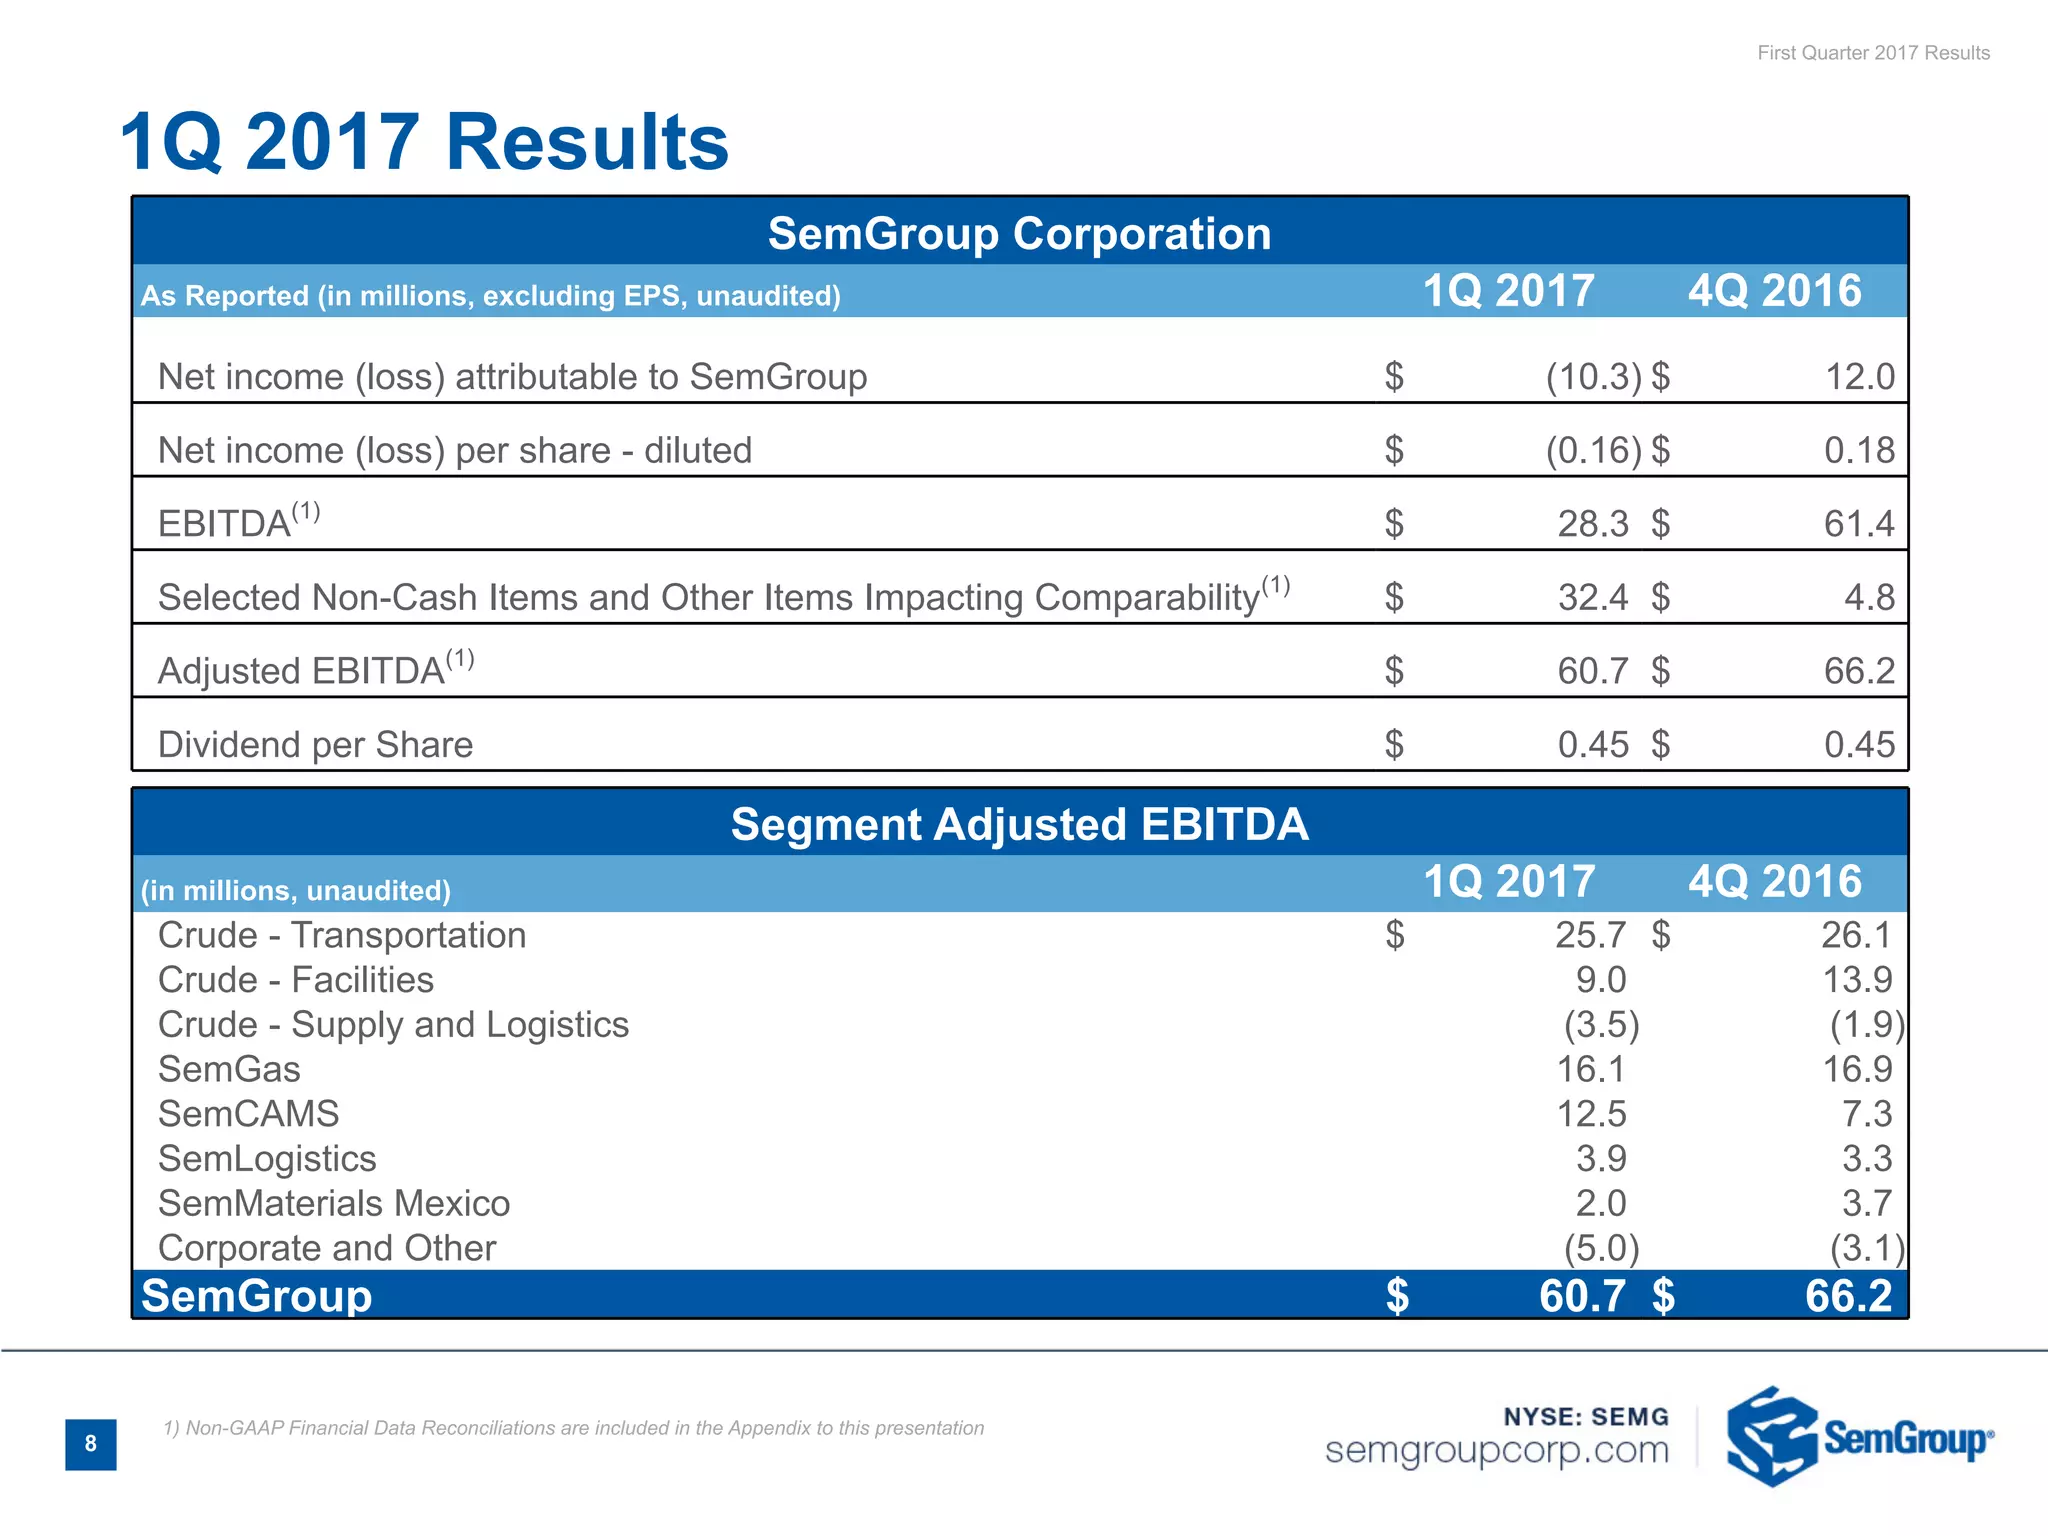
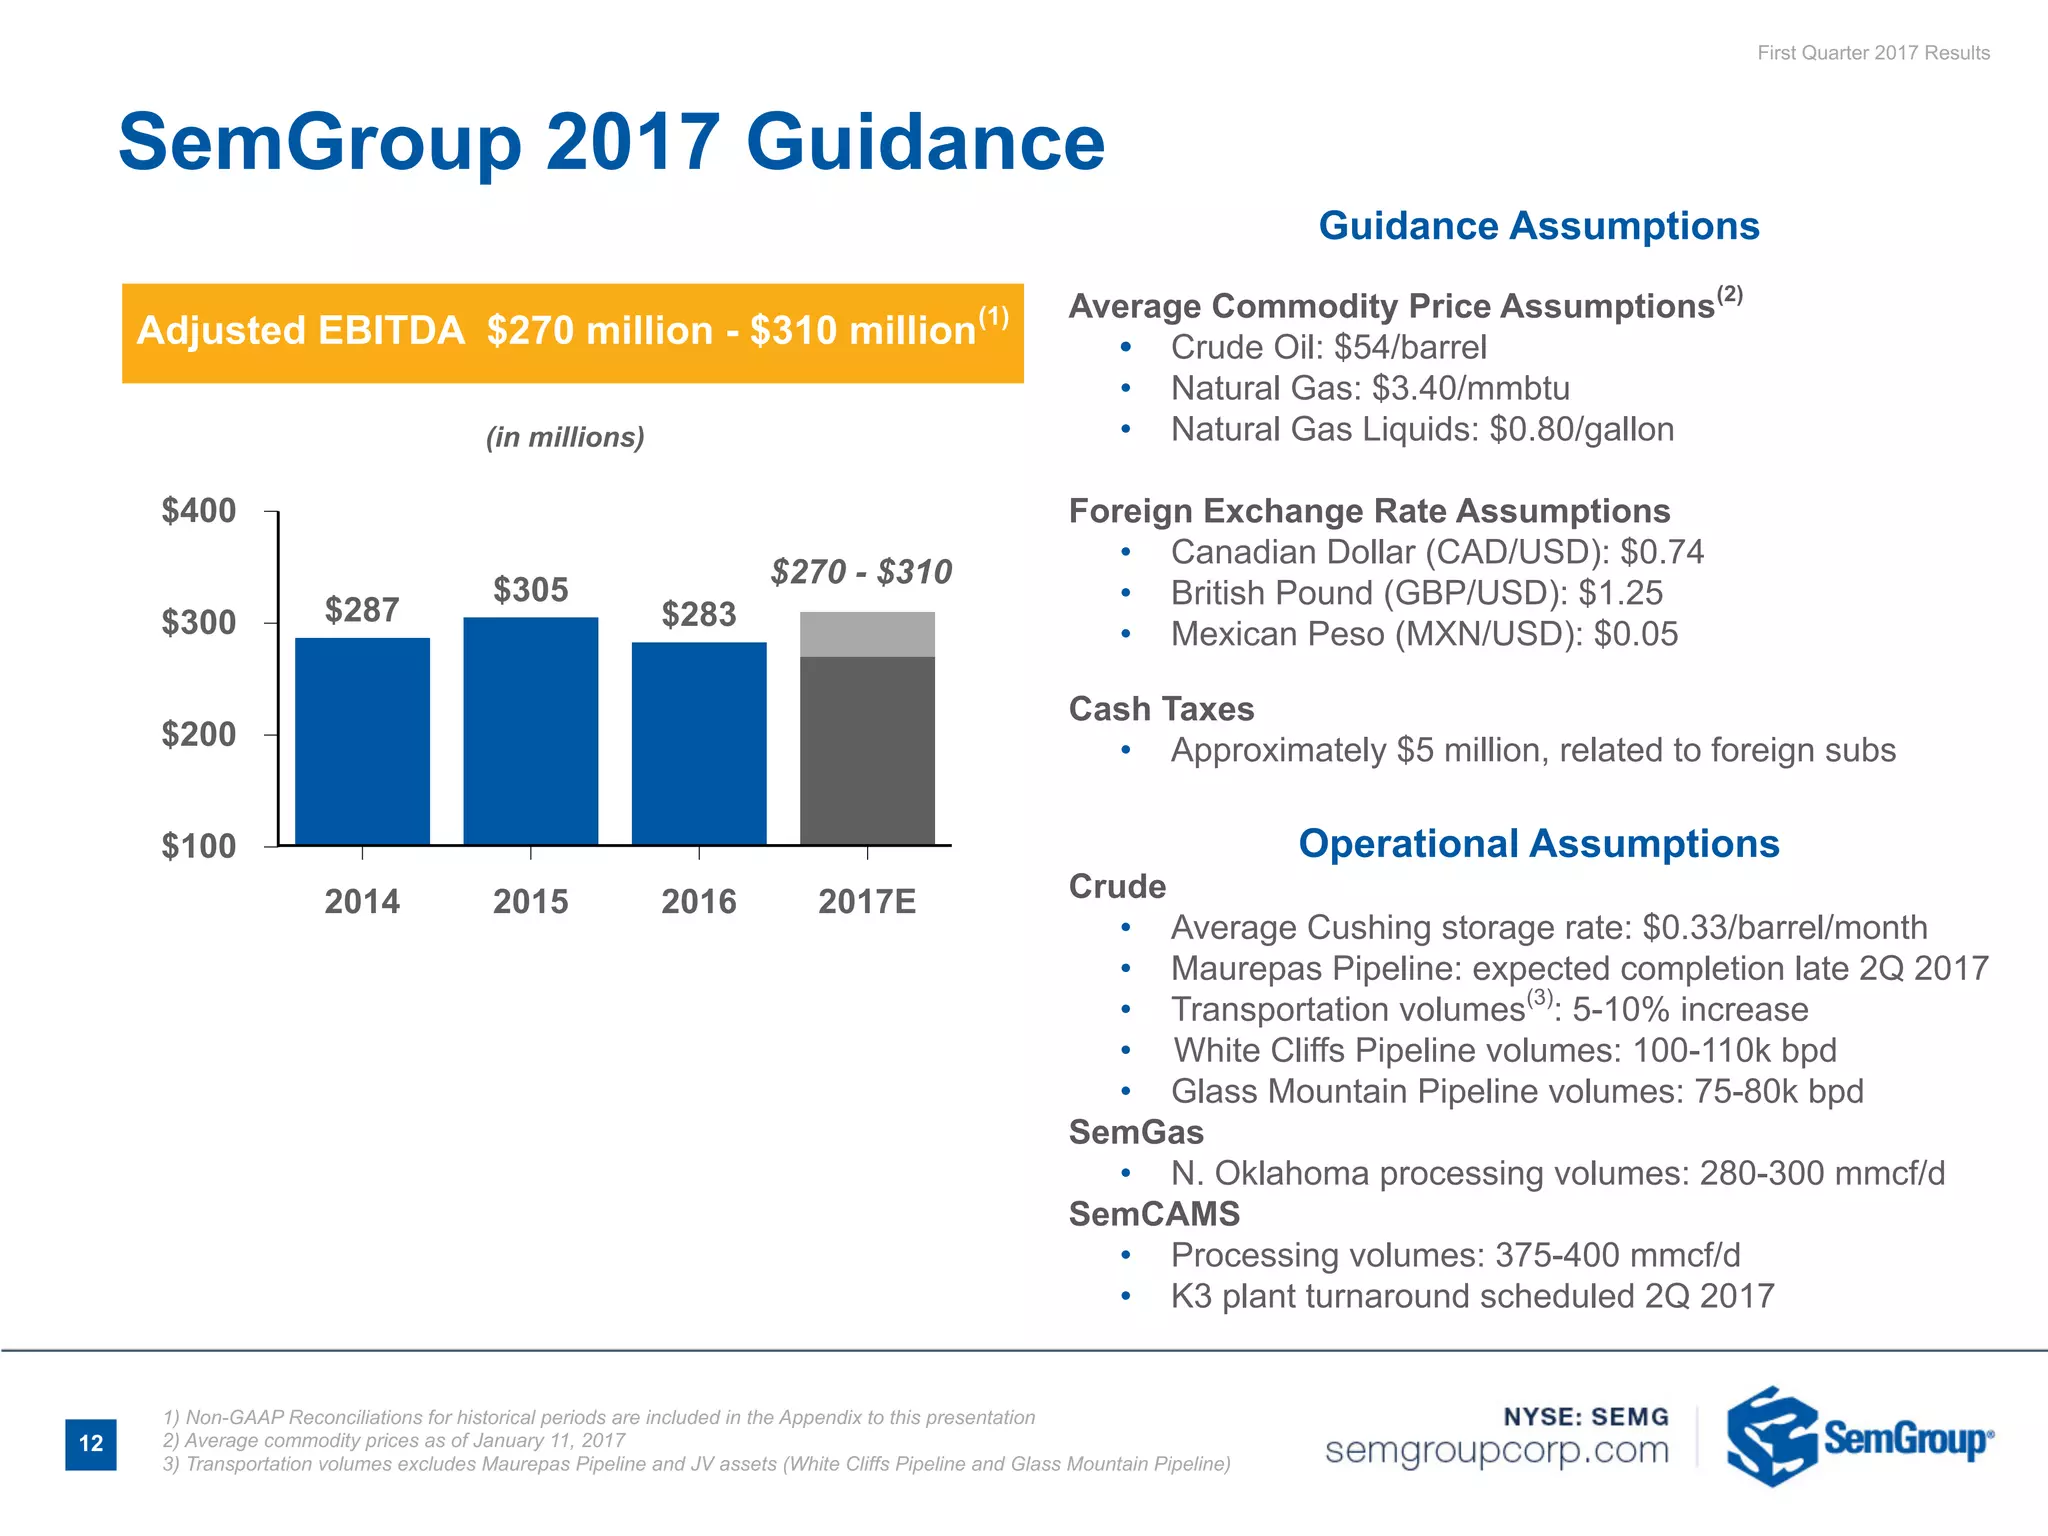
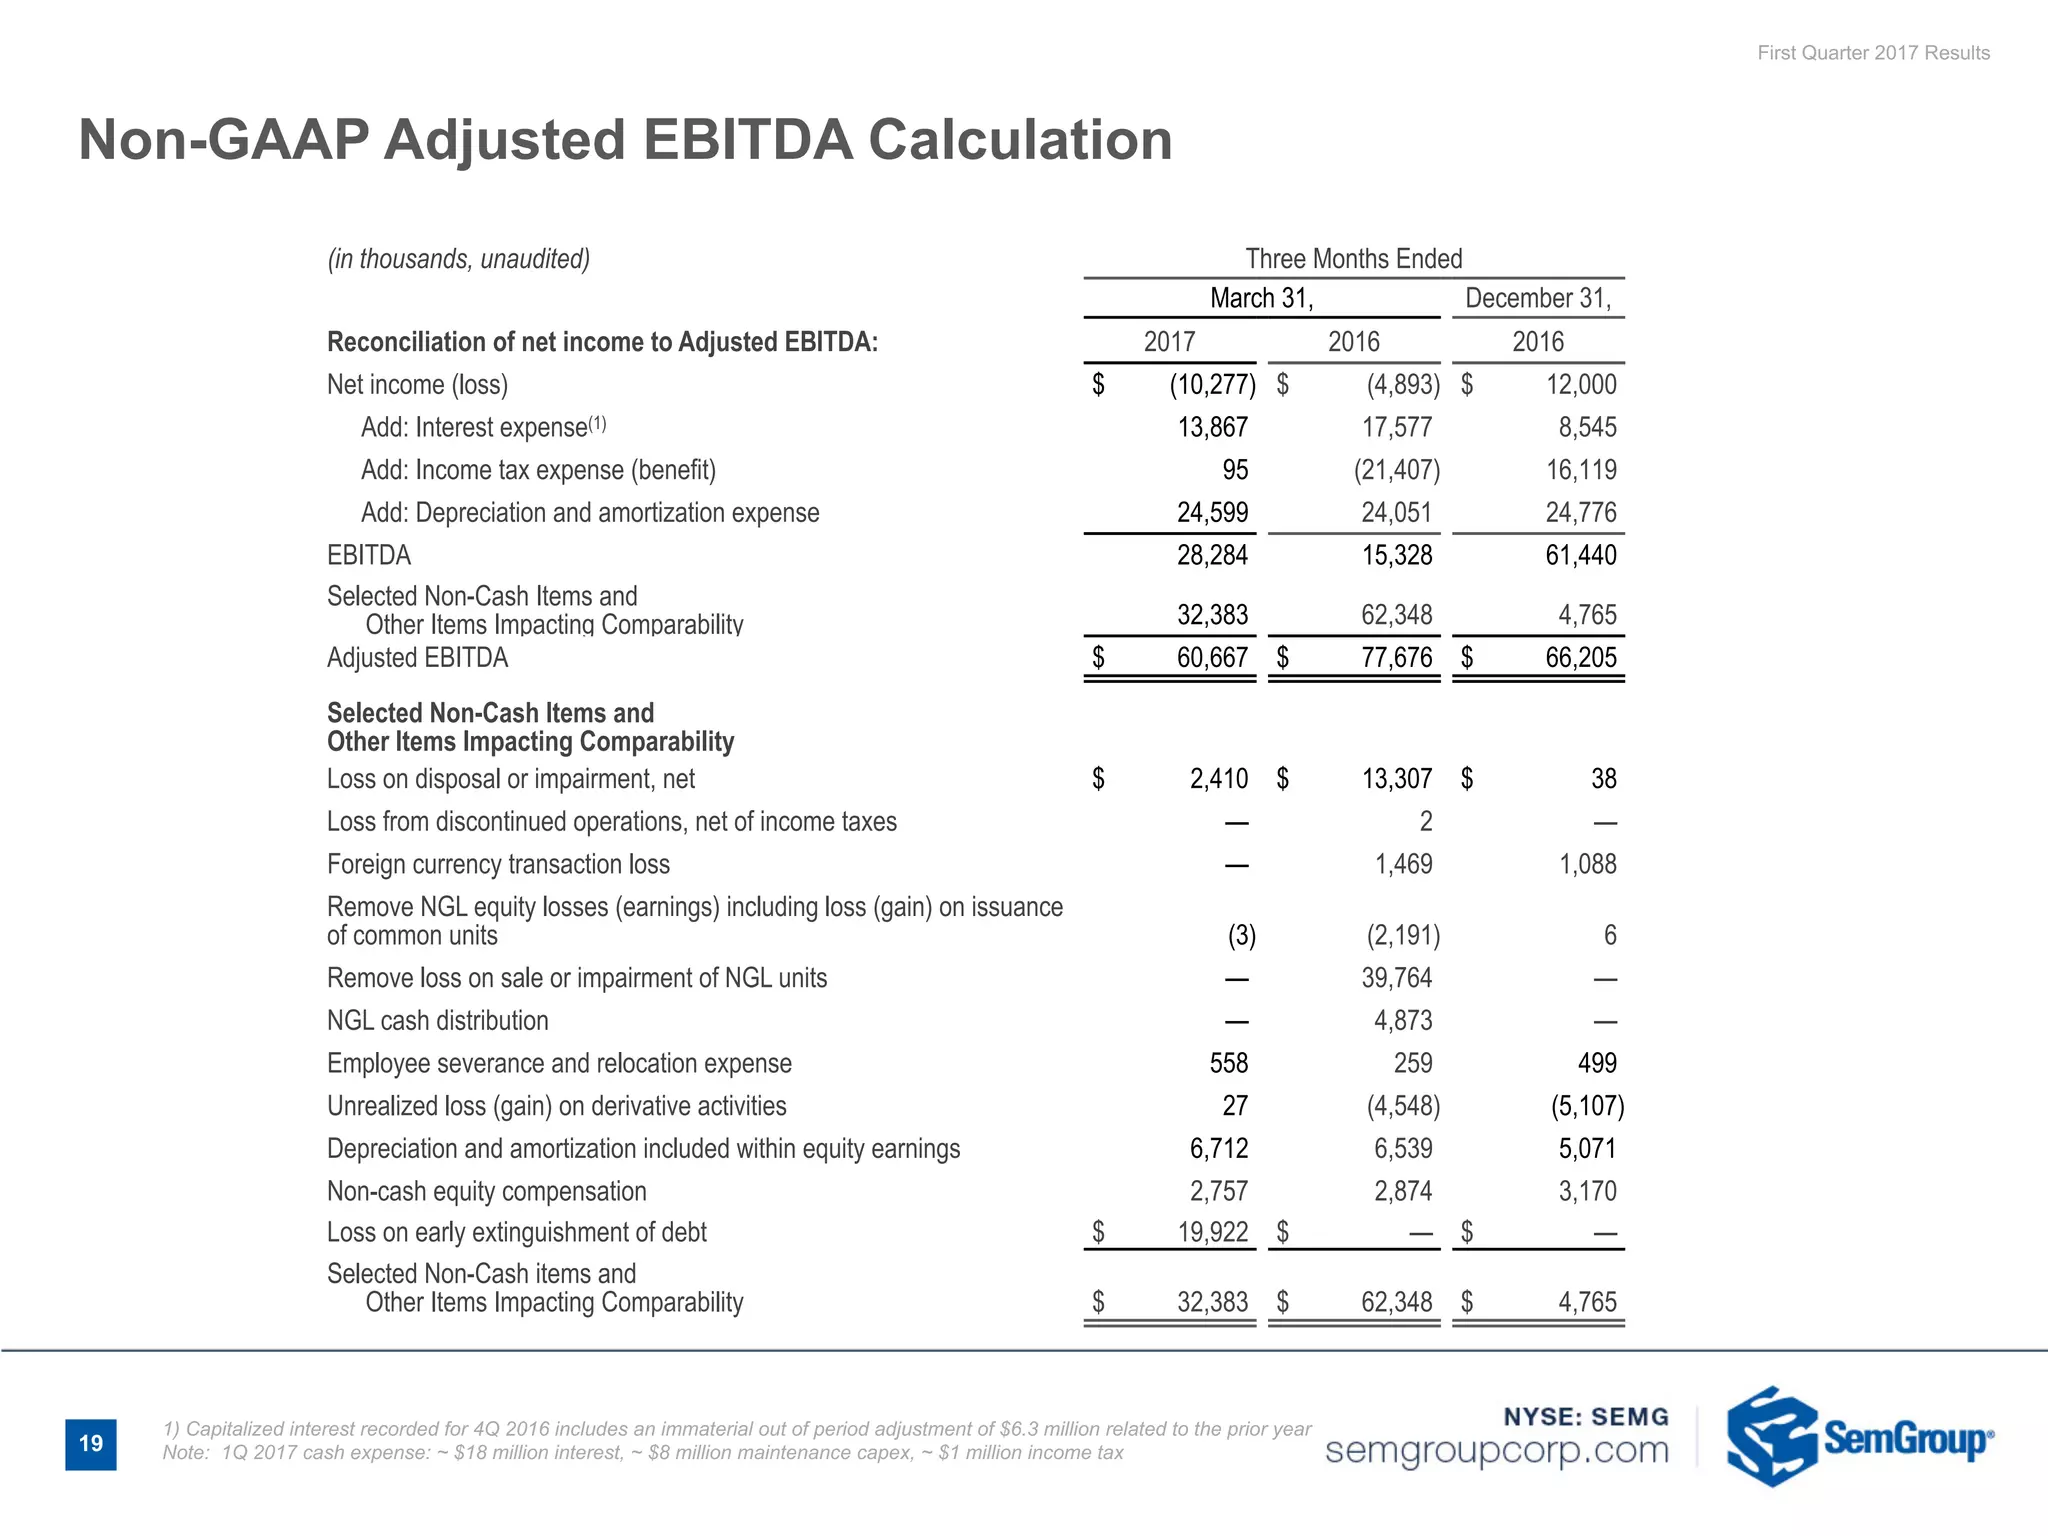
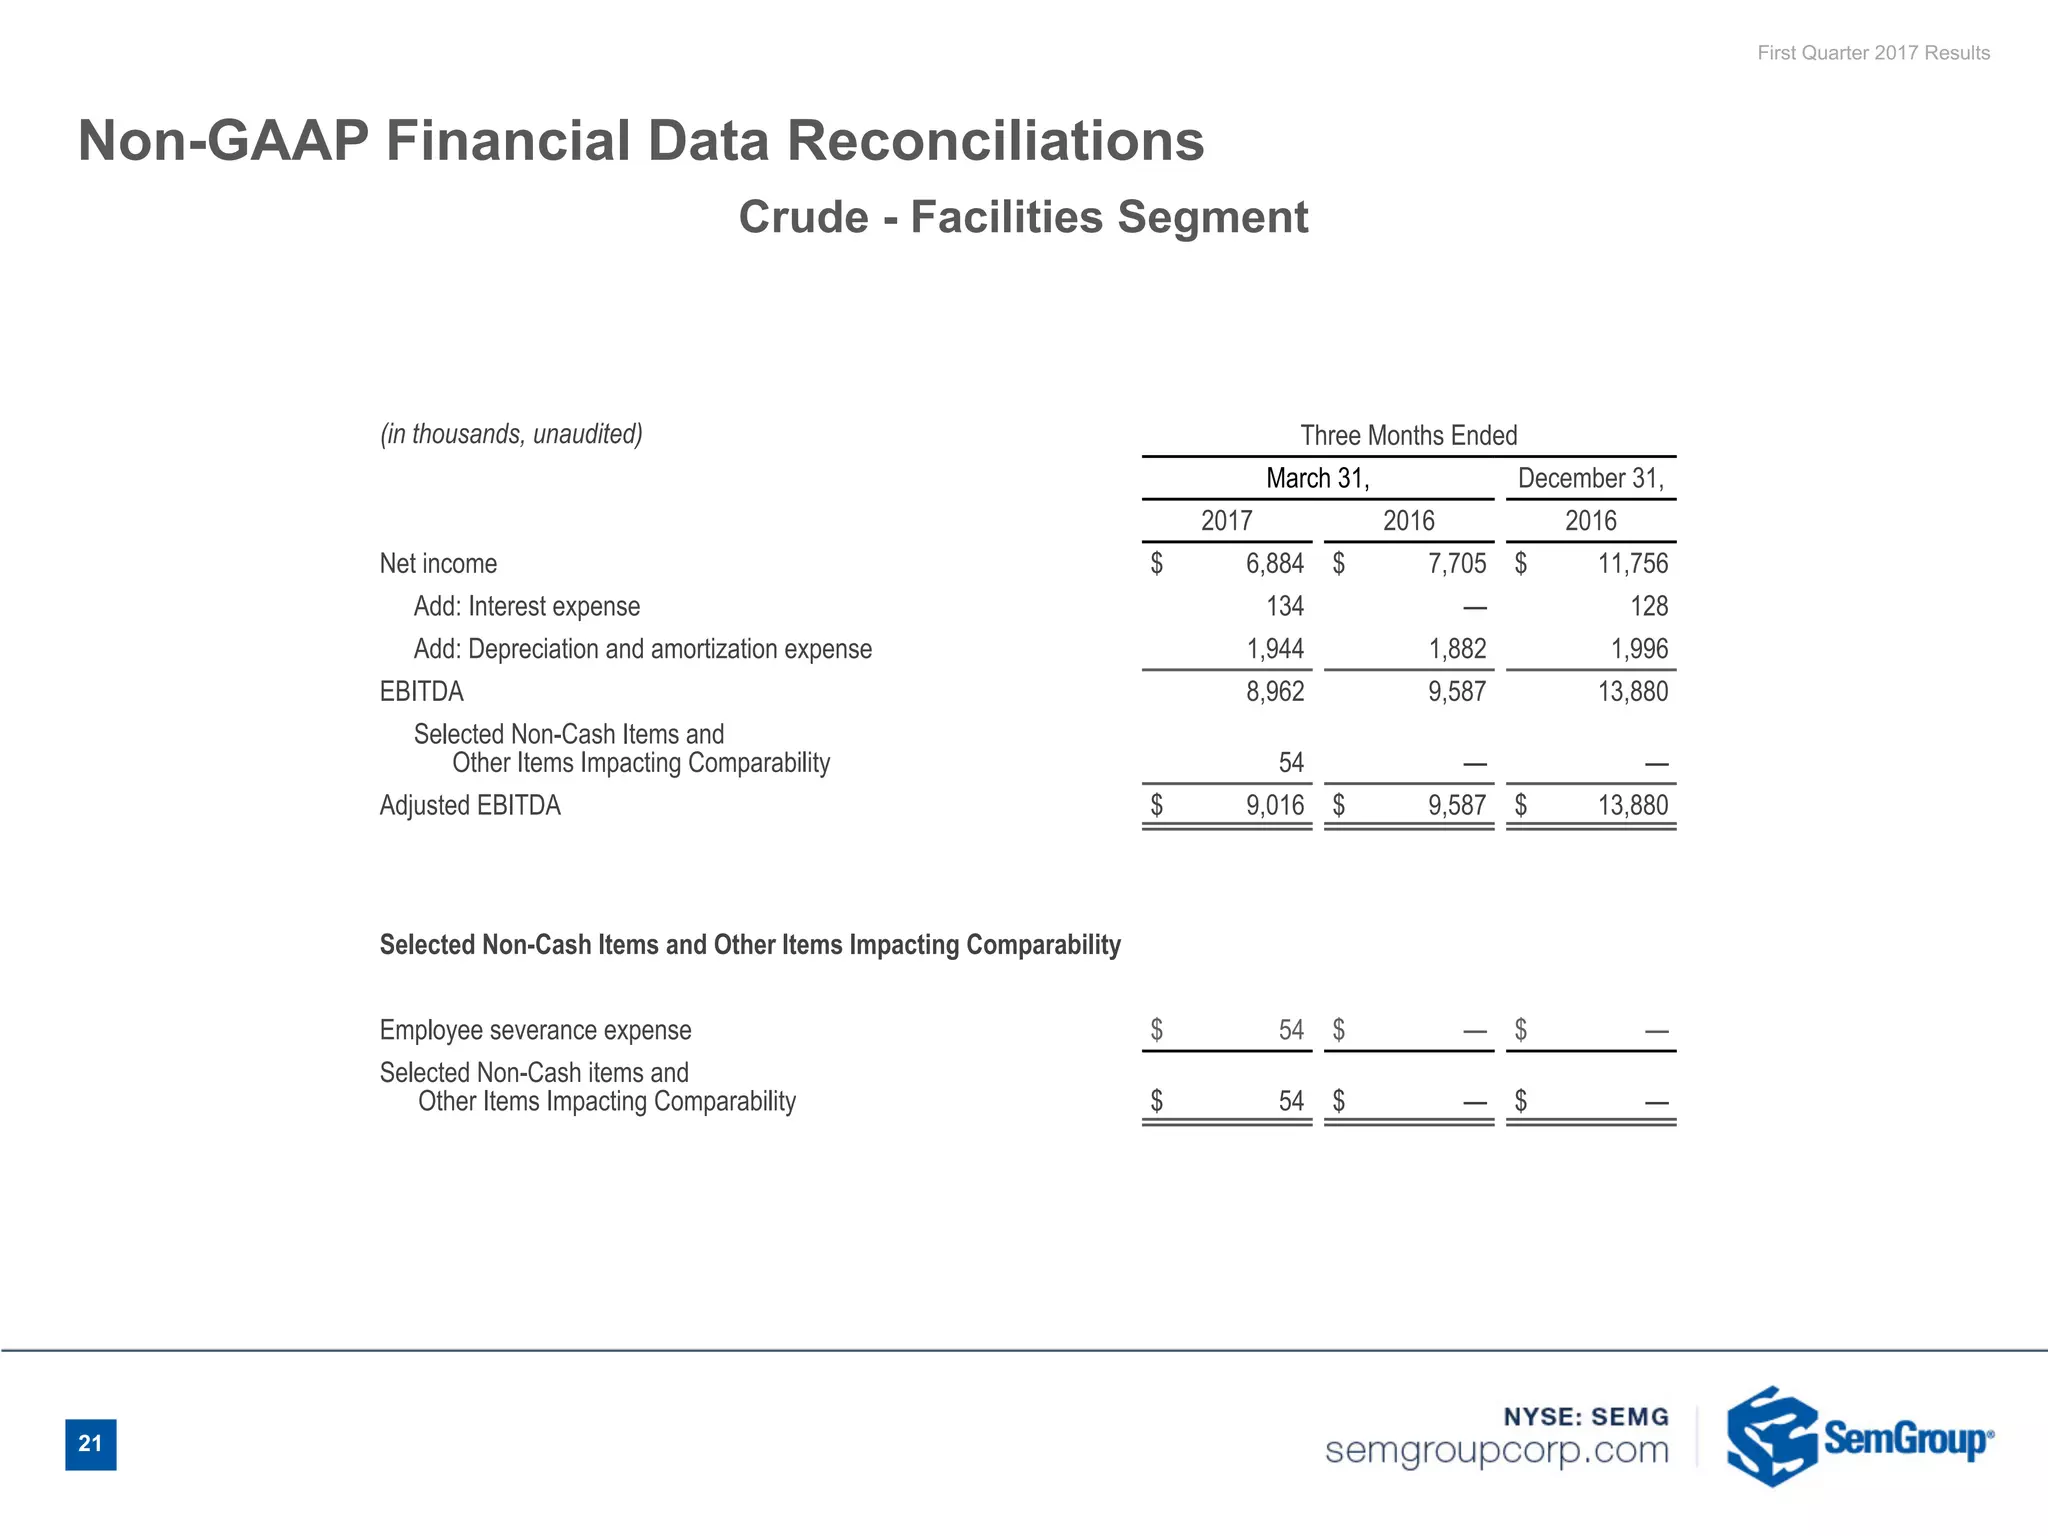
SemGroup reported adjusted EBITDA of $60.7 million for the first quarter of 2017, down from $66.2 million in the fourth quarter of 2016. The Crude Facilities segment was down nearly $5 million due to the absence of a take-or-pay adjustment in the prior quarter. SemGroup reaffirmed its 2017 adjusted EBITDA guidance range of $270-310 million and expects its annualized fourth quarter 2017 adjusted EBITDA run rate to be between $325-340 million. Key growth projects including the Maurepas Pipeline and SemGas Canton Pipeline are on track for completion by the end of 2017.
This document discusses SemGroup's non-GAAP financial measure of Adjusted EBITDA. It explains that Adjusted EBITDA excludes certain non-cash and other selected items in order to increase comparability between reporting periods. It also notes that SemGroup does not provide guidance for net income due to non-cash items that cannot be accurately forecasted. Additionally, the document contains forward-looking statements regarding SemGroup's prospects, financial performance, annual dividend growth, capital expenditures, and other matters.
This document provides an investor presentation for SemGroup's second quarter 2017 results. It discusses SemGroup's non-GAAP financial measure of Adjusted EBITDA, noting that it excludes certain items to increase comparability between reporting periods. It also contains forward-looking statements regarding SemGroup's prospects, financial performance, annual dividend growth, and other matters. Finally, it outlines SemGroup's strategy of transforming into a diversified energy infrastructure company through acquisitions in the Gulf Coast, STACK play, and Duvernay/Montney regions to generate stable cash flows under contracts with investment-grade counterparties.
- SemGroup reported a 40% increase in Adjusted EBITDA for the third quarter compared to the second quarter due to the Maurepas Pipeline becoming fully operational and the acquisition of HFOTCO commencing in mid-July.
- SemGroup's strategic focus is on growing EBITDA through increased secure cash flows from core geographic regions like Canada, the Mid-Continent region, and the Gulf Coast.
- SemGroup is making progress on raising the $600 million needed for the second payment for the HFOTCO acquisition, with plans to fully pay by the end of the first quarter of 2018 to capture an early payment discount, including through the sale of its interest in the Glass Mountain Pipeline for $
The document discusses SemGroup's second quarter 2017 results and HFOTCO acquisition. Key points include:
- SemGroup completed its acquisition of HFOTCO in July 2017 for initial consideration of $1.5 billion including cash, debt assumption, and shares issued. A second $600 million cash payment is due by end of 2018.
- Base business performed as expected in Q2 2017. Several new pipeline projects were completed or are under construction to expand infrastructure.
- SemGroup is focused on funding the second HFOTCO payment through options like asset sales, partnerships, or equity offerings. Integration of HFOTCO is proceeding as planned.
- SemGroup reported third quarter 2016 results with Adjusted EBITDA of $71.3 million, down from $77.7 million in the first quarter of 2016. Net income was a loss of $7.4 million.
- For full year 2016, SemGroup updated capital expenditures guidance to $350 million, a $100 million reduction due to timing of the Maurepas pipeline project.
- SemGroup has a strong balance sheet with $1.1 billion in liquidity and a leverage ratio of 3.0x at the end of the third quarter, within its target leverage of below 4.5x.
- SemGroup reported a 40% increase in Adjusted EBITDA for the third quarter compared to the second quarter due to the Maurepas Pipeline becoming fully operational and the acquisition of HFOTCO commencing in mid-July.
- SemGroup's strategic focus is on growing EBITDA through increased secure cash flows from core geographic regions like Canada, the Mid-Continent region, and the Gulf Coast.
- SemGroup is making progress on raising the $600 million needed for the second payment for the HFOTCO acquisition, with plans to fully pay by the end of the first quarter of 2018 to capture an early payment discount, including through the sale of its interest in the Glass Mountain Pipeline for $
The document provides an overview of SemGroup's non-GAAP financial measure of Adjusted EBITDA. It explains that Adjusted EBITDA excludes certain non-cash and selected items in order to increase comparability between reporting periods and is used by management for internal analysis. However, readers should be aware that variations in operating results are also caused by numerous other factors not adjusted for. The document also contains forward-looking statements regarding SemGroup's strategic focus and expectations.
SemGroup reported fourth quarter and full-year 2017 results. Key highlights include $111 million in Adjusted EBITDA for Q4 and $328 million for the full year. SemGroup also executed several strategic transactions including a $350 million preferred equity raise, selling its interest in Glass Mountain Pipeline for $300 million, and estimated proceeds of $140 million from selling SemMaterials Mexico and SemLogistics assets. SemGroup provided 2018 Adjusted EBITDA guidance of $385-$415 million and capital expenditures guidance of $40 million for maintenance spending.
Sem group investor presentation post 4Q and FY 2016 earnings finalSemGroupCorporation
This document discusses SemGroup's non-GAAP financial measure of Adjusted EBITDA and provides context around its use. It notes that Adjusted EBITDA excludes certain non-cash and other selected items in order to increase comparability between reporting periods. It also contains forward-looking statements regarding SemGroup's expectations for future financial performance and growth opportunities.
This document provides an overview of SemGroup's non-GAAP financial measures and forward-looking statements. It summarizes SemGroup's 2017 results as a year of transition with the addition of stable refinery-facing assets and geographic diversification. It outlines 2018 as a year of executing the operating budget and strategic plan by streamlining operations and focusing on three high quality areas: Canada, Mid-Continent and Gulf Coast. The document also provides definitions of SemGroup's non-GAAP measures of Adjusted EBITDA and Total Segment Profit, which exclude certain items to improve comparability between reporting periods, and cautions that non-GAAP measures should not be considered in isolation.
This document provides an overview of SemGroup's non-GAAP financial measures and forward-looking statements. It defines Adjusted EBITDA and Total Segment Profit as non-GAAP measures used by management to evaluate performance that exclude certain items for comparability between periods. It also notes the limitations of non-GAAP measures and cautions readers. The document discloses risks to forward-looking statements and provides an overview of SemGroup's midstream assets in key regions.
The document discusses SemGroup's use of non-GAAP financial measures like Adjusted EBITDA and Total Segment Profit to evaluate financial performance. It defines these measures and explains how they are calculated and why management finds them useful, while also noting their limitations. It also contains forward-looking statements about SemGroup's prospects, financial performance, growth plans and risks.
This document summarizes SemGroup's first quarter 2018 earnings conference call. It discusses SemGroup's non-GAAP financial measures of Adjusted EBITDA and Total Segment Profit, which exclude certain items to make performance more comparable between periods. The document also warns that non-GAAP measures have limitations and should not be considered in isolation as substitutes for GAAP measures. Additionally, the document contains forward-looking statements regarding SemGroup's 2018 operating budget, capital expenditures plan, and recent capital raising activities totaling around $800 million.
This document provides an overview of SemGroup's non-GAAP financial measures, forward-looking statements, and strategy for creating shareholder value. It discusses SemGroup's stable cash flows derived from long-term contracts and investment-grade counterparties. The presentation also outlines SemGroup's crude oil and natural gas assets located in key North American basins and its strategy to pursue organic growth and strategic acquisitions.
This document provides an overview of SemGroup's non-GAAP financial measures, forward-looking statements, and strategic growth plan. It discusses SemGroup's Adjusted EBITDA measure and why certain items are excluded. It also notes key limitations of non-GAAP measures and that management compensates for these limitations. An overview is then provided of SemGroup's crude and natural gas assets, operations, and strategic growth areas. Key performance metrics and asset details are highlighted for SemGroup's crude and natural gas businesses.
SemGroup held an earnings conference call on August 5, 2016 to discuss its second quarter 2016 results. The call began with forward-looking statements and information regarding SemGroup and Rose Rock Midstream's use of social media. SemGroup reported adjusted EBITDA of $67.6 million for the quarter, down from $77.7 million in the previous quarter. Rose Rock Midstream reported adjusted EBITDA of $44.9 million, down from $49 million in the first quarter of 2016. SemGroup and Rose Rock maintained strong liquidity with over $720 million and $514 million respectively available.
This investor presentation provides an overview of SemGroup Corporation and Rose Rock Midstream for the second quarter of 2015. It discusses forward-looking statements and non-GAAP financial measures. The presentation then summarizes the two companies' ownership structures and business strategies, focusing on generating quality cash flows through fee-based activities and pursuing organic and acquisition growth opportunities in crude and gas assets. Maps show the companies' assets in key shale basins like the DJ Basin.
The document is an investor presentation for SemGroup Corporation and Rose Rock Midstream for the first quarter of 2015. It provides an overview of the companies' operations, including natural gas and crude oil assets. SemGroup plans to invest $775 million in growth projects in 2015, with over 90% focused on expanding its natural gas gathering and processing facilities and crude oil infrastructure and storage assets. The presentation also highlights several new pipeline projects and facility expansions underway.
This document contains an investor presentation for Crestwood Midstream Partners LP and Crestwood Equity Partners LP. The presentation highlights the companies' diversified portfolio of midstream assets across major US basins, including the Bakken, Delaware Basin, PRB Niobrara, and Marcellus. Over 85% of forecasted 2017 EBITDA is supported by take-or-pay or fixed-fee contracts with investment grade customers. The presentation outlines Crestwood's organic growth strategy through 2018-2021 focused on high-return expansion projects around its core assets to drive distributable cash flow per unit growth.
SEMG and RRMS Report 4Q and Full Year ReslutsKiley Roberson
The document provides financial results and guidance for SemGroup Corporation and its subsidiary Rose Rock Midstream for the fourth quarter and full year 2015. Some key points:
- SemGroup adjusted EBITDA increased 6% in 2015 compared to 2014. Rose Rock adjusted EBITDA increased nearly 40%.
- 2016 adjusted EBITDA guidance provided for SemGroup of $270-320 million and for Rose Rock of $165-185 million.
- Capital expenditures of $522 million in 2015 were outlined, and 2016 capital expenditures guidance of $455 million was given.
First Quarter 2016 Results
- SemGroup reported adjusted EBITDA of $77.7 million for the first quarter of 2016, down slightly from $79.3 million in the fourth quarter of 2015.
- Rose Rock Midstream reported adjusted EBITDA of $49.0 million for the first quarter of 2016, up from $46.6 million in the fourth quarter of 2015.
- SemGroup maintained its 2016 adjusted EBITDA guidance of $270-320 million and Rose Rock Midstream maintained its 2016 adjusted EBITDA guidance of $165-185 million.
The document provides an overview of SemGroup Corporation and Rose Rock Midstream's use of non-GAAP financial measures like Adjusted EBITDA to evaluate performance in addition to GAAP measures. It explains that while non-GAAP measures provide additional information, they have limitations and may not be comparable between companies. Reconciliations of non-GAAP to GAAP measures are provided on their websites. The document also presents financial information, operational details, growth strategies and capital expenditure plans for SemGroup's crude oil and natural gas businesses.
The document provides an overview of SemGroup's third quarter 2018 results. Key points include:
- Adjusted EBITDA was $96.4 million for the quarter.
- The company declared a quarterly dividend of $0.4725 per share, with dividend coverage of 1.4x.
- Capital expenditures guidance for 2018 was updated to $360 million, up 3% from prior guidance.
- Several growth projects across the Gulf Coast, Mid-Continent and Canada regions are expected to drive financial growth through 2020 and beyond.
The document provides an overview of SemGroup's third quarter 2018 results. Key points include:
- Adjusted EBITDA was $96.4 million for the quarter.
- A quarterly dividend of $0.4725 per share was declared, with dividend coverage of 1.4x.
- Capital expenditures guidance for 2018 was updated to $360 million, up 3% from prior guidance.
- Execution continued on strategic projects in the Gulf Coast, Mid-Continent and Canada expected to drive growth in 2019 and beyond.
US Foods reported positive Q1 2017 results with 6.1% growth in adjusted EBITDA. Volume grew 4% driven by increases across all customer types including independent restaurants and healthcare. Management was pleased with progress on their strategic plan and cost savings initiatives. The company also completed two acquisitions in the quarter and maintained a strong balance sheet and liquidity. Full year 2017 guidance was unchanged with expectations for 7-10% adjusted EBITDA growth and 15-20% net income growth.
The document provides an overview of SemGroup's non-GAAP financial measures and forward-looking statements. It discusses Adjusted EBITDA, Cash Available for Dividends, and Total Segment Profit, which are not GAAP measures. It also notes that SemGroup does not provide guidance for net income due to non-cash items that cannot be accurately forecasted. The document contains statements regarding SemGroup's prospects, plans, expectations and outlook that are considered forward-looking under securities laws, and are subject to risks and uncertainties.
This document provides an investor presentation for SemGroup's second quarter 2017 results. It discusses SemGroup's non-GAAP financial measure of Adjusted EBITDA, noting that it excludes certain items to increase comparability between reporting periods. It also contains forward-looking statements regarding SemGroup's prospects, financial performance, annual dividend growth, and other matters. Finally, it outlines SemGroup's strategy of transforming into a diversified energy infrastructure company through acquisitions in the Gulf Coast, STACK play, and Duvernay/Montney regions to generate stable cash flows under contracts with investment-grade counterparties.
This document provides an overview of SemGroup's non-GAAP financial measures and forward-looking statements. It discusses how SemGroup uses Adjusted EBITDA and Total Segment Profit to evaluate performance in addition to GAAP measures. It also notes that SemGroup's forward-looking statements are based on current expectations and are subject to risks and uncertainties. The document warns that actual results could differ materially from expectations.
This document provides an overview of SemGroup's non-GAAP financial measures, forward-looking statements, and strategy for creating shareholder value. It discusses SemGroup's stable cash flows derived from long-term contracts and investment-grade counterparties. The presentation also outlines SemGroup's crude oil and natural gas assets located in key North American basins and its strategy to pursue organic growth and strategic acquisitions.
This document provides a non-GAAP financial measure called Adjusted EBITDA used by SemGroup. It explains that Adjusted EBITDA excludes selected non-cash and other items to increase comparability between reporting periods and is used by management and discussed with investors. However, it has limitations as an analytical tool since it excludes some items affecting the most directly comparable GAAP measure. The document also provides forward-looking statements about SemGroup's prospects, financial performance, growth plans, and managing risks in a lower commodity price environment. It highlights SemGroup's strengths including stable cash flows from contracts and investment-grade counterparties.
First Quarter 2016 Results
- SemGroup reported adjusted EBITDA of $77.7 million for the first quarter of 2016, down slightly from $79.3 million in the fourth quarter of 2015.
- Rose Rock Midstream reported adjusted EBITDA of $49.0 million for the first quarter of 2016, up from $46.6 million in the fourth quarter of 2015.
- SemGroup maintained its 2016 adjusted EBITDA guidance of $270-320 million and Rose Rock Midstream maintained its 2016 adjusted EBITDA guidance of $165-185 million.
Sem group earnings presentation 4q & full year-2018_finalSemGroupCorporation
Fourth Quarter and Full-Year 2018 Results Earnings Conference Call
In 3 sentences:
SemGroup reported adjusted EBITDA of $394 million for full-year 2018, an increase from $328 million in 2017. For 2019, SemGroup expects adjusted EBITDA between $420-465 million. SemGroup also provided 2019 capital expenditure guidance of $307 million, with $150 million allocated for growth projects in the U.S. and $230 million for the SemCAMS Midstream joint venture in Canada.
Sem group earnings presentation 4q & full year 2018 finalSemGroupCorporation
Fourth Quarter and Full-Year 2018 Results Earnings Conference Call February 27, 2019
The document discusses SemGroup's non-GAAP financial measures including Adjusted EBITDA, Cash Available for Dividends, and Total Segment Profit which are used to evaluate performance but are not substitutes for GAAP measures. It provides definitions and adjustments for each measure. The document also contains forward-looking statements regarding SemGroup's prospects, financial performance, annual dividend growth, and other matters which are subject to known and unknown risks that could cause actual results to differ.
The document discusses SemGroup's non-GAAP financial measures of Adjusted EBITDA, Cash Available for Dividends (CAFD) and Total Segment Profit. It explains that Adjusted EBITDA removes certain selected items from net income to improve comparability between periods and includes a list of the types of items generally excluded. CAFD is based on Adjusted EBITDA less certain cash payments to analyze performance after obligations. Total Segment Profit represents revenue less costs and expenses, adjusted for certain items, and is how management assesses segment performance. The measures are used by management and may be presented to investors but have limitations as analytical tools.
This document summarizes SemGroup's second quarter 2018 earnings conference call. It discusses non-GAAP financial measures used by SemGroup like Adjusted EBITDA, Cash Available for Dividends, and Total Segment Profit. It provides definitions of these terms and notes that they are not substitutes for GAAP measures but are used by management to evaluate performance. The document also contains forward-looking statements about SemGroup's prospects, plans, and financial performance that are based on current expectations and assumptions which involve risks and uncertainties.
Sem cams investor presentation master september 2018 finalSemGroupCorporation
The document discusses SemGroup's non-GAAP financial measures and provides forward-looking statements. It includes the following key points:
- SemGroup uses measures like Adjusted EBITDA, Cash Available for Dividends, and Total Segment Profit to evaluate performance, which are not substitutes for GAAP measures.
- Adjusted EBITDA excludes selected non-cash and other items to improve comparability between periods.
- Cash Available for Dividends is based on Adjusted EBITDA less certain cash expenses and capital expenditures.
- Total Segment Profit assesses performance at the segment level and excludes certain items.
- The document cautions that non-GAAP measures have limitations
This document provides an overview of SemGroup's non-GAAP financial measures and forward-looking statements. It defines Adjusted EBITDA, Cash Available for Dividends, and Total Segment Profit as non-GAAP measures used by management to evaluate performance that exclude certain items affecting comparability between periods. It cautions that non-GAAP measures should not be considered in isolation or as substitutes for GAAP measures. The document also notes that forward-looking statements are subject to risks and uncertainties that could cause actual results to differ materially from expectations.
- US Foods reported strong financial results for Q4 and FY 2016, with adjusted EBITDA growth of 12.5% for the full year.
- Volume growth, margin expansion, and five successful acquisitions contributed to the positive results.
- The company made progress on key strategic initiatives such as new product launches, food cost management, and efficiency improvements.
- Management reiterated mid-term guidance of 7-10% annual adjusted EBITDA growth and remains optimistic given favorable industry trends.
SemGroup and Rose Rock 3Q 2015 Earnings PresentationSemGroup
- The company reported third quarter 2015 results and reduced its full year Adjusted EBITDA guidance due to lower expected volumes and foreign currency impacts.
- It increased dividends for the third quarter of 2015 compared to the prior year but maintained full year dividend growth guidance.
- Financial flexibility was maintained with revolving credit available to fund capital projects and potential dropdown transactions from SemGas.
- The company will focus on strategic opportunities while targeting volume maintenance or growth in key asset areas during a low oil price environment.
- The document is an investor presentation that provides an overview of SemGroup Corporation and Rose Rock Midstream.
- It discusses SemGroup's crude oil and natural gas assets across North America and outlines strategic initiatives to focus on stable, fee-based operations and pursue organic and strategic growth opportunities.
- Capital expenditure guidance for 2015 is provided, with over 90% focused on growth projects in key plays like the Maurepas Pipeline and SemGas expansion in Northern Oklahoma.
US Foods Holding Corporation reported its Q2 fiscal 2017 results on August 9, 2017. The presentation included cautionary statements about forward-looking statements and non-GAAP financial measures. Forward-looking statements are subject to risks and uncertainties that could cause actual results to differ materially. Non-GAAP measures like Adjusted EBITDA, Adjusted Net Income, and Adjusted Diluted EPS exclude certain items to provide supplemental measures of operational performance, but have not been calculated in accordance with GAAP. Management uses these non-GAAP measures for evaluating historical and prospective performance, setting budgets, measuring profitability, and determining compensation.
The document provides cautionary statements regarding forward-looking statements and non-GAAP financial measures discussed in a presentation about US Foods. It outlines risks, uncertainties, and assumptions that could cause actual results to differ from forward-looking statements. These include risks related to inflation, competition, suppliers, debt, acquisitions, labor, regulations, technology, and other operational factors. The document also states that non-GAAP measures like EBITDA, adjusted EBITDA, and adjusted net income exclude certain items to focus on core operating performance and provide comparability between periods.
Similar to SemGroup Earnings Presentation First Quarter 2017 (16)
The E-Way Bill revolutionizes logistics by digitizing the documentation of goods transport, ensuring transparency, tax compliance, and streamlined processes. This mandatory, electronic system reduces delays, enhances accountability, and combats tax evasion, benefiting businesses and authorities alike. Embrace the E-Way Bill for efficient, reliable transportation operations.
Methanex is the world's largest producer and supplier of methanol. We create value through our leadership in the global production, marketing and delivery of methanol to customers. View our latest Investor Presentation for more details.
MUTUAL FUNDS (ICICI Prudential Mutual Fund) BY JAMES RODRIGUESWilliamRodrigues148
Mutual funds are investment vehicles that pool money from multiple investors to purchase a diversified portfolio of stocks, bonds, or other securities. They are managed by professional portfolio managers or investment companies who make investment decisions on behalf of the fund's investors.
Cleades Robinson, a respected leader in Philadelphia's police force, is known for his diplomatic and tactful approach, fostering a strong community rapport.
World economy charts case study presented by a Big 4
World economy charts case
World economy charts case study presented by a Big 4
World economy charts case study presented by a Big 4World economy charts case study presented by a Big 4
World economy charts case study presented by a Big 4
World economy charts case study presented by a Big 4World economy charts case study presented by a Big 4World economy charts case study presented by a Big 4World economy charts case study presented by a Big 4World economy charts case study presented by a Big 4World economy charts case study presented by a Big 4World economy charts case study presented by a Big 4World economy charts case study presented by a Big 4World economy charts case study presented by a Big 4World economy charts case study presented by a Big 4World economy charts case study presented by a Big 4World economy charts case study presented by a Big 4World economy charts case study presented by a Big 4World economy charts case study presented by a Big 4study presented by a Big 4
ZKsync airdrop of 3.6 billion ZK tokens is scheduled by ZKsync for next week.pdfSOFTTECHHUB
The world of blockchain and decentralized technologies is about to witness a groundbreaking event. ZKsync, the pioneering Ethereum Layer 2 network, has announced the highly anticipated airdrop of its native token, ZK. This move marks a significant milestone in the protocol's journey, empowering the community to take the reins and shape the future of this revolutionary ecosystem.
2. First Quarter 2017 Results
Non-GAAP Financial Measures
SemGroup’s non-GAAP measure, Adjusted EBITDA, is not a GAAP measure and is not intended to be used in lieu of GAAP presentation of net income (loss),
which is the most closely associated GAAP measure. Adjusted EBITDA represents earnings before interest, taxes, depreciation and amortization, adjusted for
selected items that SemGroup believes impact the comparability of financial results between reporting periods. In addition to non-cash items, we have selected
items for adjustment to EBITDA which management feels decrease the comparability of our results among periods. These items are identified as those which
are generally outside of the results of day to day operations of the business. These items are not considered non-recurring, infrequent or unusual, but do erode
comparability among periods in which they occur with periods in which they do not occur or occur to a greater or lesser degree. Historically, we have selected
items such as gains on the sale of NGL Energy Partners LP common units, costs related to our predecessor’s bankruptcy, significant business development
related costs, significant legal settlements, severance and other similar costs. Management believes these types of items can make comparability of the results
of day to day operations among periods difficult and have chosen to remove these items from our Adjusted EBITDA. We expect to adjust for similar types of
items in the future. Although we present selected items that we consider in evaluating our performance, you should be aware that the items presented do not
represent all items that affect comparability between the periods presented. Variations in our operating results are also caused by changes in volumes, prices,
mechanical interruptions and numerous other factors. We do not adjust for these types of variances.
This measure may be used periodically by management when discussing our financial results with investors and analysts and is presented as management
believes it provides additional information and metrics relative to the performance of our businesses. This non-GAAP financial measure has important limitations
as an analytical tool because it excludes some, but not all, items that affect the most directly comparable GAAP financial measures. You should not consider
non-GAAP measures in isolation or as substitutes for analysis of our results as reported under GAAP. Management compensates for the limitations of our non-
GAAP measures as analytical tools by reviewing the comparable GAAP measures, understanding the differences between the non-GAAP measure and the
most comparable GAAP measure and incorporating this knowledge into its decision-making processes. We believe that investors benefit from having access to
the same financial measures that our management uses in evaluating our operating results. Because all companies do not use identical calculations, our
presentations of non-GAAP measures may be different from similarly titled measures of other companies, thereby diminishing their utility.
SemGroup does not provide guidance for net income, the GAAP financial measure most directly comparable to the non-GAAP financial measure Adjusted
EBITDA, because Net Income includes items such as unrealized gains or losses on derivative activities or similar items which, because of their nature, cannot
be accurately forecasted. We do not expect that such amounts would be significant to Adjusted EBITDA as they are largely non-cash items.
2
3. First Quarter 2017 Results
Certain matters contained in this presentation include "forward-looking statements" within the meaning of Section 27A of the Securities Act of 1933, as amended,
and Section 21E of the Securities Exchange Act of 1934, as amended. We make these forward-looking statements in reliance on the safe harbor protections
provided under the Private Securities Litigation Reform Act of 1995.
All statements, other than statements of historical fact, included in this presentation including the prospects of our industry, our anticipated financial performance,
our anticipated annual dividend growth rate, management's plans and objectives for future operations, planned capital expenditures, business prospects, outcome
of regulatory proceedings, market conditions and other matters, may constitute forward-looking statements. Although we believe that the expectations reflected in
these forward-looking statements are reasonable, we cannot assure you that these expectations will prove to be correct. These forward-looking statements are
subject to certain known and unknown risks and uncertainties, as well as assumptions that could cause actual results to differ materially from those reflected in
these forward-looking statements. Factors that might cause actual results to differ include, but are not limited to, the failure to realize the anticipated benefits of the
transaction, consummated on September 30, 2016, pursuant to which we acquired all of the outstanding common units of our subsidiary, Rose Rock Midstream,
L.P., not already owned by us; our ability to generate sufficient cash flow from operations to enable us to pay our debt obligations and our current and expected
dividends or to fund our other liquidity needs; any sustained reduction in demand for, or supply of, the petroleum products we gather, transport, process, market and
store; the effect of our debt level on our future financial and operating flexibility, including our ability to obtain additional capital on terms that are favorable to us; our
ability to access the debt and equity markets, which will depend on general market conditions and the credit ratings for our debt obligations and equity; the loss of,
or a material nonpayment or nonperformance by, any of our key customers; the amount of cash distributions, capital requirements and performance of our
investments and joint ventures; the amount of collateral required to be posted from time to time in our commodity purchase, sale or derivative transactions; the
impact of operational and developmental hazards and unforeseen interruptions; our ability to obtain new sources of supply of petroleum products; competition from
other midstream energy companies; our ability to comply with the covenants contained in our credit agreement and the indentures governing our senior notes,
including requirements under our credit agreement to maintain certain financial ratios; our ability to renew or replace expiring storage, transportation and related
contracts; the overall forward markets for crude oil, natural gas and natural gas liquids; the possibility that the construction or acquisition of new assets may not
result in the corresponding anticipated revenue increases; changes in currency exchange rates; weather and other natural phenomena, including climate conditions;
a cyber attack involving our information systems and related infrastructure, or that of our business associates; the risks and uncertainties of doing business outside
of the U.S., including political and economic instability and changes in local governmental laws, regulations and policies; costs of, or changes in, laws and
regulations and our failure to comply with new or existing laws or regulations, particularly with regard to taxes, safety and protection of the environment; the
possibility that our hedging activities may result in losses or may have a negative impact on our financial results; general economic, market and business conditions;
as well as other risk factors discussed from time to time in our each of our documents and reports filed with the SEC.
Readers are cautioned not to place undue reliance on any forward-looking statements contained in this presentation which reflect management's opinions only as of
the date hereof. Except as required by law, we undertake no obligation to revise or publicly release the results of any revision to any forward-looking statements.
We use our Investor Relations website and social media outlets as channels of distribution of material company information. Such information is routinely posted
and accessible on our Investor Relations website at ir.semgroupcorp.com.
We are present on Twitter and LinkedIn, follow us at the links below:
SemGroup Twitter and LinkedIn
Forward-Looking Information
3
4. First Quarter 2017 Results
SemGroup Corporation
(in millions, unaudited) 1Q 2017 4Q 2016 2017 Guidance
Adjusted EBITDA(1)
$60.7 $66.2 $270 - $310 million
First Quarter 2017 Results
4
1) Non-GAAP Financial Data Reconciliations are included in the Appendix to this presentation
First Quarter Adjusted EBITDA Results
Ñ SemCAMS - up over 70% due to absence of 4Q 2016 producer concession fee & higher volumes
Ñ Crude Facilities - down nearly $5 million due to absence of 4Q 2016 take or pay adjustment
Ñ Crude Supply & Logistics - down due to timing of inventory costing, expected to turn around during
2Q 2017
Full Year Highlights
Ñ Reaffirm 2017 Adjusted EBITDA guidance of $270 to $310 million
Ñ Based on current outlook, expected annualized 4Q 2017 Adj EBITDA run rate of $325 to $340 million
Ñ Targeting 8% dividend CAGR through 2020 and expect to recommend a 6% to 10% annualized
dividend increase in December 2017
Ñ Maurepas Pipeline construction completion expected late 2Q 2017
Ñ Announced SemGas Canton Pipeline project to capture STACK play volumes
5. First Quarter 2017 Results
Key Committed Projects
Crude Projects
• Maurepas Pipeline ~ completion late 2Q 2017: $180 million
• Cushing 20" Pipeline ~ completion 4Q 2017: $35 million
• STACK Crude Pipeline ~ completion 4Q 2017: $30 million(1)
Natural Gas Projects
• Wapiti Sour Gas Plant ~ completion mid-2019: $80 million
• KA Plant projects: $25 million
• N. Oklahoma gathering projects: $20 million
• SemGas STACK Canton Pipeline ~ completion 4Q 2017: $60 million
Maurepas Pipeline
Crude
Natural Gas
Other Growth Projects
Maintenance
$180
36%
$65
13%
$185
37%
$10
2%
$60
12%
2017 Capital Expenditure Guidance
5 1) Reflects SemGroup's 50% of capital contributions to the joint venture
$500 million to Strategic Crude and Natural Gas Projects
6. First Quarter 2017 Results
SemGas STACK Pipeline Project
Canton Pipeline
Ñ 24-inch diameter natural gas pipeline, ~50 miles long
Ñ Originates from SemGroup’s Rose Valley gas
processing facility in Woods County and extends to
north central Blaine County
Ñ Expected to be in service by year-end 2017
Ñ Backed by a long-term, firm commitment from an
investment-grade counterparty
Ñ Initial capacity of 200 mmcf/d, and could be expanded
up to 400 mmcf/d by adding compression, to serve
other producers in the area
6
Provides significant operational synergies with our existing assets
7. First Quarter 2017 Results
Key Projects Update
Ñ Maurepas Pipeline
• All field welds expected to be complete in May
• On budget and expected construction completion late 2Q 2017
Ñ STACK Crude Pipeline
• Acquired over 90% of right of way
• Begun tank construction at Omega and Ruby stations
• Pipe to be delivered in June
• Expected completion 4Q 2017
Ñ Wapiti Gas Plant
• Long-lead time equipment ordered
• Site work progressing
• Expected completion mid-2019
7
8. First Quarter 2017 Results
1Q 2017 Results
Segment Adjusted EBITDA
(in millions, unaudited) 1Q 2017 4Q 2016
Crude - Transportation $ 25.7 $ 26.1
Crude - Facilities 9.0 13.9
Crude - Supply and Logistics (3.5) (1.9)
SemGas 16.1 16.9
SemCAMS 12.5 7.3
SemLogistics 3.9 3.3
SemMaterials Mexico 2.0 3.7
Corporate and Other (5.0) (3.1)
SemGroup $ 60.7 $ 66.2
SemGroup Corporation
As Reported (in millions, excluding EPS, unaudited) 1Q 2017 4Q 2016
Net income (loss) attributable to SemGroup $ (10.3) $ 12.0
Net income (loss) per share - diluted $ (0.16) $ 0.18
EBITDA(1)
$ 28.3 $ 61.4
Selected Non-Cash Items and Other Items Impacting Comparability(1)
$ 32.4 $ 4.8
Adjusted EBITDA(1)
$ 60.7 $ 66.2
Dividend per Share $ 0.45 $ 0.45
8
1) Non-GAAP Financial Data Reconciliations are included in the Appendix to this presentation
9. First Quarter 2017 Results
SemGroup Corporation
(in millions, unaudited) March 31, 2017
$1 billion revolver - 2021 $90.0
5.625% Senior unsecured notes - 2022 400.0
5.625% Senior unsecured notes - 2023 350.0
6.375% Senior unsecured notes - 2025 325.0
Total debt $1,165.0
Compliance leverage ratio(1)
3.6x
Target leverage <4.5x
Liquidity:
Cash and cash equivalents(2)
$56.6
Revolver availability(3)
874.6
Total liquidity $931.2
Leverage and Liquidity
9
1) Calculated per revolving credit agreement definitions, which includes material project adjustments; maximum total leverage
covenant of 5.5x
2) Cash excludes SemMaterials Mexico
3) Revolver availability is reduced for outstanding letters of credit
Ñ Refinanced 2021 Notes to achieve
lower borrowing costs and extended
maturity
Ñ Successfully amended the revolving
credit facility to lower the pricing grid
25 bps
Ñ Targeting compliance leverage ratio of
4.5x, based on current outlook expect
4Q 2017 compliance leverage to be
4.5x to 4.75x, assuming no ATM
issuance
10. First Quarter 2017 Results
Delivering Long-Term Value
10
Financial
Discipline & Strong
Balance Sheet
High Return
Growth Projects &
Strategic
Acquisitions
Focus on Portfolio
Balance & Secure
Cash Flows
Targeting 8%
Dividend CAGR
through 2020
12. First Quarter 2017 Results
Guidance Assumptions
Average Commodity Price Assumptions(2)
• Crude Oil: $54/barrel
• Natural Gas: $3.40/mmbtu
• Natural Gas Liquids: $0.80/gallon
Foreign Exchange Rate Assumptions
• Canadian Dollar (CAD/USD): $0.74
• British Pound (GBP/USD): $1.25
• Mexican Peso (MXN/USD): $0.05
Cash Taxes
• Approximately $5 million, related to foreign subs
Operational Assumptions
Crude
• Average Cushing storage rate: $0.33/barrel/month
• Maurepas Pipeline: expected completion late 2Q 2017
• Transportation volumes(3)
: 5-10% increase
• White Cliffs Pipeline volumes: 100-110k bpd
• Glass Mountain Pipeline volumes: 75-80k bpd
SemGas
• N. Oklahoma processing volumes: 280-300 mmcf/d
SemCAMS
• Processing volumes: 375-400 mmcf/d
• K3 plant turnaround scheduled 2Q 2017
Adjusted EBITDA $270 million - $310 million(1)
(in millions)
$400
$300
$200
$100
2014 2015 2016 2017E
$287
$305
$283
$270 - $310
SemGroup 2017 Guidance
12
1) Non-GAAP Reconciliations for historical periods are included in the Appendix to this presentation
2) Average commodity prices as of January 11, 2017
3) Transportation volumes excludes Maurepas Pipeline and JV assets (White Cliffs Pipeline and Glass Mountain Pipeline)
13. First Quarter 2017 Results
Over 70% of SemGroup's revenue is derived from
investment grade counterparties
Over 90% of total LTM gross margin from
fixed fee based cash flows
(1) LTM December 31, 2016
(2) Counterparty ratings LTM December 31, 2016; excludes SemLogistics and SemMaterials Mexico
Take or Pay Fixed Fee POP/Marketing
600
500
400
300
200
100
0
($inmillions)
2014 2015 2016 2017 Investment Grade
Non-Investment Grade
72%
28%
51%
38%
11%11%
59%
30%
64%
13%
23%
SemGroup derives a significant portion of its margin from fixed fee contracted arrangements with
strong counterparties; SemGroup is well-positioned to drive future growth
Company Strengths
13
1) LTM March 31, 2017
2) Counterparty ratings LTM March 31, 2017; excludes SemLogistics and SemMaterials Mexico13
Counterparty Strength(2)
Stable Cash Flows(1)
51%
40%
9%
15. First Quarter 2017 Results
SemCAMS Average Throughput Volume
Natural Gas Key Performance Metrics
K3 Plant KA Plant Capacity
600
500
400
300
200
100
0
(mmcf/d)
1Q 2Q 3Q 4Q 1Q
270.4
157.0
253.5 253.7 260.7
114.3
384.7
147.1
304.1 135.0
388.5
143.1
396.8
146.9
407.6
Capacity Processing Volumes
600
500
400
300
200
100
0
(mmcf/d)
1Q 2Q 3Q 4Q 1Q
325.9 290.6 284.4 284.2 273.6
(1)
15 1) Lower volumes related to an unplanned shutdown at our K3 plant during June 2016
SemGas Northern OK Avg Processed Volume
2016 2017
2016 2017
16. First Quarter 2017 Results
Consolidated Balance Sheets
(in thousands, unaudited, condensed) March 31,
2017
December 31,
2016
ASSETS
Current assets $ 672,770 $ 635,874
Property, plant and equipment, net 1,834,400 1,762,072
Goodwill and other intangible assets 182,994 185,208
Equity method investments 432,389 434,289
Other noncurrent assets, net 54,173 57,529
Total assets $ 3,176,726 $ 3,074,972
LIABILITIES AND OWNERS' EQUITY
Current liabilities:
Current portion of long-term debt $ 27 $ 26
Other current liabilities 535,795 488,329
Total current liabilities 535,822 488,355
Long-term debt, excluding current portion 1,140,637 1,050,918
Other noncurrent liabilities 85,922 89,734
Total liabilities 1,762,381 1,629,007
Total owners' equity 1,414,345 1,445,965
Total liabilities and owners' equity $ 3,176,726 $ 3,074,972
16
17. First Quarter 2017 Results
Consolidated Statements of Operations and Comprehensive Income (Loss)
(in thousands, except per share amounts, unaudited, condensed) Three Months Ended
March 31, December 31,
2017 2016 2016
Revenues $ 456,100 $ 314,851 $ 402,172
Expenses:
Costs of products sold, exclusive of depreciation and amortization shown below 348,998 196,947 281,139
Operating 52,083 50,192 54,564
General and administrative 21,644 21,060 21,490
Depreciation and amortization 24,599 24,051 24,776
Loss on disposal or impairment, net 2,410 13,307 38
Total expenses 449,734 305,557 382,007
Earnings from equity method investments 17,091 23,071 17,763
Loss on issuance of common units by equity method investee — (41) —
Operating income 23,457 32,324 37,928
Other expenses, net 33,639 58,622 9,809
Income (loss) from continuing operations before income taxes (10,182) (26,298) 28,119
Income tax expense (benefit) 95 (21,407) 16,119
Income (loss) from continuing operations (10,277) (4,891) 12,000
Loss from discontinued operations, net of income taxes — (2) —
Net income (loss) (10,277) (4,893) 12,000
Less: net income attributable to noncontrolling interests — 9,020 —
Net income (loss) attributable to SemGroup Corporation (10,277) (13,913) 12,000
Other comprehensive income (loss), net of income taxes 6,033 (4,109) (10,783)
Comprehensive income (loss) attributable to SemGroup Corporation $ (4,244) $ (18,022) $ 1,217
Net income (loss) per common share:
Basic $ (0.16) $ (0.32) $ 0.18
Diluted $ (0.16) $ (0.32) $ 0.18
Weighted average shares (thousands):
Basic 65,692 43,870 65,754
Diluted 65,692 43,870 66,326
17
18. First Quarter 2017 Results
2016 Quarterly Financial Data
Note: Prior quarter amounts above have been restated from the amounts originally reported to correct for an immaterial error identified by management in the fourth
quarter related to an under capitalization of interest on certain capital projects. Previously reported interest expense, included in "other expense, net" above, has
been decreased by $1.4 million, $0.9 million and $2.5 million for the quarters ended March 31, June 30 and September 30, 2016, respectively, with a corresponding
increase to net income. Earnings per basic share was increased by $0.03, $0.02 and $0.05 per share for the quarters ended March 31, June 30 and September 30,
2016, respectively. Capitalized interest recorded for the fourth quarter of 2016 includes an immaterial out of period adjustment of $6.3 million related to under
capitalization of interest in the prior year.
(in thousands, except per share data, unaudited)
First
Quarter
Second
Quarter
Third
Quarter
Fourth
Quarter Total
Total revenues $ 314,851 $ 287,377 $ 327,764 $ 402,172 $ 1,332,164
Loss on disposal or impairment, net 13,307 1,685 1,018 38 16,048
Other operating costs and expenses 292,250 277,379 316,644 381,969 1,268,242
Total expenses 305,557 279,064 317,662 382,007 1,284,290
Earnings from equity method investments 23,071 17,078 15,845 17,763 73,757
Loss on issuance of common units by equity method investee (41) — — — (41)
Operating income 32,324 25,391 25,947 37,928 121,590
Other expenses, net 58,622 9,944 18,684 9,809 97,059
Income (loss) from continuing operations before income taxes (26,298) 15,447 7,263 28,119 24,531
Income tax expense (benefit) (21,407) 4,658 11,898 16,119 11,268
Income (loss) from continuing operations (4,891) 10,789 (4,635) 12,000 13,263
Income (loss) from discontinued operations, net of income taxes (2) (2) 3 — (1)
Net income (loss) (4,893) 10,787 (4,632) 12,000 13,262
Less: net income attributable to noncontrolling interests 9,020 1,922 225 — 11,167
Net income (loss) attributable to SemGroup $ (13,913) $ 8,865 $ (4,857) $ 12,000 $ 2,095
Earnings (loss) per share—basic $ (0.32) $ 0.20 $ (0.09) $ 0.18 $ 0.04
Earnings (loss) per share—diluted $ (0.32) $ 0.19 $ (0.09) $ 0.18 $ 0.04
18
19. First Quarter 2017 Results
Non-GAAP Adjusted EBITDA Calculation
(in thousands, unaudited) Three Months Ended
March 31, December 31,
Reconciliation of net income to Adjusted EBITDA: 2017 2016 2016
Net income (loss) $ (10,277) $ (4,893) $ 12,000
Add: Interest expense(1) 13,867 17,577 8,545
Add: Income tax expense (benefit) 95 (21,407) 16,119
Add: Depreciation and amortization expense 24,599 24,051 24,776
EBITDA 28,284 15,328 61,440
Selected Non-Cash Items and
Other Items Impacting Comparability 32,383 62,348 4,765
Adjusted EBITDA $ 60,667 $ 77,676 $ 66,205
Selected Non-Cash Items and
Other Items Impacting Comparability
Loss on disposal or impairment, net $ 2,410 $ 13,307 $ 38
Loss from discontinued operations, net of income taxes — 2 —
Foreign currency transaction loss — 1,469 1,088
Remove NGL equity losses (earnings) including loss (gain) on issuance
of common units (3) (2,191) 6
Remove loss on sale or impairment of NGL units — 39,764 —
NGL cash distribution — 4,873 —
Employee severance and relocation expense 558 259 499
Unrealized loss (gain) on derivative activities 27 (4,548) (5,107)
Depreciation and amortization included within equity earnings 6,712 6,539 5,071
Non-cash equity compensation 2,757 2,874 3,170
Loss on early extinguishment of debt $ 19,922 $ — $ —
Selected Non-Cash items and
Other Items Impacting Comparability $ 32,383 $ 62,348 $ 4,765
19
1) Capitalized interest recorded for 4Q 2016 includes an immaterial out of period adjustment of $6.3 million related to the prior year
Note: 1Q 2017 cash expense: ~ $18 million interest, ~ $8 million maintenance capex, ~ $1 million income tax
20. First Quarter 2017 Results
Non-GAAP Financial Data Reconciliations
(in thousands, unaudited) Three Months Ended
March 31, December 31,
2017 2016 2016
Net income $ 12,242 $ 19,295 $ 15,810
Add: Interest expense (income) (1,305) 264 (1,098)
Add: Depreciation and amortization expense 5,927 5,860 6,140
EBITDA 16,864 25,419 20,852
Selected Non-Cash Items and
Other Items Impacting Comparability 8,788 6,606 5,206
Adjusted EBITDA $ 25,652 $ 32,025 $ 26,058
Selected Non-Cash Items and Other Items Impacting Comparability
Loss on disposal or impairment, net $ 1,961 $ 67 $ 38
Employee severance and relocation expense 115 — 97
Depreciation and amortization included within
equity earnings 6,712 6,539 5,071
Selected Non-Cash items and
Other Items Impacting Comparability $ 8,788 $ 6,606 $ 5,206
Crude - Transportation Segment
20
21. First Quarter 2017 Results
Non-GAAP Financial Data Reconciliations
(in thousands, unaudited) Three Months Ended
March 31, December 31,
2017 2016 2016
Net income $ 6,884 $ 7,705 $ 11,756
Add: Interest expense 134 — 128
Add: Depreciation and amortization expense 1,944 1,882 1,996
EBITDA 8,962 9,587 13,880
Selected Non-Cash Items and
Other Items Impacting Comparability 54 — —
Adjusted EBITDA $ 9,016 $ 9,587 $ 13,880
Selected Non-Cash Items and Other Items Impacting Comparability
Employee severance expense $ 54 $ — $ —
Selected Non-Cash items and
Other Items Impacting Comparability $ 54 $ — $ —
Crude - Facilities Segment
21
22. First Quarter 2017 Results
Non-GAAP Financial Data Reconciliations
(in thousands, unaudited) Three Months Ended
March 31, December 31,
2017 2016 2016
Net income (loss) $ (3,961) $ 13,461 $ 2,853
Add: Interest expense 257 140 302
Add: Depreciation and amortization expense 62 40 59
EBITDA (3,642) 13,641 3,214
Selected Non-Cash Items and
Other Items Impacting Comparability 170 (4,321) (5,107)
Adjusted EBITDA $ (3,472) $ 9,320 $ (1,893)
Selected Non-Cash Items and Other Items Impacting Comparability
Loss on disposal or impairment, net $ — $ 227 $ —
Employee severance expense 143 — —
Unrealized loss (gain) on derivative activities 27 (4,548) (5,107)
Selected Non-Cash items and
Other Items Impacting Comparability $ 170 $ (4,321) $ (5,107)
Crude - Supply and Logistics Segment
22
23. First Quarter 2017 Results
Non-GAAP Financial Data Reconciliations
(in thousands, unaudited) Three Months Ended
March 31, December 31,
2017 2016 2016
Net income (loss) $ 3,673 $ (13,474) $ 4,385
Add: Interest expense 3,149 3,555 3,283
Add: Depreciation and amortization expense 8,927 8,927 8,966
EBITDA 15,749 (992) 16,634
Selected Non-Cash Items and
Other Items Impacting Comparability 318 13,391 266
Adjusted EBITDA $ 16,067 $ 12,399 $ 16,900
Selected Non-Cash Items and Other Items Impacting Comparability
Loss on disposal or impairment, net $ 21 $ 13,052 $ —
Non-cash equity compensation 297 339 266
Selected Non-Cash items and
Other Items Impacting Comparability $ 318 $ 13,391 $ 266
SemGas Segment
23
24. First Quarter 2017 Results
Non-GAAP Financial Data Reconciliations
(in thousands, unaudited) Three Months Ended
March 31, December 31,
2017 2016 2016
Net income $ 3,506 $ 3,276 $ 931
Add: Interest expense 2,162 1,706 937
Add: Income tax expense 1,424 965 678
Add: Depreciation and amortization expense 4,496 3,951 4,383
EBITDA 11,588 9,898 6,929
Selected Non-Cash Items and
Other Items Impacting Comparability 932 383 369
Adjusted EBITDA $ 12,520 $ 10,281 $ 7,298
Selected Non-Cash Items and Other Items Impacting Comparability
Loss on disposal or impairment, net $ 445 $ — $ —
Foreign currency transaction loss 8 6 —
Non-cash equity compensation 479 377 369
Selected Non-Cash items and
Other Items Impacting Comparability $ 932 $ 383 $ 369
SemCAMS Segment
24
25. First Quarter 2017 Results
Non-GAAP Financial Data Reconciliations
(in thousands, unaudited) Three Months Ended
March 31, December 31,
2017 2016 2016
Net income (loss) $ 1,285 $ (246) $ (155)
Add: Interest expense 522 376 407
Add: Income tax expense 381 59 91
Add: Depreciation and amortization expense 1,815 1,960 1,853
EBITDA 4,003 2,149 2,196
Selected Non-Cash Items and
Other Items Impacting Comparability (64) 687 1,148
Adjusted EBITDA $ 3,939 $ 2,836 $ 3,344
Selected Non-Cash Items and Other Items Impacting Comparability
Foreign currency transaction (gain) loss $ (259) $ 510 $ 1,006
Non-cash equity compensation 195 177 142
Selected Non-Cash items and
Other Items Impacting Comparability $ (64) $ 687 $ 1,148
SemLogistics Segment
25
26. First Quarter 2017 Results
Non-GAAP Financial Data Reconciliations
(in thousands, unaudited) Three Months Ended
March 31, December 31,
2017 2016 2016
Net income $ 406 $ 696 $ 2,068
Add: Income tax expense 217 607 534
Add: Depreciation and amortization expense 937 941 930
EBITDA 1,560 2,244 3,532
Selected Non-Cash Items and
Other Items Impacting Comparability 391 370 199
Adjusted EBITDA $ 1,951 $ 2,614 $ 3,731
Selected Non-Cash Items and Other Items Impacting Comparability
Gain on disposal of long-lived assets, net $ (17) $ (39) $ —
Foreign currency transaction loss 252 256 59
Non-cash equity compensation 156 153 140
Selected Non-Cash items and
Other Items Impacting Comparability $ 391 $ 370 $ 199
SemMaterials México Segment
26
27. First Quarter 2017 Results
Non-GAAP Financial Data Reconciliations
(in thousands, unaudited) Three Months Ended
March 31, December 31,
2017 2016 2016
Net loss $ (34,312) $ (35,606) $ (25,648)
Add: Interest expense 8,948 11,536 4,586
Add: Income tax expense (benefit) (1,927) (23,038) 14,816
Add: Depreciation and amortization expense 491 490 449
EBITDA (26,800) (46,618) (5,797)
Selected Non-Cash Items and
Other Items Impacting Comparability 21,794 45,232 2,684
Adjusted EBITDA $ (5,006) $ (1,386) $ (3,113)
Selected Non-Cash Items and Other Items Impacting Comparability
Loss from discontinued operations, net of income taxes $ — $ 2 $ —
Foreign currency transaction (gain) loss (1) 697 23
Remove NGL equity losses (earnings) including gain (loss) on issuance
of common units (3) (2,191) 6
Remove loss on impairment or sale of NGL units — 39,764 —
NGL cash distribution — 4,873 —
Employee severance and relocation expense 246 259 402
Non-cash equity compensation 1,630 1,828 2,253
Loss on early extinguishment of debt 19,922 — —
Selected Non-Cash items and
Other Items Impacting Comparability $ 21,794 $ 45,232 $ 2,684
Corporate & Other Segment
27
28. First Quarter 2017 Results
(in thousands, unaudited) Three Months Ended
June 30, 2016
Crude -
Transportation
Crude -
Facilities
Crude -
Supply and
Logistics SemCAMS SemLogistics SemMexico SemGas
Corporate
and Other Consolidated
Net income (loss) $ 11,794 $ 7,450 $ 5,370 $ 2,325 $ (1,447) $ 1,187 $ (325) $ (15,567) $ 10,787
Add: Interest expense 193 — 182 1,931 353 — 3,431 11,921 18,011
Add: Income tax expense (benefit) — — — 451 (273) 194 — 4,286 4,658
Add: Depreciation and amortization expense 6,174 1,921 40 4,294 1,983 949 9,198 496 25,055
EBITDA 18,161 9,371 5,592 9,001 616 2,330 12,304 1,136 58,511
Selected Non-Cash Items and
Other Items Impacting Comparability 8,954 4 4,477 381 1,562 244 256 (6,757) 9,121
Adjusted EBITDA $ 27,115 $ 9,375 $ 10,069 $ 9,382 $ 2,178 $ 2,574 $ 12,560 $ (5,621) $ 67,632
Selected Non-Cash Items and Other Items Impacting Comparability
Loss (gain) on disposal of long-lived assets, net $ 1,714 $ — $ — $ — $ — $ (28) $ (1) $ — $ 1,685
Loss from discontinued operations, net of income taxes — — — — — — — 2 2
Foreign currency transaction (gain) loss — — — (1) 1,391 153 — — 1,543
Remove NGL equity earnings including gain on issuance of common units — — — — — — — (9,120) (9,120)
Employee severance expense 102 4 — — — — 13 717 836
Unrealized loss on derivative activities — — 4,477 — — — — — 4,477
Depreciation and amortization included within
equity earnings 7,138 — — — — — — — 7,138
Non-cash equity compensation — — — 382 171 119 244 1,644 2,560
Selected Non-Cash Items and
Other Items Impacting Comparability $ 8,954 $ 4 $ 4,477 $ 381 $ 1,562 $ 244 $ 256 $ (6,757) $ 9,121
Reconciliation of Net Income to Adjusted EBITDA
28
29. First Quarter 2017 Results
(in thousands, unaudited) Three Months Ended
September 30, 2016
Crude -
Transportation
Crude -
Facilities
Crude -
Supply and
Logistics SemCAMS SemLogistics SemMexico SemGas
Corporate
and Other Consolidated
Net income (loss) $ 13,052 $ 7,697 $ (3,248) $ 5,080 $ 948 $ 1,491 $ 3,750 $ (33,402) $ (4,632)
Add: Interest expense 154 — 186 2,175 456 43 3,367 12,136 18,517
Add: Income tax expense (benefit) — — — 1,573 (601) 349 — 10,577 11,898
Add: Depreciation and amortization expense 6,309 1,982 46 4,239 1,880 932 9,079 455 24,922
EBITDA 19,515 9,679 (3,016) 13,067 2,683 2,815 16,196 (10,234) 50,705
Selected Non-Cash Items and
Other Items Impacting Comparability 8,334 2 6,167 124 686 72 125 5,078 20,588
Adjusted EBITDA $ 27,849 $ 9,681 $ 3,151 $ 13,191 $ 3,369 $ 2,887 $ 16,321 $ (5,156) $ 71,293
Selected Non-Cash Items and Other Items Impacting Comparability
Loss (gain) on disposal of long-lived assets, net $ 1,018 $ — $ — $ — $ — $ — $ — $ — $ 1,018
Foreign currency transaction (gain) loss — — — — 647 30 — (18) 659
Remove NGL equity losses including gain on issuance of common units — — — — — — — 38 38
Employee severance expense 33 2 — 1 — — — 498 534
Unrealized loss on derivative activities — — 6,167 — — — — — 6,167
M&A transaction related costs 3,269 3,269
Depreciation and amortization included within
equity earnings 7,283 — — — — — — — 7,283
Non-cash equity compensation — — — 123 39 42 125 1,291 1,620
Selected Non-Cash Items and
Other Items Impacting Comparability $ 8,334 $ 2 $ 6,167 $ 124 $ 686 $ 72 $ 125 $ 5,078 $ 20,588
Reconciliation of Net Income to Adjusted EBITDA
29
30. First Quarter 2017 Results
(in thousands, unaudited) Year Ended
December 31, 2016
Crude -
Transportation
Crude -
Facilities
Crude -
Supply and
Logistics SemCAMS SemLogistics SemMexico SemGas
Corporate
and Other Consolidated
Net income (loss) $ (59,951) $ 34,608 $ 18,436 $ 11,612 $ (900) $ 5,442 $ (5,564) $ 9,579 $ 13,262
Add: Interest expense (487) 128 810 6,749 1,592 43 13,636 40,179 62,650
Add: Income tax expense (benefit) — — — 3,667 (724) 1,684 — 6,641 11,268
Add: Depreciation and amortization expense 24,483 7,781 185 16,867 7,676 3,752 36,170 1,890 98,804
EBITDA (35,955) 42,517 19,431 38,895 7,644 10,921 44,242 58,289 185,984
Selected Non-Cash Items and
Other Items Impacting Comparability 29,100 6 1,216 1,257 4,083 885 14,038 46,226 96,811
Adjusted EBITDA $ (6,855) $ 42,523 $ 20,647 $ 40,152 $ 11,727 $ 11,806 $ 58,280 $ 104,515 $ 282,795
Selected Non-Cash Items and Other Items Impacting Comparability
Loss (gain) on disposal of long-lived assets, net $ 2,837 $ — $ 227 $ — $ — $ (67) $ 13,051 $ — $ 16,048
Loss from discontinued operations, net of income taxes — — — — — — — 1 1
Foreign currency transaction loss — — — 5 3,554 498 — 702 4,759
Remove NGL equity earnings including gain on issuance of common units — — — — — — — (2,147) (2,147)
Remove loss on sale of NGL units — — — — — — — 30,644 30,644
NGL cash distribution — — — — — — — 4,873 4,873
Employee severance expense 232 6 — 1 — — 13 1,876 2,128
Unrealized loss on derivative activities — — 989 — — — — — 989
M&A transaction related costs — — — — — — — 3,269 3,269
Depreciation and amortization included within
equity earnings 26,031 — — — — — — — 26,031
Non-cash equity compensation — — — 1,251 529 454 974 7,008 10,216
Selected Non-Cash Items and
Other Items Impacting Comparability $ 29,100 $ 6 $ 1,216 $ 1,257 $ 4,083 $ 885 $ 14,038 $ 46,226 $ 96,811
Reconciliation of Net Income to Adjusted EBITDA
30
31. First Quarter 2017 Results
Reconciliation of Net Income to Adjusted EBITDA
(in thousands, unaudited) Year Ended
December 31, 2015
Crude -
Transportation
Crude -
Facilities
Crude -
Supply and
Logistics SemCAMS SemLogistics SemMexico SemGas
Corporate
and Other Consolidated
Net income (loss) $ 44,771 $ 27,928 $ 27,567 $ 7,879 $ (1,624) $ 8,725 $ 16,704 $ (89,138) $ 42,812
Add: Interest expense 778 — 462 10,742 1,746 46 13,162 42,739 69,675
Add: Income tax expense (benefit) — — — 4,847 (2,195) 2,611 — 28,267 33,530
Add: Depreciation and amortization expense 35,500 5,829 159 12,940 8,543 4,076 31,803 2,032 100,882
EBITDA 81,049 33,757 28,188 36,408 6,470 15,458 61,669 (16,100) 246,899
Selected Non-Cash Items and
Other Items Impacting Comparability 35,600 — 4,487 773 1,399 1,193 2,777 12,154 58,383
Adjusted EBITDA $ 116,649 $ 33,757 $ 32,675 $ 37,181 $ 7,869 $ 16,651 $ 64,446 $ (3,946) $ 305,282
Selected Non-Cash Items and Other Items Impacting Comparability
Loss (gain) on disposal of long-lived assets, net $ 9,621 $ — $ (3) $ (917) $ — $ 85 $ 1,832 $ 854 $ 11,472
Loss from discontinued operations, net of income taxes — — — — — — — 4 4
Foreign currency transaction (gain) loss — — — 103 799 605 — (2,574) (1,067)
Remove NGL equity earnings including gain on issuance of common units — — — — — — — (11,416) (11,416)
Remove gain on sale of NGL units — — — — — — — (14,517) (14,517)
NGL cash distribution — — — — — — — 19,074 19,074
M&A transaction related costs — — — — — — — 10,000 10,000
Employee severance and relocation expense 75 — — — — — — 15 90
Unrealized loss on derivative activities — — 1,900 — — — — 114 2,014
Depreciation and amortization included within
equity earnings 25,307 — — — — — — — 25,307
Inventory valuation adjustment including equity method investees 597 — 2,590 — — — — — 3,187
Bankruptcy related expenses — — — — — — — 224 224
Legal settlement expense — — — — — — — 3,394 3,394
Non-cash equity compensation — — — 1,587 600 503 945 6,982 10,617
Selected Non-Cash Items and
Other Items Impacting Comparability $ 35,600 $ — $ 4,487 $ 773 $ 1,399 $ 1,193 $ 2,777 $ 12,154 $ 58,383
31
32. First Quarter 2017 Results
(in thousands, unaudited) Year Ended
December 31, 2014
Crude -
Transportation
Crude -
Facilities
Crude -
Supply and
Logistics SemCAMS SemLogistics SemMexico SemGas
Corporate
and Other Consolidated
Net income (loss) $ 31,301 $ 26,921 $ 24,610 $ 14,318 $ (10,072) $ 5,900 $ 6,792 $ (47,713) $ 52,057
Add: Interest expense (income) 11,727 — 502 13,558 1,528 166 8,570 12,993 49,044
Add: Income tax expense (benefit) — — — 3,135 (2,231) 4,053 — 41,556 46,513
Add: Depreciation and amortization expense 33,679 5,365 549 14,295 10,005 6,031 26,353 2,120 98,397
EBITDA 76,707 32,286 25,661 45,306 (770) 16,150 41,715 8,956 246,011
Selected Non-Cash Items and
Other Items Impacting Comparability 21,582 (34) 4,004 590 (1,083) 621 21,053 (5,303) 41,430
Adjusted EBITDA $ 98,289 $ 32,252 $ 29,665 $ 45,896 $ (1,853) $ 16,771 $ 62,768 $ 3,653 $ 287,441
Selected Non-Cash Items and Other Items Impacting Comparability
Loss (gain) on disposal of long-lived assets, net $ 467 $ (34) $ (42) $ (950) $ (2,490) $ (53) $ 20,092 $ 15,602 $ 32,592
Loss (income) from discontinued operations, net of income taxes — — — — (1) — — 2 1
Foreign currency transaction (gain) loss — — — 42 821 279 — (1,228) (86)
Remove NGL equity earnings including gain on issuance of common units — — — — — — — (31,363) (31,363)
Remove gain on sale of NGL units — — — — — — — (34,211) (34,211)
NGL cash distribution — — — — — — — 23,404 23,404
Employee severance expense 9 — — 150 — — 41 20 220
Unrealized loss (gain) on derivative activities — — (1,621) — — — — (113) (1,734)
Change in fair value of warrants — — — — — — — 13,423 13,423
Depreciation and amortization included within
equity earnings 18,992 — — — — — — — 18,992
Inventory valuation adjustment including equity method investees 2,114 — 5,667 — — — — — 7,781
Recovery of receivables written off at emergence — — — (664) — — — — (664)
Bankruptcy related expenses — — — — — — 150 1,160 1,310
Charitable contributions — — — — — — — 3,379 3,379
Non-cash equity compensation — — — 2,012 587 395 770 4,622 8,386
Selected Non-Cash Items and
Other Items Impacting Comparability $ 21,582 $ (34) $ 4,004 $ 590 $ (1,083) $ 621 $ 21,053 $ (5,303) $ 41,430
Reconciliation of Net Income to Adjusted EBITDA
32