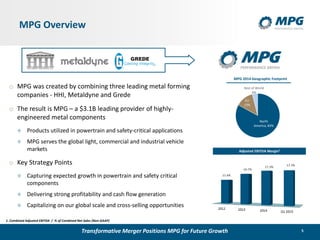
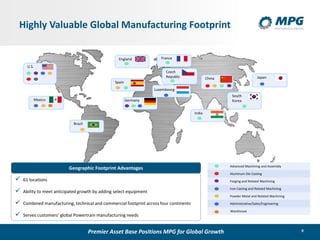
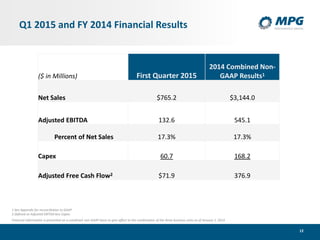
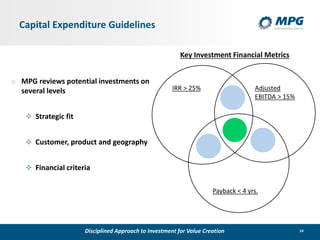
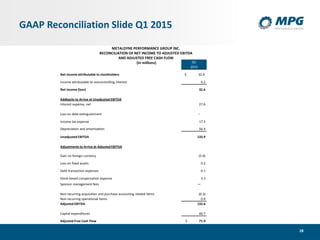
MPG provides a summary of its Q1 2015 financial results and reaffirms its full year 2015 guidance. Key highlights include:
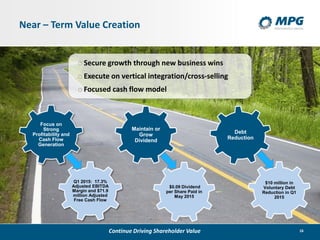
- Q1 2015 net sales of $765.2 million and adjusted EBITDA of $132.6 million, representing 17.3% of net sales
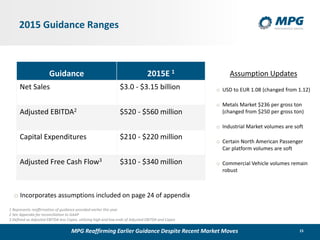
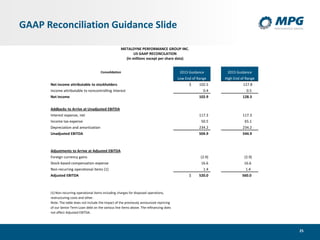
- Reaffirms 2015 guidance ranges of net sales $3.0-3.15 billion, adjusted EBITDA $520-560 million, and adjusted free cash flow of $310-340 million
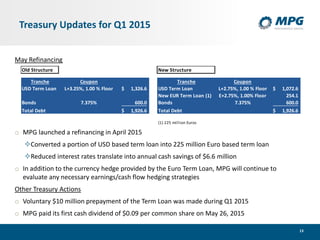
- Completed a refinancing in May 2015 which is expected to result in $6.6 million in annual interest expense savings