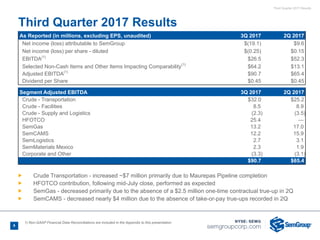
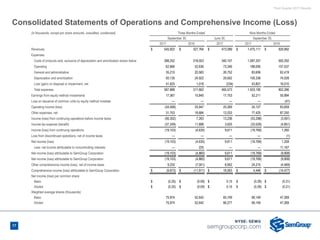
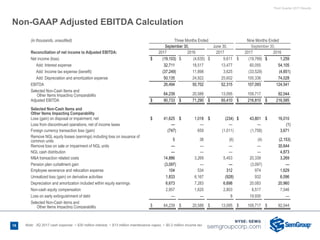
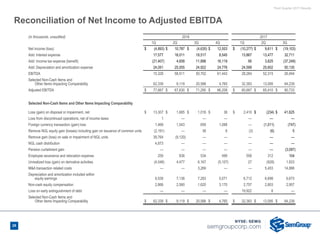
- SemGroup reported a 40% increase in Adjusted EBITDA for the third quarter compared to the second quarter due to the Maurepas Pipeline becoming fully operational and the acquisition of HFOTCO commencing in mid-July.
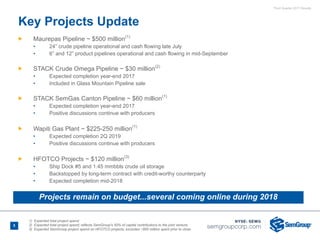
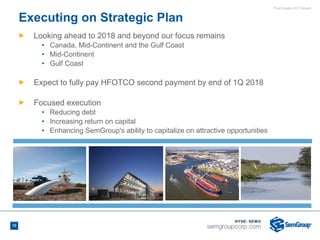
- SemGroup's strategic focus is on growing EBITDA through increased secure cash flows from core geographic regions like Canada, the Mid-Continent region, and the Gulf Coast.
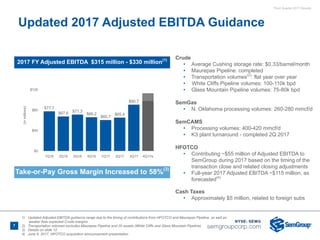
- SemGroup is making progress on raising the $600 million needed for the second payment for the HFOTCO acquisition, with plans to fully pay by the end of the first quarter of 2018 to capture an early payment discount, including through the sale of its interest in the Glass Mountain Pipeline for $